 🏷️ Likely Rental
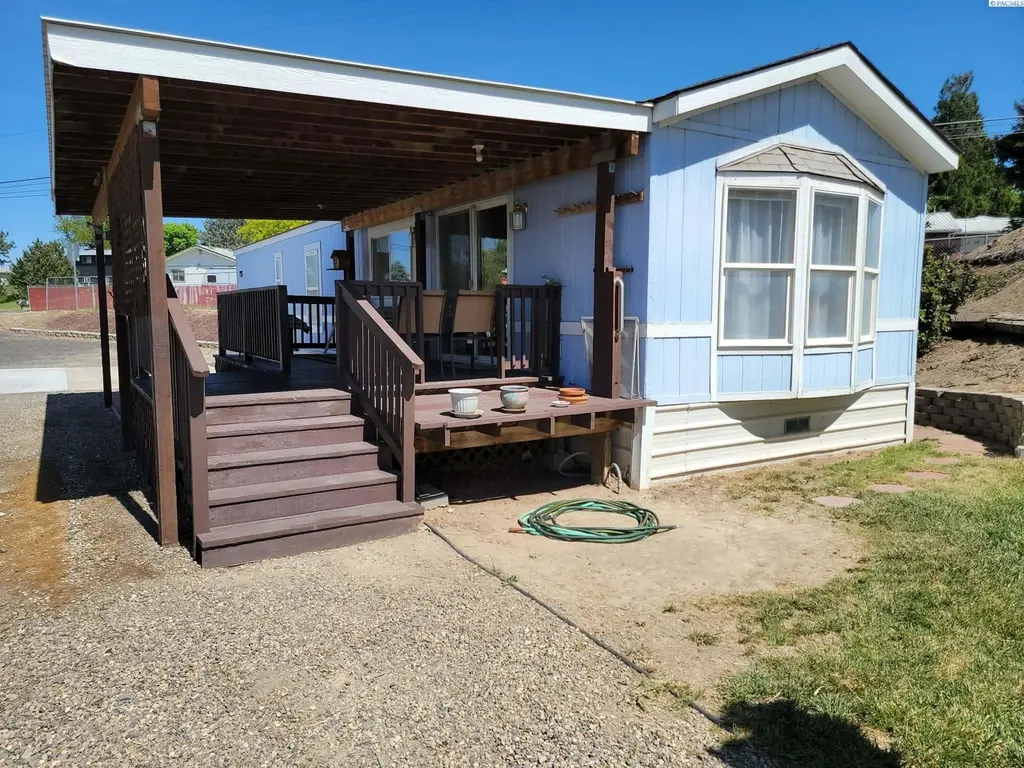
1200 S Euclid #75 St #75 · Grandview, WA
Flood risk 4/10 · Minor
- FEMA flood zone
- X (unshaded)
- Chance of flooding over 30 yrs
- 0.22%
- Est. flood insurance / yr
- $507 – $1,088
Fire risk 1/10 · Minimal
- Est. fire insurance / yr
- $604 – $1,122
Heat risk 5/10 · Moderate
- Hot days now (above 98°F)
- 7 days/yr
- Hot days in 30 yrs
- 15 days/yr
Wind risk 1/10 · Minimal
- Chance of severe wind over 30 yrs
- —
Air-quality risk 9/10 · Severe
- Unhealthy air days now
- 13 days/yr
- Unhealthy air days in 30 yrs
- 13 days/yr
Risk factors via First Street. Map © Google.
Why this score? — see what drove the B- grade
The composite is a weighted blend of 9 inputs, each scored 0–100. Each bar is that input's sub-score; the figure is the points it added to the 100-point composite (weight × sub-score).
- Cash flow +30.0/30.0
- 1% rule +10.0/10.0
- DSCR +10.0/10.0
- ARV discount +7.5/15.0
- Schools +3.9/10.0
- Livability +3.4/5.0
- Rent growth +2.5/5.0
- Condition / age +2.5/5.0
- Appreciation +0.0/10.0
$68,000
🖨 Deal sheet 📄 Offer letter ✓ Due diligence
Listing remarks
MLS# 292791 Beautiful 2 bedroom, 1 bathroom with central heat and air. Pellet Stove was added in 2020 and is fully inspected and approved by Labor and Industry. 40 bags of pellets included in sale. Space rent is $600 per month. Mobile Home can be removed with lot being placed back to original appearance. Call your Realtor today to view and purchase. Thank you.
Key facts
- Central heat and air
- Pellet stove
- Fully inspected
Tags
Property features AI
Finance
- Other: Property type: Residential — Manufactured Home on rented lot
- HOA & community: Located in Quail Run (manufactured home park); Subdivision: GRANDVIEW
Exterior
- Parking: No garage
- Utilities: Public water; Sewer connected; Electric on property
- Home design: Manufactured home (single wide); One story
- Construction: Frame construction with wood siding; Composition roof; New construction
- Exterior features: Deck; Garden
Interior
- Kitchen: Range / Oven; Microwave; Refrigerator; Dishwasher not listed
- Flooring: Carpet; Laminate
- Bathrooms: 1 full bathroom
- Heating & cooling: Central air conditioning (electric); Electric heating
- Interior features: Includes fireplace; Lighting
- Laundry & utility: Washer and dryer included
Neighborhood map
What this means for you Summary
Snapshot
- This is a 2-bed/1.0-bath single-family listed at $68k.
Deal economics
- At list price, monthly cash flow is $658 ($8k/yr) — positive.
- The deal already cash-flows at list — no discount required.
- Meets the 1% rule at list price ($1k rent vs $68k).
- Recommended offer: $66k (3.0% below list) — sets the bar for market timing.
- Cap rate 17.9% vs local median 2.2% in Grandview — top-decile yield for the area; either an underpriced asset or a hidden risk that comps aren't pricing in. Stress-test before assuming the spread holds.
Location & tenants
- Location reads 67/100 on livability (#308 in WA) — a middle-class / working-renter tenant base. Strengths: cost of living A+, housing A+; Watch: schools D, crime D, amenities F.
- Grandview School District (town): math 47% / reading 40% proficiency, ranked #203 of 291 in WA (top 70%) — families likely to look elsewhere, expect single-tenant / working-renter base with shorter leases; 73% free/reduced lunch — lower-income household profile, screen leases tightly.
- Market conditions: 193 active listings in the ZIP; 2 comparable units currently listed for rent nearby; 468 units permitted in Yakima County in 2024 (23 in 5+ unit buildings).
Forward outlook
- Local home prices are declining (-3.0%/yr); year-one equity from $470 of loan paydown is wiped out by about $2k of value loss. Plan a longer hold.
- Yakima County population projected at +6% by 2050 — modest demand growth; plan on rents tracking national, not racing it.
- At projected returns (-3.0% appreciation + 3.0% rent growth), your $19k cash investment doubles in ~3 years — after that, you're playing with house money.
Negotiation context
- It's been on market 42 days — a 3% lower offer ($66k) is reasonable based on typical stale-listing flexibility.
Risks & watch-outs
- Climate carrying-cost: extreme-heat days projected 7→15/yr by 2055 (HVAC capex compounding) — expect insurance premiums to compound above CPI over the hold.
Questions for the listing agent
- It's been on market 42 days. Have you received any prior offers? Is the seller open to a 3% concession, seller financing, or rate buy-down credit?
- Is there a deadline driving the sale (1031 exchange, divorce, estate, relocation)? That informs how much negotiation room exists.
- Schools are D-rated, which usually means shorter tenancies and higher turnover. Who's the typical renter profile here, and what's been the actual vacancy rate?
- Crime grade is D in this area — have there been break-ins, vandalism, or insurance claims at this property in the last 3 years? What carrier currently insures it and at what premium?
- What's the average days-on-market for RENTAL listings here right now (not sales)? A rising rental-DOM trend means longer vacancies and softer asking-rent achievability than the comps imply.
- What's the recent tenant-quality profile in this submarket — average credit score on applications, eviction rate, late-payment / NSF rate, and stable-employment percentage? A property-management company in the area should have these aggregated.
- How much new for-sale + rental construction is in the pipeline within 1–3 miles? Heavy new supply typically softens prices + rents 12–24 months out; constrained supply supports both.
Investment metrics
- 1% rule
- 2.10% ✓
- Cap rate
- 17.91%
- Cash-on-cash
- 41.50%
- DSCR
- 2.85
- GRM
- 4.0
CMA / ARV
- ARV (median comp)
- $136,837
- List price
- $68,000
- Delta
- -50.31%
- Verdict
- UNDERPRICED
- Comps
- 2 within 2.0 mi
Show comp detail 2 sales within ~0.75 mi
| Address | Dist | Beds/Ba | Sqft | Sold | Price | $/sf | Match |
|---|---|---|---|---|---|---|---|
| 609 W 5th St | 0.66mi | 2/1.0 | 775 (-1%) | 10mo | $250,000 | $323 | 59 |
| 803 Hillcrest Rd | 0.44mi | 2/1.0 | 748 (-5%) | 17mo | $160,000 | $214 | 58 |
Match score weights: distance 35% · size 25% · config 20% · recency 20%. Top-matched comps best support the ARV.
Projected returns pro-forma
-3.0% appreciation · 3.0% rent growth · sell at horizon
- IRR
- 38.1%
- Equity multiple
- 2.63×
- Total profit
- $30,942
- Equity at exit
- $10,139
- IRR
- 44.6%
- Equity multiple
- 5.26×
- Total profit
- $81,034
- Equity at exit
- $5,879
Cash invested: $19,040 (down + closing). Projections, not guarantees.
Landlord ↔ Tenant lean methodology
- Overall (STATE)
- 28 Tenant-Leaning
- State Washington
- 28 Tenant-Leaning · D+8
- County
- — inherits STATE
- City
- — inherits STATE
ZIP-level market 98930
- Home prices YoY
- -16.7%
- Active inventory
- 193
- Price-to-rent
- 4.0×
Monthly cashflow live
- Estimated rent
- $1,428 medium interval (Pro) →
- Mortgage (P&I)
- −$357
- Tax est. 1.5%
- −$85 /mo · $1,020/yr
- Insurance
- −$28
- HOA
- −$0
- Vacancy / Maint / Mgmt
- −$300
- Net cashflow
- $658
Break-even live
UW: 25.0% down · 7.5% · 30yr · 1.5% tax · 5.0% vac · 8.0% maint · 8.0% mgmt
Financing live
Cash to close
- Down payment
- $17,000
- Closing costs
- $2,040
- Reserves months
- —
- Total cash needed
- —
Loan-product check · same deal, 3 products live
Conventional
25% down · 7.5% · 30yr
- Down + closing
- —
- Monthly P&I
- —
- Monthly cashflow
- —
- DSCR
- —
- Eligible?
- —
Personal DTI + credit; lowest rate.
DSCR
20% down · 8.5% · 30yr
- Down + closing
- —
- Monthly P&I
- —
- Monthly cashflow
- —
- DSCR
- —
- Eligible?
- —
No personal income docs; deal must DSCR.
Hard money
10% down · 12.0% · 12mo
- Down + closing
- —
- Monthly P&I
- —
- Monthly cashflow
- —
- DSCR
- —
- Eligible?
- —
Short-term bridge; refi at stabilization.
Rent comps 2 comps
| Address | Beds | Baths | Sqft | Rent | $/sqft | DOM | Units | Dist |
|---|---|---|---|---|---|---|---|---|
| 1002 Hillcrest St Grandview, WA | 2.0 | 1.0 | 888 | $1,195 | $1.35 | 43d | 1 | 0.30mi |
| 1007 Grandridge Rd Unit C202 Grandview, WA | 2.0 | 2.0 | 963 | $1,885 | $1.96 | 43d | 1 | 0.54mi |
Listing history 16 events
-
2026-06-18days on market $68,000 Active 42 DOM
-
2026-06-17days on market $68,000 Active 41 DOM
-
2026-06-16days on market $68,000 Active 40 DOM
-
2026-06-15days on market $68,000 Active 39 DOM
-
2026-06-15days on market $68,000 Active 38 DOM
-
2026-06-13days on market $68,000 Active 37 DOM
-
2026-06-12days on market $68,000 Active 36 DOM
-
2026-06-09days on market $68,000 Active 33 DOM
-
2026-06-08days on market $68,000 Active 32 DOM
-
2026-06-08days on market $68,000 Active 31 DOM
-
2026-06-05days on market $68,000 Active 29 DOM
-
2026-06-03days on market $68,000 Active 27 DOM
-
2026-06-02days on market $68,000 Active 26 DOM
-
2026-06-01days on market $68,000 Active 25 DOM
-
2026-05-31days on market $68,000 Active 24 DOM
-
2026-05-07$78,000 Active 362-char remark
ⓘ Source: listings_history table (triggers on properties + properties_extension) + one-shot
backfill from property_details.listing_events for pre-trigger history.
Climate risk First Street
- Flood 4/10 Moderate FEMA zone X (unshaded) · 22% chance over 30 yrs
- Wildfire 1/10 Low
- Heat 5/10 Major 7 d/yr ≥98°F today · 15 d/yr by 30 yrs out
- Wind 1/10 Low
- Air quality 9/10 Extreme 13 unhealthy d/yr today · 13 by 30 yrs out
Nearby sold comps map
Loading sold comps map…
Walkable amenities ~0.75 mi
Loading nearby amenities…
Taxation est. · year 1
- Rental income
- $17,140
- − Mortgage interest
- −$3,809
- − Property taxes
- −$1,020
- − Insurance
- −$340
- − Repairs & maintenance
- −$1,371
- − Management
- −$1,371
- − Depreciation
- −$1,978
- Taxable income
- $7,251
- Est. tax owed @ 24.0%
- −$1,740
- After-tax cash flow
- $6,162/yr
For passive investors: Depreciation is non-cash, so a rental often shows a tax loss while cash-flowing — sheltering income. Rental losses are passive: they offset passive income freely, and up to $25,000/yr can offset ordinary (W-2) income if you actively participate and your MAGI is under $100k (phasing out to $0 by $150k); unused losses carry forward. On sale, claimed depreciation is recaptured at up to 25%, and gains may owe capital-gains tax (a 1031 exchange can defer both). Figures are a year-1 estimate at your 24.0% rate — not tax advice; consult a CPA.
Schools (NCES district)
- District
- Grandview School District
- NCES district ID
- 5303150
- Math proficiency
- 47% ▲ 8.00%
- Reading proficiency
- 40% ▬ 0.00%
- Median HH income
- $43,388
- Composite
- 39.06/100
- National rank
- #8271
- State rank
- #203 of 291 in WA
Livability — Grandview
- Score
- 67/100
- State rank
- #308
- US rank
- #10853
Category grades
Schools grade is shown separately in the Schools card above.
Census & demographics
- Census place
- Grandview, WA
- Population (ZIP)
- 15,071
Population outlook (Yakima County) Hauer SSP2
- Today (2025)
- 256,514 people
- By 2030
- 259,403 · +1.1%
- By 2040
- 265,677 · +3.6%
- By 2050
- 273,061 · +6.5%
- By 2075
- 296,991 · +15.8%
- By 2100
- 315,291 · +22.9%
Race, ethnicity, and origin ACS 2023
- Neighborhood character
- Predominantly Hispanic (79%)
- Race & ethnicity
- Hispanic / Latino 79% Two or more races 27% White 18% Native American 1%
- Hispanic origin (detail)
- Mexican 77%
- Common ancestry
- Italian 2% Portuguese 1% Iranian 1%
- Foreign-born
- 27% · Canada
- Languages at home
- 33% English-only · Spanish 65%
Political lean MEDSL · Yakima
- 2024 margin
- R (+14.3) · D 41.6% · R 55.9% · Other 2.5%
- 2008→2024 swing
- -3.8pp toward R · 2008: -10.6pp · 2024: -14.3pp
- All cycles
- 2024: R+14.3 2020: R+7.7 2016: R+15.4 2012: R+15.1 2008: R+10.6
Not yet ingested
- Civics
- —
Market trends
- HPI YoY
- ▼ -65.13%
- Current HPI
- 324.6036
- Rent YoY
- —
- Metro
- —
- State GDP YoY
- ▲ 4.65%
- F500 in state
- 22
Industry mix (Fortune 500 HQ in WA)
| Industry | F500 HQs | Revenue |
|---|---|---|
| Retail | 2 | $269B |
|
||
| Technology / Retail | 1 | $638B |
|
||
| Technology | 1 | $245B |
|
||
| Telecommunications | 1 | $38B |
|
||
| Food / Beverage | 1 | $36B |
|
||
| Automotive / Trucks | 1 | $34B |
|
||
Price history
-12.8% since first listed2 events — show timeline
- 2026-05-29 Price Changed $68,000 PACMLS
- 2026-05-07 Listed $78,000 PACMLS
Cash-flow waterfall
monthlySold comps — $/sqft
last 12 mo · ≤1 miLoading sold comps…