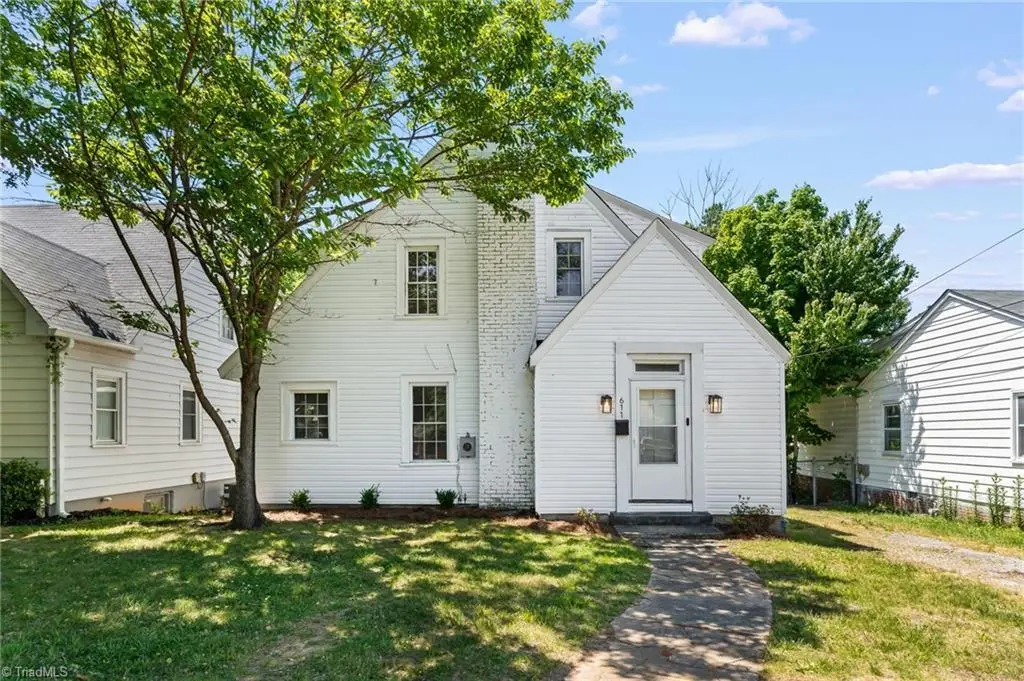
611 W Lexington Ave · High Point, NC
Flood risk 1/10 · Minimal
- FEMA flood zone
- X (unshaded)
- Chance of flooding over 30 yrs
- 0.0%
- Est. flood insurance / yr
- $473 – $860
Fire risk 3/10 · Minor
- Est. fire insurance / yr
- $906 – $1,684
Heat risk 5/10 · Moderate
- Hot days now (above 104°F)
- 7 days/yr
- Hot days in 30 yrs
- 17 days/yr
Wind risk 4/10 · Minor
- Chance of severe wind over 30 yrs
- 14.0%
Air-quality risk 2/10 · Minimal
- Unhealthy air days now
- 1 days/yr
- Unhealthy air days in 30 yrs
- 1 days/yr
Risk factors via First Street. Map © Google.
Why this score? — see what drove the B- grade
The composite is a weighted blend of 9 inputs, each scored 0–100. Each bar is that input's sub-score; the figure is the points it added to the 100-point composite (weight × sub-score).
- Cash flow +24.3/30.0
- ARV discount +15.0/15.0
- DSCR +7.8/10.0
- 1% rule +5.8/10.0
- Livability +3.9/5.0
- Schools +3.6/10.0
- Rent growth +2.7/5.0
- Condition / age +2.5/5.0
- Appreciation +0.0/10.0
$150,000
🖨 Deal sheet (PDF) 📄 Offer letter ✓ Due diligence
Listing remarks
This charming 1920s folk cottage near Emerywood has the kind of character that newer construction simply cannot replicate. Original hardwood floors, solid bones, and a generous backyard make this an inviting canvas. Recent window updates are already done, and main-level laundry adds everyday convenience. At a smart entry price point, this is an ideal opportunity—whether you're an investor looking for a solid return or a buyer ready to build real equity. Come see what this little house has to offer.
Key facts
- Generous backyard
- 7,405 sq ft lot
- Built 1926
Tags
Property features AI
Finance
- HOA & community: No association
Exterior
- Parking: Driveway
- Utilities: Public water; Public sewer; Electric water heater; Natural gas heating
- Home design: Residential stick/site-built house; Two levels; Built in 1926; Living room fireplace
- Construction: Vinyl siding; Unfinished basement with crawl space; Basement area approximately 180 (unit not shown)
- Exterior features: Public water supply; Public sewer; Public maintained road; 51 x 150 lot (0.17 acre)
Interior
- Kitchen: Kitchen on main level
- Bedrooms: Two bedrooms on the second level
- Flooring: Carpet; Vinyl; Wood
- Bathrooms: One full bathroom
- Heating & cooling: Forced air heating (natural gas); Window air conditioning units
- Interior features: Carpet, vinyl and wood flooring; Sump pump
- Laundry & utility: Washer hookup and dryer connection on main level; Electric water heater
Neighborhood map
What this means for you Summary
Snapshot
- This is a 3-bed/1.0-bath single-family listed at $150k.
Deal economics
- At list price, monthly cash flow is $301 ($4k/yr) — positive.
- The deal already cash-flows at list — no discount required.
- Meets the 1% rule at list price ($2k rent vs $150k).
- Recommended offer: $146k (3.0% below list) — sets the bar for market timing.
- Cap rate 8.7% vs local median 4.0% in High Point — top-decile yield for the area; either an underpriced asset or a hidden risk that comps aren't pricing in. Stress-test before assuming the spread holds.
Location & tenants
- Location reads 77/100 on livability (#31 in NC, #3,084 nationally) — a middle-class / working-renter tenant base. Strengths: commute A+, cost of living A+, housing A+; Watch: amenities D, employment D, crime F.
- Guilford County Schools (urban): math 39% / reading 45% proficiency, ranked #99 of 178 in NC (top 56%) — families likely to look elsewhere, expect single-tenant / working-renter base with shorter leases.
- Zoned schools: Northwood Elementary (math 28% / reading 27%, grade F, #1,028 of 1,410 statewide, top 73%, 469 students, 99% FRL); Ferndale Middle (math 16% / reading 32%, grade F, #401 of 475 statewide, top 84%, 537 students, 99% FRL); High Point Central High (math 48% / reading 42%, grade D-, #350 of 535 statewide, top 66%, 1,081 students, 100% FRL) — zoned schools average 100% FRL vs 52% district-wide (47 pts higher); higher-poverty schools than district average — tighter screening recommended.
- Market conditions: Rents flat; 124 active listings in the ZIP; 15 comparable units currently listed for rent nearby; rentals at typical pace (median 23d on market — plan ~3-4 weeks tenant-placement turnaround); 3,843 units permitted in Guilford County in 2024 (2,397 in 5+ unit buildings).
- This rent runs 30% of the median local income ($65k/yr) — at the standard rent-burdened threshold; future hikes will face affordability resistance.
Forward outlook
- Local home prices are declining (-3.0%/yr); year-one equity from $1k of loan paydown is wiped out by about $4k of value loss. Plan a longer hold.
- Guilford County population projected at +26% by 2050 — long-run rental-demand tailwind backs the buy-and-hold thesis.
Negotiation context
- It's been on market 36 days — a 3% lower offer ($146k) is reasonable based on typical stale-listing flexibility.
Risks & watch-outs
- Watch-outs: built in 1926 — expect roof / HVAC / electrical / plumbing capex.
- Climate carrying-cost: extreme-heat days projected 7→17/yr by 2055 (HVAC capex compounding) — expect insurance premiums to compound above CPI over the hold.
Questions for the listing agent
- It's been on market 36 days. Have you received any prior offers? Is the seller open to a 3% concession, seller financing, or rate buy-down credit?
- Built in 1926 — when were the roof, HVAC, electrical panel, plumbing, and water heater last replaced?
- Is there a deadline driving the sale (1031 exchange, divorce, estate, relocation)? That informs how much negotiation room exists.
- Schools are D-rated, which usually means shorter tenancies and higher turnover. Who's the typical renter profile here, and what's been the actual vacancy rate?
- Crime grade is F in this area — have there been break-ins, vandalism, or insurance claims at this property in the last 3 years? What carrier currently insures it and at what premium?
- What's the average days-on-market for RENTAL listings here right now (not sales)? A rising rental-DOM trend means longer vacancies and softer asking-rent achievability than the comps imply.
- What's the recent tenant-quality profile in this submarket — average credit score on applications, eviction rate, late-payment / NSF rate, and stable-employment percentage? A property-management company in the area should have these aggregated.
- How much new for-sale + rental construction is in the pipeline within 1–3 miles? Heavy new supply typically softens prices + rents 12–24 months out; constrained supply supports both.
Investment metrics
- 1% rule
- 1.08% ✓
- Cap rate
- 8.70%
- Cash-on-cash
- 8.60%
- DSCR
- 1.38
- GRM
- 7.7
CMA / ARV
- ARV (on-the-fly)
- $238,628
- Comps found
- 9
Show comp detail 9 sales within ~0.75 mi
| Address | Dist | Beds/Ba | Sqft | Sold | Price | $/sf | Match |
|---|---|---|---|---|---|---|---|
| 443 W Lexington Ave | 0.17mi | 2/2.0 (-1) | 1,361 (-4%) | 2mo | $230,000 | $169 | 75 |
| 512 Rockspring Rd | 0.15mi | 3/1.5 | 1,487 (+5%) | 16mo | $263,000 | $177 | 68 |
| 707 Rockspring Rd | 0.18mi | 3/1.5 | 1,502 (+6%) | 14mo | $234,250 | $156 | 67 |
| 615 Rockspring Rd | 0.07mi | 3/2.0 | 1,331 (-6%) | 23mo | $226,000 | $170 | 64 |
| 1205 Robin Hood Rd | 0.48mi | 3/2.0 | 1,504 (+6%) | 1mo | $239,000 | $159 | 62 |
| 428 Lexington Ave | 0.16mi | 3/1.0 | 1,216 (-14%) | 16mo | $216,500 | $178 | 56 |
| 510 Rockspring Rd | 0.17mi | 3/1.5 | 1,616 (+14%) | 14mo | $252,500 | $156 | 55 |
| 1228 Dovershire Pl | 0.49mi | 3/2.0 | 1,560 (+10%) | 6mo | $285,000 | $183 | 51 |
| 1314 Florida St | 0.38mi | 3/2.0 | 1,582 (+12%) | 16mo | $265,000 | $168 | 45 |
Match score weights: distance 35% · size 25% · config 20% · recency 20%. Top-matched comps best support the ARV.
Projected returns pro-forma
-3.0% appreciation · 0.9% rent growth · sell at horizon
- IRR
- -5.6%
- Equity multiple
- 0.80×
- Total profit
- $-8,513
- Equity at exit
- $22,365
- IRR
- 1.5%
- Equity multiple
- 1.10×
- Total profit
- $3,994
- Equity at exit
- $12,969
Cash invested: $42,000 (down + closing). Projections, not guarantees.
Landlord ↔ Tenant lean methodology
- Overall (STATE)
- 85 Strongly Landlord-Friendly
- State North Carolina
- 85 Strongly Landlord-Friendly · R+3
- County
- — inherits STATE
- City
- — inherits STATE
ZIP-level market 27262
- Rents YoY
- 0.9%
- Active inventory
- 124
- Price-to-rent
- 7.7×
Monthly cashflow live
- Estimated rent
- $1,626 high interval (Pro) →
- Mortgage (P&I)
- −$787
- Tax from tax record
- −$135 /mo · $1,616/yr
- Insurance
- −$62
- HOA
- −$0
- Vacancy / Maint / Mgmt
- −$342
- Net cashflow
- $301
Break-even live
Sensitivity live
| Price | -10% $386 | -5% $343 | +0% $301 | +5% $258 | +10% $216 |
|---|---|---|---|---|---|
| Rent | -10% $172 | -5% $237 | +0% $301 | +5% $365 | +10% $429 |
| Rate | -1.0pp $376 | -0.5pp $339 | base $301 | +0.5pp $262 | +1.0pp $223 |
UW: 25.0% down · 7.5% · 30yr · 1.5% tax · 5.0% vac · 8.0% maint · 8.0% mgmt
Financing live
Cash to close
- Down payment
- $37,500
- Closing costs
- $4,500
- Reserves months
- —
- Total cash needed
- —
Loan-product check · same deal, 3 products live
Conventional
25% down · 7.5% · 30yr
- Down + closing
- —
- Monthly P&I
- —
- Monthly cashflow
- —
- DSCR
- —
- Eligible?
- —
Personal DTI + credit; lowest rate.
DSCR
20% down · 8.5% · 30yr
- Down + closing
- —
- Monthly P&I
- —
- Monthly cashflow
- —
- DSCR
- —
- Eligible?
- —
No personal income docs; deal must DSCR.
Hard money
10% down · 12.0% · 12mo
- Down + closing
- —
- Monthly P&I
- —
- Monthly cashflow
- —
- DSCR
- —
- Eligible?
- —
Short-term bridge; refi at stabilization.
Rent comps 15 comps
| Address | Beds | Baths | Sqft | Rent | $/sqft | DOM | Units | Dist |
|---|---|---|---|---|---|---|---|---|
| 706 Westchester Dr High Point, NC | 1.0–3.0 | 1.0–2.0 | 1012 | $1,190 | $1.18 | 16d | 10 | 0.27mi |
| 1508 Whitehall St High Point, NC | 3.0 | 2.0 | 1616 | $1,800 | $1.11 | 25d | 1 | 0.28mi |
| 1910 Whitehall St High Point, NC | 3.0 | 1.0 | 925 | $1,095 | $1.18 | 25d | 1 | 0.48mi |
| 1503 Larkin St High Point, NC | 4.0 | 3.0 | 1688 | $2,250 | $1.33 | 25d | 1 | 0.85mi |
| 205 Guilford Ave High Point, NC | 3.0 | 1.5 | 1255 | $1,350 | $1.08 | 20d | 1 | 0.88mi |
| 1208 Madison St High Point, NC | 4.0 | 2.5 | 1550 | $1,745 | $1.13 | 25d | 1 | 0.97mi |
| 177 W Hartley Dr High Point, NC | 1.0–2.0 | 1.0–2.0 | 818 | $1,218 | $1.49 | 16d | 8 | 1.13mi |
| 2120 Chester Ridge Dr High Point, NC | 1.0–3.0 | 1.0–2.0 | 1001 | $1,443 | $1.44 | 16d | 7 | 1.22mi |
| 704 E Lexington Ave High Point, NC | 2.0 | 1.0 | 984 | $1,495 | $1.52 | 23d | 1 | 1.27mi |
| 2231 Shadow Valley Rd High Point, NC | 1.0–3.0 | 1.0–2.0 | 942 | $1,599 | $1.70 | 25d | 1 | 1.31mi |
| 829 Putnam St High Point, NC | 4.0 | 1.0 | 1013 | $1,695 | $1.67 | 25d | 1 | 1.33mi |
| 1635 W Lexington Ave High Point, NC | 3.0 | 2.0 | 1730 | $2,100 | $1.21 | 16d | 1 | 1.44mi |
| 2459 Shadow Valley Rd High Point, NC | 3.0 | 2.0 | 1266 | $1,950 | $1.54 | 16d | 1 | 1.46mi |
| 1110 Adams St High Point, NC | 3.0 | 1.0 | 1278 | $1,340 | $1.05 | 25d | 1 | 1.49mi |
| 409 Woodrow Ave High Point, NC | 4.0 | 2.0 | 1863 | $2,650 | $1.42 | 20d | 1 | 1.49mi |
Listing history 8 events
-
2026-06-07statusdays on market $150,000 Pending 36 DOM
-
2026-06-03days on market $150,000 Due Diligence Period 33 DOM
-
2026-06-02days on market $150,000 Due Diligence Period 32 DOM
-
2026-06-01days on market $150,000 Due Diligence Period 31 DOM
-
2026-05-31days on market $150,000 Due Diligence Period 30 DOM
-
2026-05-31days on market $150,000 Due Diligence Period 29 DOM
-
2026-05-15price $150,000
-
2026-04-30$160,000 Active
ⓘ Source: listings_history table (triggers on properties + properties_extension) + one-shot
backfill from property_details.listing_events for pre-trigger history.
Tax reassessment forecast NC · Resets to sale price
- Current annual tax
- $1,616 · $135/mo
- Projected year-2 tax
- $1,616 · $135/mo
- Expected delta
- $0/yr ($0/mo · 0.0%)
ⓘ Screening estimate from a state-policy table — verify with the county assessor before closing.
Climate risk First Street
- Flood 1/10 Low FEMA zone X (unshaded) · 0% chance over 30 yrs
- Wildfire 3/10 Moderate
- Heat 5/10 Major 7 d/yr ≥104°F today · 17 d/yr by 30 yrs out
- Wind 4/10 Moderate 14% chance of damaging wind over 30 yrs
- Air quality 2/10 Low 1 unhealthy d/yr today · 1 by 30 yrs out
Nearby sold comps map
Loading sold comps map…
Walkable amenities ~0.75 mi
Loading nearby amenities…
Taxation est. · year 1
- Rental income
- $19,515
- − Mortgage interest
- −$8,402
- − Property taxes
- −$1,616
- − Insurance
- −$750
- − Repairs & maintenance
- −$1,561
- − Management
- −$1,561
- − Depreciation
- −$4,364
- Taxable income
- $1,260
- Est. tax owed @ 24.0%
- −$303
- After-tax cash flow
- $3,309/yr
For passive investors: Depreciation is non-cash, so a rental often shows a tax loss while cash-flowing — sheltering income. Rental losses are passive: they offset passive income freely, and up to $25,000/yr can offset ordinary (W-2) income if you actively participate and your MAGI is under $100k (phasing out to $0 by $150k); unused losses carry forward. On sale, claimed depreciation is recaptured at up to 25%, and gains may owe capital-gains tax (a 1031 exchange can defer both). Figures are a year-1 estimate at your 24.0% rate — not tax advice; consult a CPA.
Schools (NCES district)
- District
- Guilford County Schools
- NCES district ID
- 3701920
- Math proficiency
- 39% ▲ 1.00%
- Reading proficiency
- 45% ▲ 1.00%
- Median HH income
- $46,315
- Composite
- 35.78/100
- National rank
- #4842
- State rank
- #99 of 178 in NC
Livability — High Point
- Score
- 77/100
- State rank
- #31
- US rank
- #3084
Category grades
Schools grade is shown separately in the Schools card above.
Census & demographics
- Census place
- High Point, NC
- County
- Guilford County · 487,190 people
- City population
- 102,450
- Metro
- Greensboro-High Point, NC
- Population (ZIP)
- 28,353
- Household income
- $65,006
- Rent vs Own
- Severe rent burden
- 1046.0
Population outlook (Guilford County) Hauer SSP2
- Today (2025)
- 584,596 people
- By 2030
- 616,851 · +5.5%
- By 2040
- 678,451 · +16.1%
- By 2050
- 734,788 · +25.7%
- By 2075
- 862,985 · +47.6%
- By 2100
- 948,704 · +62.3%
Race, ethnicity, and origin ACS 2023
- Neighborhood character
- Diverse neighborhood (Simpson 0.65)
- Race & ethnicity
- White 50% Black 30% Hispanic / Latino 12% Two or more races 7% Asian 4%
- Hispanic origin (detail)
- Mexican 8% Puerto Rican 1%
- Common ancestry
- Slovak 4% Italian 2% Lithuanian 1%
- Foreign-born
- 14% · Canada
- Languages at home
- 80% English-only · Spanish 10% Other Indo-European 5% Other Asian/Pacific 1%
Political lean MEDSL · Guilford
- 2024 margin
- Strong D (+21.8) · D 60.2% · R 38.4% · Other 1.4%
- 2008→2024 swing
- +3.5pp toward D · 2008: 18.4pp · 2024: 21.8pp
- All cycles
- 2024: D+21.8 2020: D+23.1 2016: D+20.0 2012: D+16.5 2008: D+18.4
Not yet ingested
- Civics
- —
Market trends
- HPI YoY
- ▼ -279.14%
- Current HPI
- 205.6152
- Rent YoY
- ▲ 0.90%
- Metro
- Greensboro-High Point, NC
- State GDP YoY
- ▲ 3.28%
- F500 in state
- 26
Industry mix (Fortune 500 HQ in NC)
| Industry | F500 HQs | Revenue |
|---|---|---|
| Financial Services | 2 | $213B |
|
||
| Retail | 2 | $95B |
|
||
| Industrial Conglomerate | 1 | $38B |
|
||
| Metals / Steel | 1 | $35B |
|
||
| Utilities | 1 | $30B |
|
||
| Industrial Machinery | 1 | $19B |
|
||
Price history
-6.2% since first listed2 events — show timeline
- 2026-05-15 Price Changed $150,000 Triad MLS
- 2026-04-30 Listed $160,000 Triad MLS
Property tax history
+2.1%/yrLatest (2025): $1,616 · +0.0% YoY. Source: county tax records.
Cash-flow waterfall
monthlySold comps — $/sqft
last 12 mo · ≤1 miLoading sold comps…