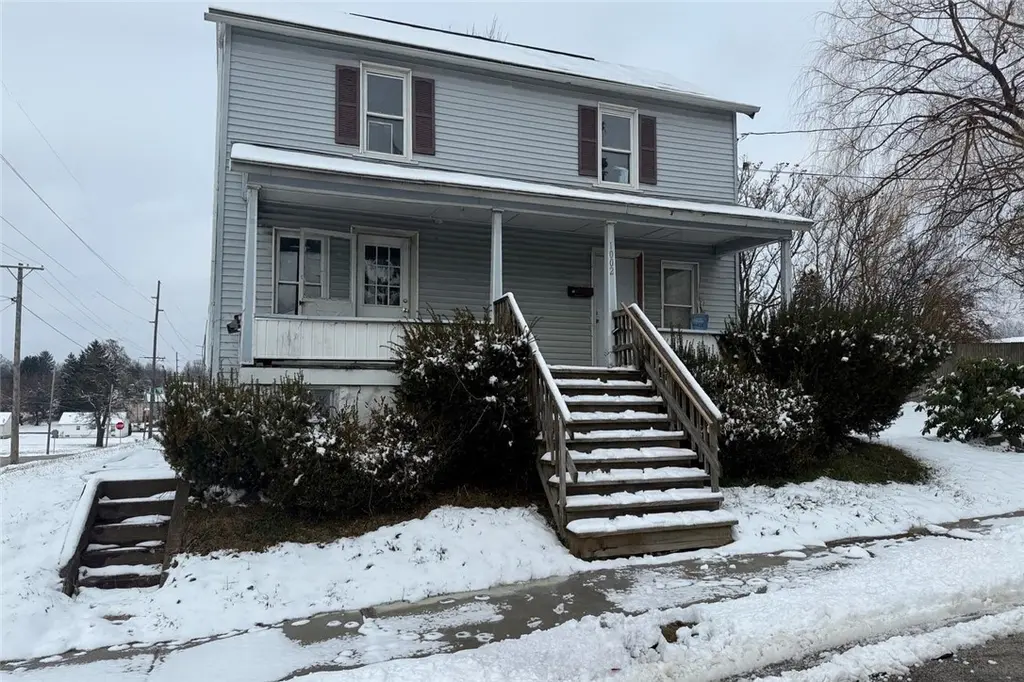
1002 Webster St · Farrell, PA
Flood risk 1/10 · Minimal
- FEMA flood zone
- X (unshaded)
- Chance of flooding over 30 yrs
- 0.0%
- Est. flood insurance / yr
- $507 – $1,088
Fire risk 1/10 · Minimal
- Est. fire insurance / yr
- $511 – $949
Heat risk 3/10 · Minor
- Hot days now (above 97°F)
- 7 days/yr
- Hot days in 30 yrs
- 17 days/yr
Wind risk 1/10 · Minimal
- Chance of severe wind over 30 yrs
- —
Air-quality risk 3/10 · Minor
- Unhealthy air days now
- 2 days/yr
- Unhealthy air days in 30 yrs
- 6 days/yr
Risk factors via First Street. Map © Google.
Why this score? — see what drove the C+ grade
The composite is a weighted blend of 9 inputs, each scored 0–100. Each bar is that input's sub-score; the figure is the points it added to the 100-point composite (weight × sub-score).
- Cash flow +30.0/30.0
- 1% rule +10.0/10.0
- DSCR +10.0/10.0
- Appreciation +3.5/10.0
- Livability +2.6/5.0
- Rent growth +2.5/5.0
- Condition / age +2.5/5.0
- Schools +1.7/10.0
- ARV discount +0.0/15.0
$68,000
🖨 Deal sheet 📄 Offer letter ✓ Due diligence
Listing remarks MLS
Discover this fully rented turn-key duplex, perfect for an investor to add to their portfolio. Each unit features two bedrooms and one full bath, providing comfortable and functional living spaces. Both units are equipped with separate furnaces and separate electric and gas meters, keeping utilities simple and efficient. Owner currently pays water, sewer, and trash. The property also includes a sump pump in the basement, adding peace of mind for long-term maintenance. Whether you're looking to expand your investment portfolio or reduce your monthly expenses by living in one unit, this well-maintained duplex is ready to go from day one!
Key facts
- Sump pump
- Separate furnaces
- Steady rental income
Tags
Neighborhood map
What this means for you Summary
Snapshot
- This is a 4-bed/2.0-bath single-family listed at $68k.
Deal economics
- At list price, monthly cash flow is $374 ($4k/yr) — positive.
- The deal already cash-flows at list — no discount required.
- Meets the 1% rule at list price ($1k rent vs $68k).
- Recommended offer: $60k (12.0% below list) — sets the bar for market timing.
Location & tenants
- Location reads 52/100 on livability (#1,684 in PA) — a working-class tenant base; expect higher turnover. Strengths: cost of living A+, housing A-; Watch: schools F, crime F, amenities F.
- Farrell Area SD (suburban): math 15% / reading 28% proficiency, ranked #492 of 539 in PA (top 91%) — low school quality limits family demand, transient renter base, plan for 1-2y turnover; 91% free/reduced lunch — lower-income household profile, screen leases tightly.
- Market conditions: 15 active listings in the ZIP; 8 comparable units currently listed for rent nearby; rentals leasing fast (median 14d on market — plan ~1-2 weeks tenant-placement turnaround); 62 units permitted in Mercer County in 2024 (0 in 5+ unit buildings).
Forward outlook
- Local home prices are declining (-3.0%/yr); year-one equity from $470 of loan paydown is wiped out by about $2k of value loss. Plan a longer hold.
- Mercer County population projected at -22% by 2050 — secular population decline; favor cash flow + early exit over multi-decade hold.
- At projected returns (-3.0% appreciation + 3.0% rent growth), your $19k cash investment doubles in ~6 years — after that, you're playing with house money.
Negotiation context
- It's been on market 180 days — a 12% lower offer ($60k) is reasonable based on typical stale-listing flexibility.
- 4 sale attempts since 10y ago; this cycle's ask has dropped $16k (19%) from the opening price — seller is motivated, your offer sets the floor, not the list.
- Current owner paid $38k; list at $68k implies a 79% gain — meaningful room to come down on a strong offer.
Questions for the listing agent
- It's been on market 180 days. Have you received any prior offers? Is the seller open to a 12% concession, seller financing, or rate buy-down credit?
- Why hasn't it sold? Are there any deal-killer items the seller is aware of (foundation, flood, title, zoning, code violations)?
- Is there a deadline driving the sale (1031 exchange, divorce, estate, relocation)? That informs how much negotiation room exists.
- Schools are F-rated, which usually means shorter tenancies and higher turnover. Who's the typical renter profile here, and what's been the actual vacancy rate?
- Crime grade is F in this area — have there been break-ins, vandalism, or insurance claims at this property in the last 3 years? What carrier currently insures it and at what premium?
- What's the average days-on-market for RENTAL listings here right now (not sales)? A rising rental-DOM trend means longer vacancies and softer asking-rent achievability than the comps imply.
- What's the recent tenant-quality profile in this submarket — average credit score on applications, eviction rate, late-payment / NSF rate, and stable-employment percentage? A property-management company in the area should have these aggregated.
- How much new for-sale + rental construction is in the pipeline within 1–3 miles? Heavy new supply typically softens prices + rents 12–24 months out; constrained supply supports both.
Investment metrics
- 1% rule
- 1.53% ✓
- Cap rate
- 12.90%
- Cash-on-cash
- 23.60%
- DSCR
- 2.05
- GRM
- 5.4
CMA / ARV
- ARV (median comp)
- $47,617
- List price
- $68,000
- Delta
- 42.81%
- Verdict
- OVERPRICED
- Comps
- 20 within 1.0 mi
Show comp detail 12 sales within ~0.75 mi
| Address | Dist | Beds/Ba | Sqft | Sold | Price | $/sf | Match |
|---|---|---|---|---|---|---|---|
| 522 Wallis Ave | 0.34mi | 3/1.0 (-1) | — | 1mo | $70,000 | — | 62 |
| 310 Hamilton Ave | 0.43mi | 3/1.5 (-1) | — | 3mo | $135,000 | — | 58 |
| 223 Emerson Ave | 0.52mi | 3/2.0 (-1) | — | 3mo | $69,800 | — | 56 |
| 25 Capitol Ct | 0.53mi | 3/1.5 (-1) | — | 2mo | $130,000 | — | 55 |
| 1623 Roemer Blvd | 0.61mi | 3/2.0 (-1) | — | 2mo | $135,000 | — | 52 |
| 1611 Roemer Blvd | 0.59mi | 3/1.0 (-1) | — | 1mo | $130,000 | — | 50 |
| 35 Kedron St | 0.64mi | 3/2.0 (-1) | — | 3mo | $105,000 | — | 50 |
| 1040 March St | 0.56mi | 3/0.5 (-1) | — | 1mo | $40,000 | — | 50 |
| 104 Fruit Ave | 0.63mi | 3/2.5 (-1) | — | 3mo | $90,000 | — | 49 |
| 784 Baldwin Ave | 0.63mi | 3/1.0 (-1) | — | 1mo | $45,000 | — | 48 |
| 1638 Shady Dr | 0.68mi | 3/1.0 (-1) | — | 1mo | $40,000 | — | 46 |
| 1741 Roemer Blvd | 0.71mi | 3/1.5 (-1) | — | 4mo | $56,500 | — | 44 |
Match score weights: distance 35% · size 25% · config 20% · recency 20%. Top-matched comps best support the ARV.
Projected returns pro-forma
-3.0% appreciation · 3.0% rent growth · sell at horizon
- IRR
- 16.7%
- Equity multiple
- 1.67×
- Total profit
- $12,835
- Equity at exit
- $10,139
- IRR
- 25.3%
- Equity multiple
- 3.20×
- Total profit
- $41,902
- Equity at exit
- $5,879
Cash invested: $19,040 (down + closing). Projections, not guarantees.
Landlord ↔ Tenant lean methodology
- Overall (STATE)
- 62 Landlord-Friendly
- State Pennsylvania
- 62 Landlord-Friendly · EVEN
- County
- — inherits STATE
- City
- — inherits STATE
ZIP-level market 16121
- Home prices YoY
- -1.9%
- Active inventory
- 15
- Price-to-rent
- 5.4×
Monthly cashflow live
- Estimated rent
- $1,044 high interval (Pro) →
- Mortgage (P&I)
- −$357
- Tax from tax record
- −$65 /mo · $782/yr
- Insurance
- −$28
- HOA
- −$0
- Vacancy / Maint / Mgmt
- −$219
- Net cashflow
- $374
Break-even live
UW: 25.0% down · 7.5% · 30yr · 1.5% tax · 5.0% vac · 8.0% maint · 8.0% mgmt
Financing live
Cash to close
- Down payment
- $17,000
- Closing costs
- $2,040
- Reserves months
- —
- Total cash needed
- —
Loan-product check · same deal, 3 products live
Conventional
25% down · 7.5% · 30yr
- Down + closing
- —
- Monthly P&I
- —
- Monthly cashflow
- —
- DSCR
- —
- Eligible?
- —
Personal DTI + credit; lowest rate.
DSCR
20% down · 8.5% · 30yr
- Down + closing
- —
- Monthly P&I
- —
- Monthly cashflow
- —
- DSCR
- —
- Eligible?
- —
No personal income docs; deal must DSCR.
Hard money
10% down · 12.0% · 12mo
- Down + closing
- —
- Monthly P&I
- —
- Monthly cashflow
- —
- DSCR
- —
- Eligible?
- —
Short-term bridge; refi at stabilization.
Rent comps 8 comps
| Address | Beds | Baths | Sqft | Rent | $/sqft | DOM | Units | Dist |
|---|---|---|---|---|---|---|---|---|
| 1023 Negley St Farrell, PA | 3.0 | 1.0 | — | $1,095 | — | 13d | 1 | 0.22mi |
| 515 Wallis Ave Farrell, PA | 4.0 | 1.5 | — | $1,100 | — | 44d | 1 | 0.32mi |
| Mercer Ave Wheatland, PA | 3.0 | 1.5 | — | $850 | — | 13d | 1 | 0.63mi |
| 726 Baldwin Ave Sharon, PA | 3.0 | 1.0 | — | $1,100 | — | 13d | 1 | 0.69mi |
| 523 New Castle Ave Sharon, PA | 3.0 | 1.0 | — | $1,000 | — | 13d | 1 | 0.89mi |
| 979 King St Sharon, PA | 3.0 | 1.0 | — | $895 | — | 44d | 1 | 1.10mi |
| 557 Lafayette Ave Sharon, PA | 3.0 | 1.0 | — | $1,000 | — | 13d | 1 | 1.35mi |
| 107 N Oakland Ave Unit 2 Sharon, PA | 3.0 | 1.0 | — | $1,100 | — | 21d | 1 | 1.49mi |
Listing history 14 events
-
2026-06-01days on market $68,000 Active 180 DOM
-
2026-05-31days on market $68,000 Active 179 DOM
-
2026-05-30days on market $68,000 Active 178 DOM
-
2026-04-21price $68,000 643-char remark
Show marketing remark (643 chars)
Discover this fully rented turn-key duplex, perfect for an investor to add to their portfolio. Each unit features two bedrooms and one full bath, providing comfortable and functional living spaces. Both units are equipped with separate furnaces and separate electric and gas meters, keeping utilities simple and efficient. Owner currently pays water, sewer, and trash. The property also includes a sump pump in the basement, adding peace of mind for long-term maintenance. Whether you're looking to expand your investment portfolio or reduce your monthly expenses by living in one unit, this well-maintained duplex is ready to go from day one!
-
2026-01-14price $77,000 643-char remark
Show marketing remark (643 chars)
Discover this fully rented turn-key duplex, perfect for an investor to add to their portfolio. Each unit features two bedrooms and one full bath, providing comfortable and functional living spaces. Both units are equipped with separate furnaces and separate electric and gas meters, keeping utilities simple and efficient. Owner currently pays water, sewer, and trash. The property also includes a sump pump in the basement, adding peace of mind for long-term maintenance. Whether you're looking to expand your investment portfolio or reduce your monthly expenses by living in one unit, this well-maintained duplex is ready to go from day one!
-
2025-12-03$83,900 Active 643-char remark
Show marketing remark (643 chars)
Discover this fully rented turn-key duplex, perfect for an investor to add to their portfolio. Each unit features two bedrooms and one full bath, providing comfortable and functional living spaces. Both units are equipped with separate furnaces and separate electric and gas meters, keeping utilities simple and efficient. Owner currently pays water, sewer, and trash. The property also includes a sump pump in the basement, adding peace of mind for long-term maintenance. Whether you're looking to expand your investment portfolio or reduce your monthly expenses by living in one unit, this well-maintained duplex is ready to go from day one!
-
2025-03-27soldstatus $38,000 Closed
-
2025-03-01status Pending
-
2025-02-12$45,000 Active
-
2022-03-03price $625
-
2018-08-22historical
-
2018-04-06$38,950
-
2017-03-16soldstatus $3,000
-
2016-08-30$12,800
ⓘ Source: listings_history table (triggers on properties + properties_extension) + one-shot
backfill from property_details.listing_events for pre-trigger history.
Tax reassessment forecast PA · Partial reset (capped growth)
- Current annual tax
- $782 · $65/mo
- Projected year-2 tax
- $928 · $77/mo
- Expected delta
- +$146/yr (+$12/mo · 18.7%)
ⓘ Screening estimate from a state-policy table — verify with the county assessor before closing.
Climate risk First Street
- Flood 1/10 Low FEMA zone X (unshaded) · 0% chance over 30 yrs
- Wildfire 1/10 Low
- Heat 3/10 Moderate 7 d/yr ≥97°F today · 17 d/yr by 30 yrs out
- Wind 1/10 Low
- Air quality 3/10 Moderate 2 unhealthy d/yr today · 6 by 30 yrs out
Nearby sold comps map
Loading sold comps map…
Walkable amenities ~0.75 mi
Loading nearby amenities…
Taxation est. · year 1
- Rental income
- $12,525
- − Mortgage interest
- −$3,809
- − Property taxes
- −$782
- − Insurance
- −$340
- − Repairs & maintenance
- −$1,002
- − Management
- −$1,002
- − Depreciation
- −$1,978
- Taxable income
- $3,612
- Est. tax owed @ 24.0%
- −$867
- After-tax cash flow
- $3,627/yr
For passive investors: Depreciation is non-cash, so a rental often shows a tax loss while cash-flowing — sheltering income. Rental losses are passive: they offset passive income freely, and up to $25,000/yr can offset ordinary (W-2) income if you actively participate and your MAGI is under $100k (phasing out to $0 by $150k); unused losses carry forward. On sale, claimed depreciation is recaptured at up to 25%, and gains may owe capital-gains tax (a 1031 exchange can defer both). Figures are a year-1 estimate at your 24.0% rate — not tax advice; consult a CPA.
Schools (NCES district)
- District
- Farrell Area SD
- NCES district ID
- 4209690
- Math proficiency
- 15% ▬ 0.00%
- Reading proficiency
- 28% ▼ -4.00%
- Median HH income
- $30,101
- Composite
- 17.21/100
- National rank
- #9102
- State rank
- #492 of 539 in PA
Livability — Farrell
- Score
- 52/100
- State rank
- #1684
- US rank
- #24840
Category grades
Schools grade is shown separately in the Schools card above.
Census & demographics
- Census place
- Farrell, PA
- City population
- 4,290
- Population (ZIP)
- 4,290
Population outlook (Mercer County) Hauer SSP2
- Today (2025)
- 108,341 people
- By 2030
- 104,269 · -3.8%
- By 2040
- 94,624 · -12.7%
- By 2050
- 84,891 · -21.6%
- By 2075
- 65,094 · -39.9%
- By 2100
- 47,657 · -56.0%
Race, ethnicity, and origin ACS 2023
- Neighborhood character
- Diverse neighborhood (Simpson 0.57)
- Race & ethnicity
- Black 49% White 43% Two or more races 7%
- Common ancestry
- Romanian 4% Scotch-Irish 2% Lithuanian 1%
- Foreign-born
- 1%
Political lean MEDSL · Mercer
- 2024 margin
- Solid R (+30.2) · D 34.5% · R 64.7%
- 2008→2024 swing
- -29.9pp toward R · 2008: -0.3pp · 2024: -30.2pp
- All cycles
- 2024: R+30.2 2020: R+26.0 2016: R+25.0 2012: R+2.5 2008: R+0.3
Not yet ingested
- Civics
- —
Market trends
- HPI YoY
- ▼ -3.05%
- Current HPI
- 155.4925
- Rent YoY
- —
- Metro
- —
- State GDP YoY
- ▲ 1.68%
- F500 in state
- 34
Industry mix (Fortune 500 HQ in PA)
| Industry | F500 HQs | Revenue |
|---|---|---|
| Healthcare | 2 | $309B |
|
||
| Insurance | 2 | $27B |
|
||
| Telecommunications / Media | 1 | $124B |
|
||
| Industrial Distribution | 1 | $22B |
|
||
| Financial Services | 1 | $20B |
|
||
| Chemicals / Materials | 1 | $18B |
|
||
Price history
+431.2% since first listed11 events — show timeline
- 2026-04-21 Price Changed $68,000 West Penn MLS
- 2026-01-14 Price Changed $77,000 West Penn MLS
- 2025-12-03 Listed $83,900 West Penn MLS
- 2025-03-27 Sold (MLS) $38,000 West Penn MLS
- 2025-03-01 Pending — West Penn MLS
- 2025-02-12 Listed $45,000 West Penn MLS
- 2022-03-03 Price Changed $625 RENT.
- 2018-08-22 Delisted — West Penn MLS
- 2018-04-06 Listed $38,950 West Penn MLS
- 2017-03-16 Sold (MLS) $3,000 West Penn MLS
- 2016-08-30 Listed $12,800 West Penn MLS
Property tax history
+2.0%/yrLatest (2025): $782 · +2.7% YoY. Source: county tax records.
Cash-flow waterfall
monthlySold comps — $/sqft
last 12 mo · ≤1 miLoading sold comps…