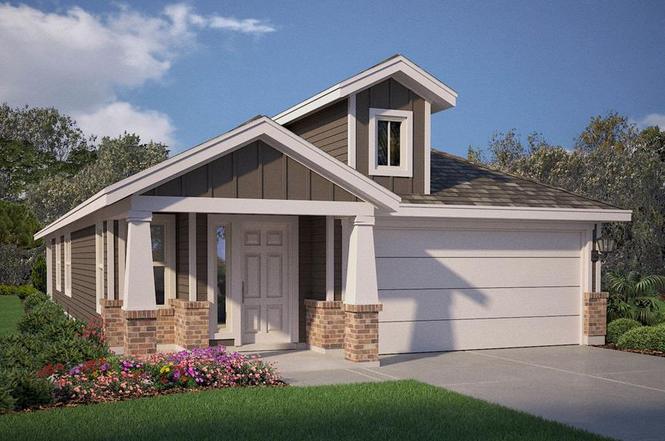
 🏗️ New Construction
3014 Dama Dama Rd · Odessa, TX
Flood risk 1/10 · Minimal
- FEMA flood zone
- X
- Chance of flooding over 30 yrs
- 0.0%
- Est. flood insurance / yr
- $507 – $1,088
Fire risk 5/10 · Moderate
- Est. fire insurance / yr
- $1,222 – $2,270
Heat risk 6/10 · Moderate
- Hot days now (above 101°F)
- 7 days/yr
- Hot days in 30 yrs
- 24 days/yr
Wind risk 3/10 · Minor
- Chance of severe wind over 30 yrs
- 5.0%
Air-quality risk 1/10 · Minimal
- Unhealthy air days now
- 0 days/yr
- Unhealthy air days in 30 yrs
- 0 days/yr
Risk factors via First Street. Map © Google.
Why this score? — see what drove the D+ grade
The composite is a weighted blend of 9 inputs, each scored 0–100. Each bar is that input's sub-score; the figure is the points it added to the 100-point composite (weight × sub-score).
- Cash flow +17.3/30.0
- ARV discount +7.5/15.0
- DSCR +5.4/10.0
- Condition / age +4.8/5.0
- 1% rule +4.7/10.0
- Livability +3.8/5.0
- Schools +3.2/10.0
- Rent growth +2.6/5.0
- Appreciation +0.0/10.0
$293,990
🖨 Deal sheet 📄 Offer letter ✓ Due diligence
Listing remarks
Beautiful new construction with granite and stainless appliances. Great location near shopping and restaurants. Photos and videos are for illustration purposes only. Features, colors, and options may vary in each community. Additional charges may apply for certain upgrades. Landscaping and furnishings not included.
Key facts
- New construction
- Stainless appliances
- Granite
Tags
Property features AI
Finance
- HOA & community: Homeowners association (HOA) present
Exterior
- Parking: Attached garage with 2 covered spaces (2 total parking spaces)
- Security: Smoke detector(s)
- Utilities: Public water; Public sewer; Propane
- Home design: Single-family residence; New construction / Under construction
- Construction: Composition roof; Slab foundation
- Exterior features: Wood fencing; Paved road access; Solar panels
Interior
- Kitchen: Microwave; Dishwasher; Garbage disposal
- Flooring: Carpet; Vinyl
- Bathrooms: 2 full bathrooms
- Heating & cooling: Central heating; Central electric air conditioning
- Interior features: Pantry; Breakfast bar; Smoke detectors; Tankless water heater
- Laundry & utility: Washer hookup
Neighborhood map
What this means for you Summary
Snapshot
- This is a 3-bed/2.0-bath single-family listed at $294k. Condition is rated excellent.
Deal economics
- At list price, monthly cash flow is $214 ($3k/yr) — positive.
- The deal already cash-flows at list — no discount required.
- To meet the 1% rule (rent ≥ 1% of price), the offer needs to be $284k (3.3% below list).
- Recommended offer: $284k (3.3% below list) — sets the bar for 1% rule.
Location & tenants
- Location reads 75/100 on livability (#132 in TX, #3,928 nationally) — a middle-class / working-renter tenant base. Strengths: cost of living A+, housing A+, health & safety A+; Watch: commute D+, amenities D.
- Midland ISD (urban): math 34% / reading 36% proficiency, ranked #477 of 826 in TX (top 58%) — families likely to look elsewhere, expect single-tenant / working-renter base with shorter leases.
- Zoned schools: Barbara Fasken El (math 45% / reading 43%, grade F, #1,243 of 4,322 statewide, top 29%, 886 students, 46% FRL); Alamo J H (math 23% / reading 32%, grade F, #1,156 of 1,662 statewide, top 71%, 865 students, 62% FRL); Legacy H S (math 37% / reading 3%, grade F, #1,397 of 1,632 statewide, top 87%, 2,504 students, 41% FRL) — zoned schools at 50% FRL track the district average.
- Market conditions: Rents flat; 431 active listings in the ZIP; 4 comparable units currently listed for rent nearby; rentals lingering (median 44d on market — plan ~5-8 weeks vacancy on turnover, expect pricing pressure); 50% of comp listings sitting > 30 days — soft ceiling on asking rent; solid renter incomes; 1,504 units permitted in Midland County in 2024 (0 in 5+ unit buildings).
- This rent runs 32% of the median local income ($105k/yr) — at the standard rent-burdened threshold; future hikes will face affordability resistance.
Forward outlook
- Local home prices are declining (-3.0%/yr); year-one equity from $2k of loan paydown is wiped out by about $9k of value loss. Plan a longer hold.
- Midland County population projected at +83% by 2050 — long-run rental-demand tailwind backs the buy-and-hold thesis.
Negotiation context
- Only 2 days on market — expect competitive offers; lowballing is unlikely to land.
Risks & watch-outs
- Climate carrying-cost: moderate wildfire risk; extreme-heat days projected 7→24/yr by 2055 (HVAC capex compounding) — expect insurance premiums to compound above CPI over the hold.
Questions for the listing agent
- Is there a deadline driving the sale (1031 exchange, divorce, estate, relocation)? That informs how much negotiation room exists.
- Schools are F-rated, which usually means shorter tenancies and higher turnover. Who's the typical renter profile here, and what's been the actual vacancy rate?
- The area grade is low — what's the realistic commute time and amenity access for the typical tenant pool here? Any planned neighborhood developments (good or bad) we should know about?
- What's the average days-on-market for RENTAL listings here right now (not sales)? A rising rental-DOM trend means longer vacancies and softer asking-rent achievability than the comps imply.
- What's the recent tenant-quality profile in this submarket — average credit score on applications, eviction rate, late-payment / NSF rate, and stable-employment percentage? A property-management company in the area should have these aggregated.
- How much new for-sale + rental construction is in the pipeline within 1–3 miles? Heavy new supply typically softens prices + rents 12–24 months out; constrained supply supports both.
Investment metrics
- 1% rule
- 0.97% ✗
- Cap rate
- 7.17%
- Cash-on-cash
- 3.12%
- DSCR
- 1.14
- GRM
- 8.6
CMA / ARV
No comps found within radius.
Projected returns pro-forma
-3.0% appreciation · 0.54% rent growth · sell at horizon
- IRR
- -14.2%
- Equity multiple
- 0.50×
- Total profit
- $-40,851
- Equity at exit
- $43,835
- IRR
- -10.0%
- Equity multiple
- 0.46×
- Total profit
- $-44,692
- Equity at exit
- $25,419
Cash invested: $82,317 (down + closing). Projections, not guarantees.
Landlord ↔ Tenant lean methodology
- Overall (STATE)
- 87 Strongly Landlord-Friendly
- State Texas
- 87 Strongly Landlord-Friendly · R+5
- County
- — inherits STATE
- City
- — inherits STATE
ZIP-level market 79765
- Home prices YoY
- -28.7%
- Rents YoY
- 0.5%
- Active inventory
- 431
- Price-to-rent
- 8.6×
Monthly cashflow live
- Estimated rent
- $2,842 medium interval (Pro) →
- Mortgage (P&I)
- −$1,542
- Tax est. 1.5%
- −$367 /mo · $4,410/yr
- Insurance
- −$122
- HOA
- −$0
- Vacancy / Maint / Mgmt
- −$597
- Net cashflow
- $214
Break-even live
UW: 25.0% down · 7.5% · 30yr · 1.5% tax · 5.0% vac · 8.0% maint · 8.0% mgmt
Financing live
Cash to close
- Down payment
- $73,498
- Closing costs
- $8,820
- Reserves months
- —
- Total cash needed
- —
Loan-product check · same deal, 3 products live
Conventional
25% down · 7.5% · 30yr
- Down + closing
- —
- Monthly P&I
- —
- Monthly cashflow
- —
- DSCR
- —
- Eligible?
- —
Personal DTI + credit; lowest rate.
DSCR
20% down · 8.5% · 30yr
- Down + closing
- —
- Monthly P&I
- —
- Monthly cashflow
- —
- DSCR
- —
- Eligible?
- —
No personal income docs; deal must DSCR.
Hard money
10% down · 12.0% · 12mo
- Down + closing
- —
- Monthly P&I
- —
- Monthly cashflow
- —
- DSCR
- —
- Eligible?
- —
Short-term bridge; refi at stabilization.
Rent comps 4 comps
| Address | Beds | Baths | Sqft | Rent | $/sqft | DOM | Units | Dist |
|---|---|---|---|---|---|---|---|---|
| 3611 El Cajon Ave Odessa, TX | 4.0 | 2.0 | 2038 | $3,800 | $1.86 | 43d | 1 | 0.78mi |
| 14 Devon Ct Odessa, TX | 3.0 | 2.0 | 1543 | $2,350 | $1.52 | 13d | 1 | 1.08mi |
| 8225 Dorado Dr Odessa, TX | 2.0 | 1.0–2.0 | 886 | $2,090 | $2.36 | 13d | 20 | 1.35mi |
| 33 Cibola Ct Odessa, TX | 3.0 | 2.0 | 1504 | $3,500 | $2.33 | 43d | 1 | 1.40mi |
Listing history 3 events
-
2026-06-19days on market $293,990 Active 2 DOM
-
2026-06-18remarks 316-char remark
-
2026-06-18$293,990 Active 1 DOM
ⓘ Source: listings_history table (triggers on properties + properties_extension) + one-shot
backfill from property_details.listing_events for pre-trigger history.
Climate risk First Street
- Flood 1/10 Low FEMA zone X · 0% chance over 30 yrs
- Wildfire 5/10 Major
- Heat 6/10 Major 7 d/yr ≥101°F today · 24 d/yr by 30 yrs out
- Wind 3/10 Moderate 5% chance of damaging wind over 30 yrs
- Air quality 1/10 Low 0 unhealthy d/yr today · 0 by 30 yrs out
Nearby sold comps map
Loading sold comps map…
Walkable amenities ~0.75 mi
Loading nearby amenities…
Taxation est. · year 1
- Rental income
- $34,108
- − Mortgage interest
- −$16,468
- − Property taxes
- −$4,410
- − Insurance
- −$1,470
- − Repairs & maintenance
- −$2,729
- − Management
- −$2,729
- − Depreciation
- −$8,552
- Taxable loss
- −$2,250
- Est. tax savings @ 24.0%
- +$540
- After-tax cash flow
- $3,105/yr
For passive investors: Depreciation is non-cash, so a rental often shows a tax loss while cash-flowing — sheltering income. Rental losses are passive: they offset passive income freely, and up to $25,000/yr can offset ordinary (W-2) income if you actively participate and your MAGI is under $100k (phasing out to $0 by $150k); unused losses carry forward. On sale, claimed depreciation is recaptured at up to 25%, and gains may owe capital-gains tax (a 1031 exchange can defer both). Figures are a year-1 estimate at your 24.0% rate — not tax advice; consult a CPA.
Condition & rehab AI · 2 photos
This new construction home is in excellent condition with a well-maintained exterior and interior. It offers a good investment opportunity with potential for value enhancement through painting and updates.
Value-add opportunities
- Both Painting the exterior and interior walls — Fresh paint can enhance the curb appeal and interior aesthetics.
- Both Landscaping improvements — Enhanced landscaping can improve curb appeal and attract potential buyers/tenants.
- Both Kitchen and bathroom updates — Upgrading these spaces can significantly increase the home's value and appeal to a broader market.
Renovation cost estimate screening
Value-add ROI direction
- Both Painting the exterior and interior walls — Fresh paint can enhance the curb appeal and interior aesthetics. ↑
- Both Landscaping improvements — Enhanced landscaping can improve curb appeal and attract potential buyers/tenants. ↑
- Both Kitchen and bathroom updates — Upgrading these spaces can significantly increase the home's value and appeal to a broader market. ↑
ⓘ Cost ranges are severity-bucket heuristics (US national rule-of-thumb). Get contractor quotes + a written scope before underwriting a rehab budget.
Schools (NCES district)
- District
- Midland ISD
- NCES district ID
- 4830570
- Math proficiency
- 34% ▼ -7.00%
- Reading proficiency
- 36% ▬ 0.00%
- Median HH income
- $63,457
- Composite
- 31.63/100
- National rank
- #5938
- State rank
- #477 of 826 in TX
Livability — Odessa
- Score
- 75/100
- State rank
- #132
- US rank
- #3928
Category grades
Schools grade is shown separately in the Schools card above.
Census & demographics
- Census place
- Odessa, TX
- County
- Ector County · 131,169 people
- City population
- 131,169
- Metro
- Odessa, TX
- Population (ZIP)
- 25,904
- Household income
- $104,965
- Rent vs Own
- Severe rent burden
- 884.0
Population outlook (Midland County) Hauer SSP2
- Today (2025)
- 220,895 people
- By 2030
- 253,667 · +14.8%
- By 2040
- 325,498 · +47.4%
- By 2050
- 404,168 · +83.0%
- By 2075
- 609,802 · +176.1%
- By 2100
- 760,172 · +244.1%
Race, ethnicity, and origin ACS 2023
- Neighborhood character
- Diverse neighborhood (Simpson 0.59)
- Race & ethnicity
- Hispanic / Latino 49% White 41% Two or more races 15% Black 5% Asian 3% Native American 1%
- Hispanic origin (detail)
- Mexican 45%
- Common ancestry
- Romanian 1% Slovak 1% Lithuanian 1%
- Foreign-born
- 10% · Canada, China, South Korea
- Languages at home
- 63% English-only · Spanish 31% German/W. Germanic 1% Tagalog/Filipino 1%
Political lean MEDSL · Midland
- 2024 margin
- Solid R (+60.5) · D 19.3% · R 79.8%
- 2008→2024 swing
- -3.3pp toward R · 2008: -57.3pp · 2024: -60.5pp
- All cycles
- 2024: R+60.5 2020: R+56.6 2016: R+55.2 2012: R+61.5 2008: R+57.3
Not yet ingested
- Civics
- —
Market trends
- HPI YoY
- ▼ -69.68%
- Current HPI
- 173.4252
- Rent YoY
- ▲ 0.54%
- Metro
- Odessa, TX
- State GDP YoY
- ▲ 3.95%
- F500 in state
- 110
Industry mix (Fortune 500 HQ in TX)
| Industry | F500 HQs | Revenue |
|---|---|---|
| Energy | 16 | $1,198B |
|
||
| Technology | 5 | $198B |
|
||
| Engineering / Construction | 4 | $72B |
|
||
| Energy Services | 3 | $60B |
|
||
| Utilities | 3 | $41B |
|
||
| Healthcare | 2 | $330B |
|
||
Price history
1 event — show timeline
- 2026-06-17 Listed $293,990 ODMLS
Cash-flow waterfall
monthlySold comps — $/sqft
last 12 mo · ≤1 miLoading sold comps…