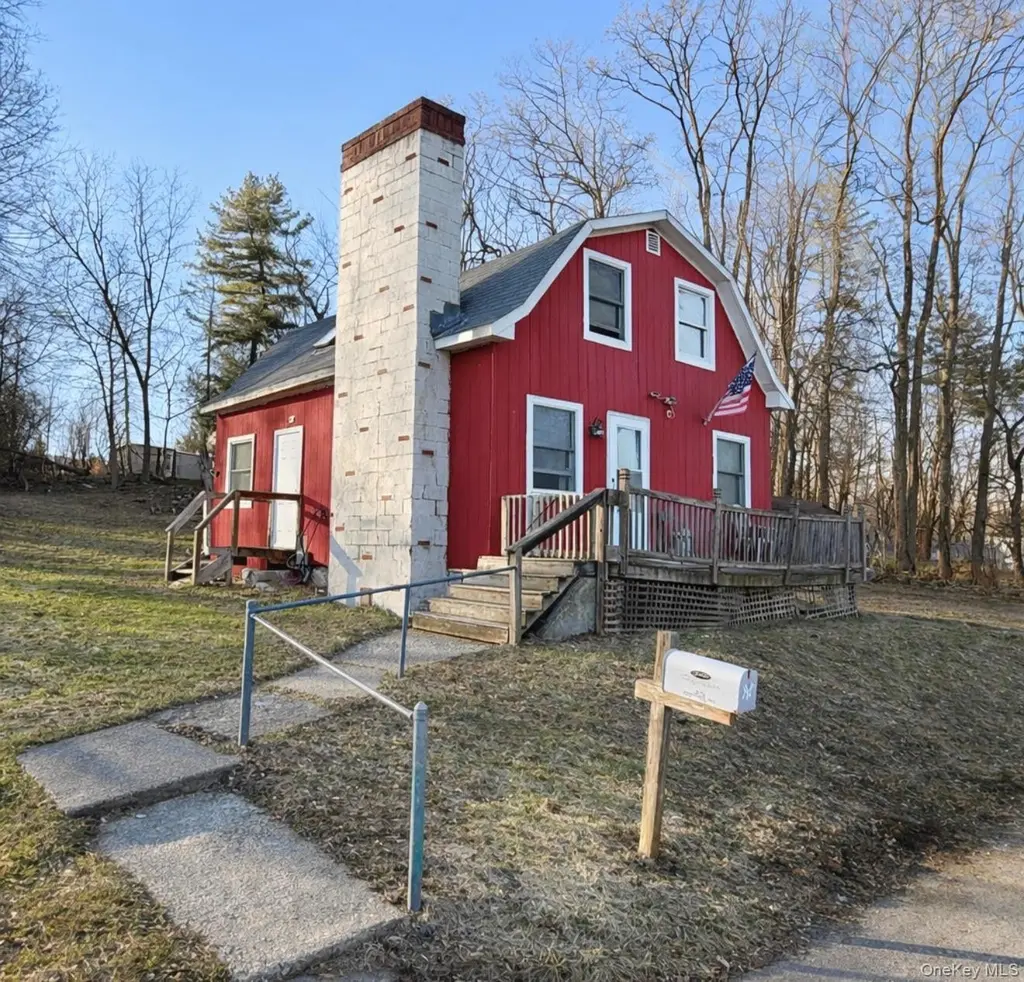
25 Pierpont Ave · Gardnertown, NY
Flood risk 1/10 · Minimal
- FEMA flood zone
- X (unshaded)
- Chance of flooding over 30 yrs
- 0.0%
- Est. flood insurance / yr
- $473 – $860
Fire risk 3/10 · Minor
- Est. fire insurance / yr
- $691 – $1,283
Heat risk 5/10 · Moderate
- Hot days now (above 100°F)
- 7 days/yr
- Hot days in 30 yrs
- 15 days/yr
Wind risk 4/10 · Minor
- Chance of severe wind over 30 yrs
- 14.0%
Air-quality risk 3/10 · Minor
- Unhealthy air days now
- 2 days/yr
- Unhealthy air days in 30 yrs
- 3 days/yr
Risk factors via First Street. Map © Google.
Why this score? — see what drove the B- grade
The composite is a weighted blend of 9 inputs, each scored 0–100. Each bar is that input's sub-score; the figure is the points it added to the 100-point composite (weight × sub-score).
- Cash flow +26.0/30.0
- ARV discount +15.0/15.0
- DSCR +8.8/10.0
- 1% rule +6.2/10.0
- Schools +3.5/10.0
- Livability +3.4/5.0
- Rent growth +2.7/5.0
- Condition / age +2.5/5.0
- Appreciation +0.0/10.0
$230,000
🖨 Deal sheet 📄 Offer letter ✓ Due diligence
Listing remarks MLS
Welcome to 25 N Pierpont Ave - a home full of character, charm, and opportunity. Set on a rare double lot, this property offers exceptional outdoor space with room for expansion, gardening, or the creation of your ideal backyard setup. Located in a convenient central location close to shops, restaurants, and everyday amenities, the setting combines space with accessibility. Inside, the home features a classic layout with timeless details throughout. While the property is in need of updates, it presents a strong opportunity for buyers to bring their vision to life and build equity. Customize a home to your taste. This is a value-driven opportunity with significant upside.
Key facts
- Outdoor entertaining
- Central location
- Space for gardening
Tags
Neighborhood map
What this means for you Summary
Snapshot
- This is a 3-bed/1.0-bath single-family listed at $230k.
Deal economics
- At list price, monthly cash flow is $576 ($7k/yr) — positive.
- The deal already cash-flows at list — no discount required.
- Meets the 1% rule at list price ($3k rent vs $230k).
- Recommended offer: $209k (9.0% below list) — sets the bar for market timing.
- Cap rate 9.3% vs local median 3.4% in Gardnertown — top-decile yield for the area; either an underpriced asset or a hidden risk that comps aren't pricing in. Stress-test before assuming the spread holds.
Location & tenants
- Location reads 68/100 on livability (#522 in NY) — a middle-class / working-renter tenant base. Strengths: employment A+, housing A+, health & safety A; Watch: cost of living D, schools D-, amenities F.
- Newburgh City School District (suburban): math 33% / reading 48% proficiency, ranked #500 of 590 in NY (top 85%) — families likely to look elsewhere, expect single-tenant / working-renter base with shorter leases; 61% free/reduced lunch — lower-income household profile, screen leases tightly.
- Market conditions: Rents flat; 383 active listings in the ZIP; 6 comparable units currently listed for rent nearby; rentals at typical pace (median 24d on market — plan ~3-4 weeks tenant-placement turnaround); solid renter incomes; 1,746 units permitted in Orange County in 2024 (1,265 in 5+ unit buildings).
- This rent runs 36% of the median local income ($86k/yr) — at the standard rent-burdened threshold; future hikes will face affordability resistance.
Forward outlook
- Local home prices are declining (-3.0%/yr); year-one equity from $2k of loan paydown is wiped out by about $7k of value loss. Plan a longer hold.
Negotiation context
- It's been on market 98 days — a 9% lower offer ($209k) is reasonable based on typical stale-listing flexibility.
- Current owner paid $60k; list at $230k implies a 283% gain — meaningful room to come down on a strong offer.
Risks & watch-outs
- Watch-outs: built in 1910 — expect roof / HVAC / electrical / plumbing capex.
- Climate carrying-cost: extreme-heat days projected 7→15/yr by 2055 (HVAC capex compounding) — expect insurance premiums to compound above CPI over the hold.
Questions for the listing agent
- It's been on market 98 days. Have you received any prior offers? Is the seller open to a 9% concession, seller financing, or rate buy-down credit?
- Built in 1910 — when were the roof, HVAC, electrical panel, plumbing, and water heater last replaced?
- Why hasn't it sold? Are there any deal-killer items the seller is aware of (foundation, flood, title, zoning, code violations)?
- Is there a deadline driving the sale (1031 exchange, divorce, estate, relocation)? That informs how much negotiation room exists.
- Schools are D-rated, which usually means shorter tenancies and higher turnover. Who's the typical renter profile here, and what's been the actual vacancy rate?
- What's the average days-on-market for RENTAL listings here right now (not sales)? A rising rental-DOM trend means longer vacancies and softer asking-rent achievability than the comps imply.
- What's the recent tenant-quality profile in this submarket — average credit score on applications, eviction rate, late-payment / NSF rate, and stable-employment percentage? A property-management company in the area should have these aggregated.
- How much new for-sale + rental construction is in the pipeline within 1–3 miles? Heavy new supply typically softens prices + rents 12–24 months out; constrained supply supports both.
Investment metrics
- 1% rule
- 1.12% ✓
- Cap rate
- 9.30%
- Cash-on-cash
- 10.73%
- DSCR
- 1.48
- GRM
- 7.5
CMA / ARV
- ARV (median comp)
- $419,817
- List price
- $230,000
- Delta
- -45.21%
- Verdict
- UNDERPRICED
- Comps
- 20 within 1.0 mi
Show comp detail 12 sales within ~0.75 mi
| Address | Dist | Beds/Ba | Sqft | Sold | Price | $/sf | Match |
|---|---|---|---|---|---|---|---|
| 17 Brookside Ave | 0.37mi | 3/2.0 | 1,460 (+4%) | 2mo | $440,000 | $301 | 71 |
| 65 Poplar St | 0.57mi | 3/2.5 | 1,416 (+1%) | 10mo | $300,000 | $212 | 58 |
| 62 Poplar St | 0.55mi | 3/1.5 | 1,272 (-10%) | 2mo | $385,000 | $303 | 54 |
| 145 Wisner Ave | 0.52mi | 3/1.5 | 1,333 (-5%) | 14mo | $350,000 | $263 | 53 |
| 14 Cathy Dr | 0.48mi | 4/2.0 (+1) | 1,312 (-7%) | 7mo | $345,450 | $263 | 51 |
| 63 Poplar St | 0.58mi | 3/1.0 | 1,232 (-12%) | 2mo | $260,000 | $211 | 51 |
| 149 Wisner Ave | 0.51mi | 3/1.0 | 1,253 (-11%) | 10mo | $310,000 | $247 | 49 |
| 42 Maple St | 0.64mi | 3/1.0 | 1,322 (-6%) | 13mo | $345,000 | $261 | 49 |
| 13 Poplar St | 0.62mi | 4/2.0 (+1) | 1,296 (-8%) | 0mo | $350,000 | $270 | 48 |
| 76 Poplar St | 0.55mi | 3/1.0 | 1,250 (-11%) | 17mo | $189,000 | $151 | 42 |
| 18 Edgewood Ter | 0.59mi | 3/1.0 | 1,205 (-14%) | 16mo | $250,000 | $207 | 35 |
| 103 Plank | 0.74mi | 3/1.0 | 1,220 (-13%) | 12mo | $387,000 | $317 | 33 |
Match score weights: distance 35% · size 25% · config 20% · recency 20%. Top-matched comps best support the ARV.
Projected returns pro-forma
-3.0% appreciation · 0.63% rent growth · sell at horizon
- IRR
- -2.8%
- Equity multiple
- 0.90×
- Total profit
- $-6,634
- Equity at exit
- $34,294
- IRR
- 4.2%
- Equity multiple
- 1.28×
- Total profit
- $17,833
- Equity at exit
- $19,886
Cash invested: $64,400 (down + closing). Projections, not guarantees.
Landlord ↔ Tenant lean methodology
- Overall (STATE)
- 15 Strongly Tenant-Friendly
- State New York
- 15 Strongly Tenant-Friendly · D+10
- County
- — inherits STATE
- City
- — inherits STATE
ZIP-level market 12550
- Home prices YoY
- -33.3%
- Rents YoY
- 0.6%
- Active inventory
- 383
- Price-to-rent
- 7.5×
Monthly cashflow live
- Estimated rent
- $2,570 high interval (Pro) →
- Mortgage (P&I)
- −$1,206
- Tax from tax record
- −$152 /mo · $1,830/yr
- Insurance
- −$96
- HOA
- −$0
- Vacancy / Maint / Mgmt
- −$540
- Net cashflow
- $576
Break-even live
UW: 25.0% down · 7.5% · 30yr · 1.5% tax · 5.0% vac · 8.0% maint · 8.0% mgmt
Financing live
Cash to close
- Down payment
- $57,500
- Closing costs
- $6,900
- Reserves months
- —
- Total cash needed
- —
Loan-product check · same deal, 3 products live
Conventional
25% down · 7.5% · 30yr
- Down + closing
- —
- Monthly P&I
- —
- Monthly cashflow
- —
- DSCR
- —
- Eligible?
- —
Personal DTI + credit; lowest rate.
DSCR
20% down · 8.5% · 30yr
- Down + closing
- —
- Monthly P&I
- —
- Monthly cashflow
- —
- DSCR
- —
- Eligible?
- —
No personal income docs; deal must DSCR.
Hard money
10% down · 12.0% · 12mo
- Down + closing
- —
- Monthly P&I
- —
- Monthly cashflow
- —
- DSCR
- —
- Eligible?
- —
Short-term bridge; refi at stabilization.
Rent comps 6 comps
| Address | Beds | Baths | Sqft | Rent | $/sqft | DOM | Units | Dist |
|---|---|---|---|---|---|---|---|---|
| 62 Poplar St Newburgh, NY | 3.0 | 1.5 | 1272 | $3,000 | $2.36 | 23d | 1 | 0.58mi |
| 20 Pierces Rd Unit 3 Newburgh, NY | 2.0 | 1.5 | 1071 | $1,900 | $1.77 | 23d | 1 | 0.81mi |
| 61 Stewart Ave Newburgh, NY | 2.0 | 1.0 | 975 | $2,295 | $2.35 | 44d | 1 | 0.86mi |
| 171 West St Newburgh, NY | 3.0 | 1.5 | 1299 | $2,800 | $2.16 | 23d | 1 | 0.89mi |
| 9 Arlington Pl Newburgh, NY | 3.0 | 1.0 | 950 | $2,300 | $2.42 | 14d | 1 | 1.03mi |
| 457 1st St Newburgh, NY | 3.0 | 1.0 | 1680 | $2,950 | $1.76 | 44d | 1 | 1.15mi |
Listing history 20 events
-
2026-06-17status $230,000 Pending 98 DOM
-
2026-06-17days on market $230,000 Active 98 DOM
-
2026-06-16days on market $230,000 Active 97 DOM
-
2026-06-15days on market $230,000 Active 96 DOM
-
2026-06-14days on market $230,000 Active 94 DOM
-
2026-06-13days on market $230,000 Active 93 DOM
-
2026-06-10days on market $230,000 Active 91 DOM
-
2026-06-09days on market $230,000 Active 90 DOM
-
2026-06-08days on market $230,000 Active 89 DOM
-
2026-06-07days on market $230,000 Active 88 DOM
-
2026-06-03days on market $230,000 Active 84 DOM
-
2026-06-02days on market $230,000 Active 83 DOM
-
2026-06-01days on market $230,000 Active 82 DOM
-
2026-05-31days on market $230,000 Active 81 DOM
-
2026-05-30days on market $230,000 Active 80 DOM
-
2026-05-19price $230,000 682-char remark
Show marketing remark (682 chars)
Welcome to 25 N Pierpont Ave - a home full of character, charm, and opportunity. Set on a rare double lot, this property offers exceptional outdoor space with room for expansion, gardening, or the creation of your ideal backyard setup. Located in a convenient central location close to shops, restaurants, and everyday amenities, the setting combines space with accessibility. Inside, the home features a classic layout with timeless details throughout. While the property is in need of updates, it presents a strong opportunity for buyers to bring their vision to life and build equity. Customize a home to your taste. This is a value-driven opportunity with significant upside.
-
2026-04-24price $249,900 682-char remark
Show marketing remark (682 chars)
Welcome to 25 N Pierpont Ave - a home full of character, charm, and opportunity. Set on a rare double lot, this property offers exceptional outdoor space with room for expansion, gardening, or the creation of your ideal backyard setup. Located in a convenient central location close to shops, restaurants, and everyday amenities, the setting combines space with accessibility. Inside, the home features a classic layout with timeless details throughout. While the property is in need of updates, it presents a strong opportunity for buyers to bring their vision to life and build equity. Customize a home to your taste. This is a value-driven opportunity with significant upside.
-
2026-04-03price $289,999 682-char remark
Show marketing remark (682 chars)
Welcome to 25 N Pierpont Ave - a home full of character, charm, and opportunity. Set on a rare double lot, this property offers exceptional outdoor space with room for expansion, gardening, or the creation of your ideal backyard setup. Located in a convenient central location close to shops, restaurants, and everyday amenities, the setting combines space with accessibility. Inside, the home features a classic layout with timeless details throughout. While the property is in need of updates, it presents a strong opportunity for buyers to bring their vision to life and build equity. Customize a home to your taste. This is a value-driven opportunity with significant upside.
-
2026-03-10$299,999 Active 682-char remark
Show marketing remark (682 chars)
Welcome to 25 N Pierpont Ave - a home full of character, charm, and opportunity. Set on a rare double lot, this property offers exceptional outdoor space with room for expansion, gardening, or the creation of your ideal backyard setup. Located in a convenient central location close to shops, restaurants, and everyday amenities, the setting combines space with accessibility. Inside, the home features a classic layout with timeless details throughout. While the property is in need of updates, it presents a strong opportunity for buyers to bring their vision to life and build equity. Customize a home to your taste. This is a value-driven opportunity with significant upside.
-
2020-01-31soldstatus $60,000
ⓘ Source: listings_history table (triggers on properties + properties_extension) + one-shot
backfill from property_details.listing_events for pre-trigger history.
Tax reassessment forecast NY · Partial reset (capped growth)
- Current annual tax
- $1,830 · $152/mo
- Projected year-2 tax
- $2,858 · $238/mo
- Expected delta
- +$1,029/yr (+$86/mo · 56.2%)
ⓘ Screening estimate from a state-policy table — verify with the county assessor before closing.
Climate risk First Street
- Flood 1/10 Low FEMA zone X (unshaded) · 0% chance over 30 yrs
- Wildfire 3/10 Moderate
- Heat 5/10 Major 7 d/yr ≥100°F today · 15 d/yr by 30 yrs out
- Wind 4/10 Moderate 14% chance of damaging wind over 30 yrs
- Air quality 3/10 Moderate 2 unhealthy d/yr today · 3 by 30 yrs out
Nearby sold comps map
Loading sold comps map…
Walkable amenities ~0.75 mi
Loading nearby amenities…
Taxation est. · year 1
- Rental income
- $30,838
- − Mortgage interest
- −$12,884
- − Property taxes
- −$1,830
- − Insurance
- −$1,150
- − Repairs & maintenance
- −$2,467
- − Management
- −$2,467
- − Depreciation
- −$6,691
- Taxable income
- $3,350
- Est. tax owed @ 24.0%
- −$804
- After-tax cash flow
- $6,105/yr
For passive investors: Depreciation is non-cash, so a rental often shows a tax loss while cash-flowing — sheltering income. Rental losses are passive: they offset passive income freely, and up to $25,000/yr can offset ordinary (W-2) income if you actively participate and your MAGI is under $100k (phasing out to $0 by $150k); unused losses carry forward. On sale, claimed depreciation is recaptured at up to 25%, and gains may owe capital-gains tax (a 1031 exchange can defer both). Figures are a year-1 estimate at your 24.0% rate — not tax advice; consult a CPA.
Schools (NCES district)
- District
- Newburgh City School District
- NCES district ID
- 3620700
- Math proficiency
- 33% ▼ -8.00%
- Reading proficiency
- 48% ▲ 10.00%
- Median HH income
- $56,387
- Composite
- 35.46/100
- National rank
- #4927
- State rank
- #500 of 590 in NY
Livability — Gardnertown
- Score
- 68/100
- State rank
- #522
- US rank
- #9236
Category grades
Schools grade is shown separately in the Schools card above.
Census & demographics
- Census place
- Gardnertown, NY
- County
- Orange County · 267,004 people
- City population
- 54,996
- Metro
- Poughkeepsie-Newburgh-Middletown, NY
- Population (ZIP)
- 55,152
- Household income
- $85,697
- Rent vs Own
- Severe rent burden
- 2412.0
Population outlook (Orange County) Hauer SSP2
- Today (2025)
- 379,830 people
- By 2030
- 378,955 · -0.2%
- By 2040
- 375,444 · -1.2%
- By 2050
- 369,311 · -2.8%
- By 2075
- 354,233 · -6.7%
- By 2100
- 318,150 · -16.2%
Race, ethnicity, and origin ACS 2023
- Neighborhood character
- Diverse neighborhood (Simpson 0.68)
- Race & ethnicity
- Hispanic / Latino 39% White 36% Black 20% Two or more races 12% Asian 2%
- Hispanic origin (detail)
- Mexican 14% Puerto Rican 10% Dominican 2%
- Common ancestry
- Romanian 2% Hispanic 1% Lithuanian 1%
- Foreign-born
- 18% · Canada, Dominican Republic
- Languages at home
- 64% English-only · Spanish 30% French/Haitian/Cajun 1% Other Indo-European 1%
Political lean MEDSL · Orange
- 2024 margin
- Lean R (+8.4) · D 45.8% · R 54.2%
- 2008→2024 swing
- -12.5pp toward R · 2008: 4.1pp · 2024: -8.4pp
- All cycles
- 2024: R+8.4 2020: R+0.2 2016: R+6.5 2012: D+5.2 2008: D+4.1
Not yet ingested
- Civics
- —
Market trends
- HPI YoY
- ▼ -151.93%
- Current HPI
- 304.1046
- Rent YoY
- ▲ 0.63%
- Metro
- Poughkeepsie-Newburgh-Middletown, NY
- State GDP YoY
- ▲ 2.60%
- F500 in state
- 92
Industry mix (Fortune 500 HQ in NY)
| Industry | F500 HQs | Revenue |
|---|---|---|
| Financial Services | 10 | $950B |
|
||
| Consumer Goods | 9 | $162B |
|
||
| Insurance | 4 | $225B |
|
||
| Telecommunications | 2 | $144B |
|
||
| Pharmaceuticals | 2 | $112B |
|
||
| Media / Entertainment | 2 | $69B |
|
||
Price history
+283.3% since first listed5 events — show timeline
- 2026-05-19 Price Changed $230,000 OneKey® MLS as Distributed by MLS Grid
- 2026-04-24 Price Changed $249,900 OneKey® MLS as Distributed by MLS Grid
- 2026-04-03 Price Changed $289,999 OneKey® MLS as Distributed by MLS Grid
- 2026-03-10 Listed $299,999 OneKey® MLS as Distributed by MLS Grid
- 2020-01-31 Sold (Public Records) $60,000 Public Records
Property tax history
+16.4%/yrLatest (2025): $1,830 · +3.9% YoY. Source: county tax records.
Cash-flow waterfall
monthlySold comps — $/sqft
last 12 mo · ≤1 miLoading sold comps…