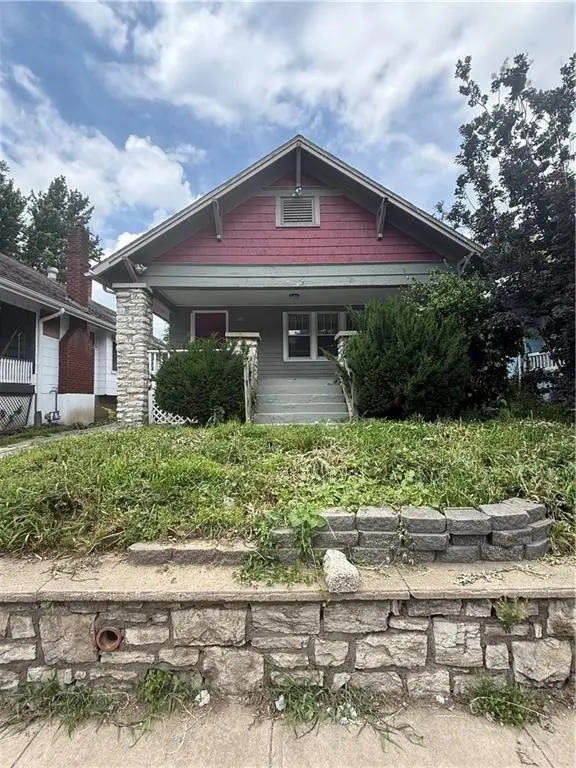
1220 S Ash Ave · Independence, MO
Flood risk 1/10 · Minimal
- FEMA flood zone
- X (unshaded)
- Chance of flooding over 30 yrs
- 0.0%
- Est. flood insurance / yr
- $473 – $860
Fire risk 1/10 · Minimal
- Est. fire insurance / yr
- $1,054 – $1,958
Heat risk 4/10 · Minor
- Hot days now (above 106°F)
- 7 days/yr
- Hot days in 30 yrs
- 17 days/yr
Wind risk 2/10 · Minimal
- Chance of severe wind over 30 yrs
- —
Air-quality risk 3/10 · Minor
- Unhealthy air days now
- 2 days/yr
- Unhealthy air days in 30 yrs
- 3 days/yr
Risk factors via First Street. Map © Google.
Why this score? — see what drove the D+ grade
The composite is a weighted blend of 9 inputs, each scored 0–100. Each bar is that input's sub-score; the figure is the points it added to the 100-point composite (weight × sub-score).
- ARV discount +15.0/15.0
- Cash flow +14.4/30.0
- DSCR +4.4/10.0
- Livability +4.1/5.0
- Rent growth +3.9/5.0
- 1% rule +3.1/10.0
- Schools +2.7/10.0
- Condition / age +2.5/5.0
- Appreciation +0.0/10.0
$130,000
🖨 Deal sheet (PDF) 📄 Offer letter ✓ Due diligence
Listing remarks MLS
Welcome to this charming home with great bones! This home has a solid foundation, the roof is in great condition, and endless potential! Inside, maintained original hardwood floors through out the home and spacious bedrooms, large open living and dining areas, spacious kitchen. The basement, complete with a kitchenette, full bathroom, and two extra non conforming bedrooms, offers another living space that can be closed off. This home is a blank canvas for your imagination. Located in a well established, centralized neighborhood close to schools, parks, and downtown Kansas City, this home is ready for you to make it your own.
Key facts
- Kitchenette
- Finished basement
- Recreation space
Tags
Property features AI
Finance
- HOA & community: Association fee paid annually
Exterior
- Parking: Off-street parking; Other parking
- Utilities: Public water; Public sewer
- Home design: Single-family residential; Ranch floor plan; 101+ years old
- Construction: Concrete and wood siding construction; Composition roof
- Exterior features: Not in a flood plain
Interior
- Kitchen: No kitchen appliance details provided
- Bedrooms: 2 bedrooms
- Flooring: Tile flooring; Wood flooring
- Bathrooms: 2 full bathrooms
- Heating & cooling: Natural gas heating; Electric cooling
- Interior features: Fireplace (1); Basement bedroom; Full finished basement; Sump pump
- Laundry & utility: Laundry located off the kitchen
Neighborhood map
What this means for you Summary
Snapshot
- This is a 2-bed/1.5-bath single-family listed at $130k.
Deal economics
- At list price, monthly cash flow is $25 ($303/yr) — positive.
- The deal already cash-flows at list — no discount required.
- To meet the 1% rule (rent ≥ 1% of price), the offer needs to be $105k (19.0% below list).
- Recommended offer: $105k (19.0% below list) — sets the bar for 1% rule.
- Cap rate 6.5% vs local median 5.0% in Independence — meaningfully above typical; check what's discounted (condition, days-on-market, listing class) to confirm the premium yield is real.
Location & tenants
- Location reads 82/100 on livability (#10 in MO, #1,296 nationally) — a professional / high-income tenant draw. Strengths: amenities A+, commute A+, cost of living A+; Watch: employment D+, crime F.
- Independence 30 (suburban): math 26% / reading 38% proficiency, ranked #252 of 324 in MO (top 78%) — families likely to look elsewhere, expect single-tenant / working-renter base with shorter leases.
- Zoned schools: Sugar Creek Elem. (140 students, 83% FRL); Clifford H. Nowlin Middle (math 13% / reading 29%, grade F, #342 of 391 statewide, top 88%, 875 students, 80% FRL); Van Horn High (math 13% / reading 27%, grade F, #472 of 521 statewide, top 91%, 1,047 students, 72% FRL) — zoned schools average 78% FRL vs 58% district-wide (20 pts higher); higher-poverty schools than district average — tighter screening recommended.
- Market conditions: Rents rising fast (+5.4%/yr); 135 active listings in the ZIP; 26 comparable units currently listed for rent nearby; rentals at typical pace (median 26d on market — plan ~3-4 weeks tenant-placement turnaround); 4,002 units permitted in Jackson County in 2024 (2,271 in 5+ unit buildings).
Forward outlook
- Local home prices are declining (-3.0%/yr); year-one equity from $899 of loan paydown is wiped out by about $4k of value loss. Plan a longer hold.
- Jackson County population projected at +4% by 2050 — modest demand growth; plan on rents tracking national, not racing it.
Negotiation context
- Only 13 days on market — expect competitive offers; lowballing is unlikely to land.
- 5 sale attempts since 2y ago with the ask held roughly flat each time — persistent listings suggest the price (not the market) is what's stuck; bring a comps-based counter.
Risks & watch-outs
- Watch-outs: built in 1922 — expect roof / HVAC / electrical / plumbing capex.
Questions for the listing agent
- Built in 1922 — when were the roof, HVAC, electrical panel, plumbing, and water heater last replaced?
- Is there a deadline driving the sale (1031 exchange, divorce, estate, relocation)? That informs how much negotiation room exists.
- Crime grade is F in this area — have there been break-ins, vandalism, or insurance claims at this property in the last 3 years? What carrier currently insures it and at what premium?
- The area grade is low — what's the realistic commute time and amenity access for the typical tenant pool here? Any planned neighborhood developments (good or bad) we should know about?
- What's the average days-on-market for RENTAL listings here right now (not sales)? A rising rental-DOM trend means longer vacancies and softer asking-rent achievability than the comps imply.
- What's the recent tenant-quality profile in this submarket — average credit score on applications, eviction rate, late-payment / NSF rate, and stable-employment percentage? A property-management company in the area should have these aggregated.
- How much new for-sale + rental construction is in the pipeline within 1–3 miles? Heavy new supply typically softens prices + rents 12–24 months out; constrained supply supports both.
Investment metrics
- 1% rule
- 0.81% ✗
- Cap rate
- 6.53%
- Cash-on-cash
- 0.83%
- DSCR
- 1.04
- GRM
- 10.3
CMA / ARV
- ARV (on-the-fly)
- $169,035
- Comps found
- 12
Show comp detail 12 sales within ~0.75 mi
| Address | Dist | Beds/Ba | Sqft | Sold | Price | $/sf | Match |
|---|---|---|---|---|---|---|---|
| 10515 E Lake Dr | 0.28mi | 3/1.0 (+1) | 913 (-4%) | 1mo | $165,000 | $181 | 72 |
| 809 S Carlisle Ave | 0.54mi | 2/1.0 | 950 (-0%) | 2mo | $180,000 | $189 | 70 |
| 1514 S Cedar Ave | 0.27mi | 2/2.0 | 883 (-8%) | 3mo | $145,000 | $164 | 70 |
| 826 S Arlington Ave | 0.56mi | 2/1.5 | 968 (+1%) | 3mo | $175,000 | $181 | 69 |
| 1731 S Crescent Ave | 0.63mi | 2/1.0 | 944 (-1%) | 4mo | $120,000 | $127 | 63 |
| 1815 S Ralston Ave | 0.53mi | 2/1.0 | 912 (-4%) | 3mo | $165,000 | $181 | 63 |
| 1600 S Ralston Ave | 0.35mi | 3/1.0 (+1) | 1,025 (+7%) | 2mo | $150,000 | $146 | 62 |
| 823 S Huttig Ave | 0.33mi | 3/2.0 (+1) | 1,052 (+10%) | 2mo | $76,000 | $72 | 59 |
| 566 S Overton Ave | 0.73mi | 2/1.0 | 940 (-2%) | 3mo | $90,000 | $96 | 58 |
| 1523 Harvard Ave | 0.58mi | 3/1.0 (+1) | 884 (-7%) | 4mo | $155,000 | $175 | 50 |
| 556 S Carlisle Dr | 0.73mi | 2/2.0 | 874 (-8%) | 0mo | $155,000 | $177 | 50 |
| 1529 S Harvard Ave | 0.59mi | 3/1.0 (+1) | 852 (-11%) | 2mo | $156,000 | $183 | 45 |
Match score weights: distance 35% · size 25% · config 20% · recency 20%. Top-matched comps best support the ARV.
Projected returns pro-forma
-3.0% appreciation · 5.43% rent growth · sell at horizon
- IRR
- -12.6%
- Equity multiple
- 0.54×
- Total profit
- $-16,864
- Equity at exit
- $19,383
- IRR
- -0.5%
- Equity multiple
- 0.96×
- Total profit
- $-1,413
- Equity at exit
- $11,240
Cash invested: $36,400 (down + closing). Projections, not guarantees.
Landlord ↔ Tenant lean methodology
- Overall (STATE)
- 81 Strongly Landlord-Friendly
- State Missouri
- 81 Strongly Landlord-Friendly · R+10
- County
- — inherits STATE
- City
- — inherits STATE
ZIP-level market 64052
- Home prices YoY
- -34.6%
- Rents YoY
- 5.4%
- Active inventory
- 135
- Price-to-rent
- 10.3×
Monthly cashflow live
- Estimated rent
- $1,053 high interval (Pro) →
- Mortgage (P&I)
- −$682
- Tax from tax record
- −$70 /mo · $845/yr
- Insurance
- −$54
- HOA
- −$0
- Vacancy / Maint / Mgmt
- −$221
- Net cashflow
- $25
Break-even live
Sensitivity live
| Price | -10% $99 | -5% $62 | +0% $25 | +5% $-12 | +10% $-48 |
|---|---|---|---|---|---|
| Rent | -10% $-58 | -5% $-16 | +0% $25 | +5% $67 | +10% $108 |
| Rate | -1.0pp $91 | -0.5pp $58 | base $25 | +0.5pp $-8 | +1.0pp $-43 |
UW: 25.0% down · 7.5% · 30yr · 1.5% tax · 5.0% vac · 8.0% maint · 8.0% mgmt
Financing live
Cash to close
- Down payment
- $32,500
- Closing costs
- $3,900
- Reserves months
- —
- Total cash needed
- —
Loan-product check · same deal, 3 products live
Conventional
25% down · 7.5% · 30yr
- Down + closing
- —
- Monthly P&I
- —
- Monthly cashflow
- —
- DSCR
- —
- Eligible?
- —
Personal DTI + credit; lowest rate.
DSCR
20% down · 8.5% · 30yr
- Down + closing
- —
- Monthly P&I
- —
- Monthly cashflow
- —
- DSCR
- —
- Eligible?
- —
No personal income docs; deal must DSCR.
Hard money
10% down · 12.0% · 12mo
- Down + closing
- —
- Monthly P&I
- —
- Monthly cashflow
- —
- DSCR
- —
- Eligible?
- —
Short-term bridge; refi at stabilization.
Rent comps 26 comps
| Address | Beds | Baths | Sqft | Rent | $/sqft | DOM | Units | Dist |
|---|---|---|---|---|---|---|---|---|
| 10522 E 10th St S Independence, MO | 2.0 | 1.0 | 1020 | $1,099 | $1.08 | 25d | 1 | 0.26mi |
| 10561 E Lake Dr Independence, MO | 2.0 | 1.0 | 800 | $1,000 | $1.25 | 45d | 1 | 0.31mi |
| 10119 E Winner Rd Unit 2 Independence, MO | 1.0 | 1.0 | 1000 | $1,045 | $1.04 | 23d | 1 | 0.32mi |
| 1712 S Ash Ave Independence, MO | 2.0 | 1.0 | 800 | $945 | $1.18 | 45d | 1 | 0.36mi |
| 1712 S Ash Ave Unit 1718-1 Independence, MO | 1.0 | 1.0 | 550 | $775 | $1.41 | 25d | 1 | 0.36mi |
| 1712 S Ash Ave Unit 1714-3 Independence, MO | 2.0 | 1.0 | 700 | $895 | $1.28 | 25d | 1 | 0.36mi |
| 9528 E Winner Rd Independence, MO | 1.0–3.0 | 1.0 | 730 | $999 | $1.37 | 45d | 1 | 0.55mi |
| 10714 E 19th St S Independence, MO | 2.0 | 1.0 | 1010 | $895 | $0.89 | 5d | 1 | 0.60mi |
| 563 S Ash Ave Unit 3 Independence, MO | 2.0 | 1.0 | 650 | $950 | $1.46 | 4d | 1 | 0.66mi |
| 10323 E 20th St S Independence, MO | 3.0 | 1.0 | 936 | $1,400 | $1.50 | 45d | 1 | 0.71mi |
| 600 S Glenwood Ave Unit I Independence, MO | 1.0 | 1.0 | 700 | $695 | $0.99 | 45d | 1 | 0.84mi |
| 600 S Glenwood Ave Unit E Independence, MO | 1.0 | 1.0 | 600 | $725 | $1.21 | 45d | 1 | 0.84mi |
| 600 S Glenwood Ave Unit F Independence, MO | 2.0 | 1.0 | 750 | $995 | $1.33 | 21d | 1 | 0.84mi |
| 1810 S Vermont Ave Independence, MO | 2.0 | 1.0 | 950 | $948 | $1.00 | 45d | 1 | 0.90mi |
| 578 S Oxford Ave Independence, MO | 3.0 | 1.0 | 990 | $1,400 | $1.41 | 0d | 1 | 0.92mi |
| 530 Sundown Dr Independence, MO | 2.0 | 1.0 | 450 | $999 | $2.22 | 0d | 11 | 0.92mi |
| 576 S Oxford Ave Independence, MO | 3.0 | 2.0 | 1098 | $1,400 | $1.28 | 45d | 1 | 0.93mi |
| 2222 S Overton Ave Independence, MO | 2.0 | 1.0 | 800 | $1,025 | $1.28 | 23d | 1 | 0.93mi |
| 11616 E 16th St S Independence, MO | 2.0 | 1.0 | 1016 | $1,125 | $1.11 | 45d | 1 | 1.01mi |
| 124 S Forest Ave Independence, MO | 2.0 | 1.0 | 1092 | $999 | $0.91 | 0d | 1 | 1.04mi |
| 11601 E US Highway 24 Apt DA Independence, MO | 2.0 | 1.0 | 900 | $1,400 | $1.56 | 45d | 1 | 1.09mi |
| 1601 Blue Ridge Blvd Independence, MO | 2.0 | 1.0 | 515 | $1,025 | $1.99 | 0d | 3 | 1.14mi |
| 2503 S Crescent Ave Independence, MO | 2.0 | 2.0 | 864 | $1,295 | $1.50 | 18d | 1 | 1.20mi |
| 10604 E 26th St S Independence, MO | 3.0 | 1.0 | 1068 | $1,610 | $1.51 | 9d | 1 | 1.29mi |
| 303 N Huttig Ave Independence, MO | 2.0 | 1.0 | 640 | $1,200 | $1.88 | 0d | 1 | 1.37mi |
| 523 S Crysler Ave Unit A Independence, MO | 2.0 | 1.0 | 900 | $650 | $0.72 | 25d | 1 | 1.39mi |
Listing history 10 events
-
2026-06-21days on market $130,000 Active 13 DOM
-
2026-06-18days on market $130,000 Active 10 DOM
-
2026-06-17days on market $130,000 Active 9 DOM
-
2026-06-16days on market $130,000 Active 8 DOM
-
2026-06-15days on market $130,000 Active 7 DOM
-
2026-06-09days on market $130,000 Active 5 DOM
-
2026-06-08days on market $130,000 Active 4 DOM
-
2026-06-07days on market $130,000 Active 3 DOM
-
2026-06-05remarks 699-char remark
-
2026-06-05$130,000 Active 1 DOM
ⓘ Source: listings_history table (triggers on properties + properties_extension) + one-shot
backfill from property_details.listing_events for pre-trigger history.
Tax reassessment forecast MO · Resets to sale price
- Current annual tax
- $845 · $70/mo
- Projected year-2 tax
- $1,261 · $105/mo
- Expected delta
- +$416/yr (+$35/mo · 49.2%)
ⓘ Screening estimate from a state-policy table — verify with the county assessor before closing.
Climate risk First Street
- Flood 1/10 Low FEMA zone X (unshaded) · 0% chance over 30 yrs
- Wildfire 1/10 Low
- Heat 4/10 Moderate 7 d/yr ≥106°F today · 17 d/yr by 30 yrs out
- Wind 2/10 Low
- Air quality 3/10 Moderate 2 unhealthy d/yr today · 3 by 30 yrs out
Nearby sold comps map
Loading sold comps map…
Walkable amenities ~0.75 mi
Loading nearby amenities…
Taxation est. · year 1
- Rental income
- $12,631
- − Mortgage interest
- −$7,282
- − Property taxes
- −$845
- − Insurance
- −$650
- − Repairs & maintenance
- −$1,011
- − Management
- −$1,011
- − Depreciation
- −$3,782
- Taxable loss
- −$1,949
- Est. tax savings @ 24.0%
- +$468
- After-tax cash flow
- $770/yr
For passive investors: Depreciation is non-cash, so a rental often shows a tax loss while cash-flowing — sheltering income. Rental losses are passive: they offset passive income freely, and up to $25,000/yr can offset ordinary (W-2) income if you actively participate and your MAGI is under $100k (phasing out to $0 by $150k); unused losses carry forward. On sale, claimed depreciation is recaptured at up to 25%, and gains may owe capital-gains tax (a 1031 exchange can defer both). Figures are a year-1 estimate at your 24.0% rate — not tax advice; consult a CPA.
Schools (NCES district)
- District
- Independence 30
- NCES district ID
- 2915480
- Math proficiency
- 26% ▼ -8.00%
- Reading proficiency
- 38% ▼ -5.00%
- Median HH income
- $41,843
- Composite
- 27.04/100
- National rank
- #7054
- State rank
- #252 of 324 in MO
Livability — Independence
- Score
- 82/100
- State rank
- #10
- US rank
- #1296
Category grades
Schools grade is shown separately in the Schools card above.
Census & demographics
- Census place
- Independence, MO
- County
- Jackson County · 687,798 people
- City population
- 117,675
- Metro
- Kansas City, MO-KS
- Population (ZIP)
- 22,138
- Household income
- $59,007
- Rent vs Own
- Severe rent burden
- 965.0
Population outlook (Jackson County) Hauer SSP2
- Today (2025)
- 719,589 people
- By 2030
- 731,456 · +1.6%
- By 2040
- 746,689 · +3.8%
- By 2050
- 749,289 · +4.1%
- By 2075
- 736,227 · +2.3%
- By 2100
- 668,210 · -7.1%
Race, ethnicity, and origin ACS 2023
- Neighborhood character
- Diverse neighborhood (Simpson 0.56)
- Race & ethnicity
- White 62% Hispanic / Latino 23% Two or more races 15% Black 7% Asian 2%
- Hispanic origin (detail)
- Mexican 15%
- Common ancestry
- Italian 12% Slovak 2% Lithuanian 2%
- Foreign-born
- 11% · Canada, China
- Languages at home
- 85% English-only · Spanish 13% Other Asian/Pacific 1%
Political lean MEDSL · Jackson
- 2024 margin
- D (+19.3) · D 58.9% · R 39.5% · Other 1.6%
- 2008→2024 swing
- -6.1pp toward R · 2008: 25.4pp · 2024: 19.3pp
- All cycles
- 2024: D+19.3 2020: D+22.0 2016: D+16.6 2012: D+19.0 2008: D+25.4
Not yet ingested
- Civics
- —
Market trends
- HPI YoY
- ▼ -160.06%
- Current HPI
- 302.1124
- Rent YoY
- ▲ 5.43%
- Metro
- Kansas City, MO-KS
- State GDP YoY
- ▲ 1.84%
- F500 in state
- 20
Industry mix (Fortune 500 HQ in MO)
| Industry | F500 HQs | Revenue |
|---|---|---|
| Healthcare | 1 | $163B |
|
||
| Insurance | 1 | $21B |
|
||
| Industrial Technology | 1 | $17B |
|
||
| Retail | 1 | $16B |
|
||
| Industrial Distribution | 1 | $10B |
|
||
| Utilities | 1 | $9B |
|
||
Price history
-7.1% since first listed16 events — show timeline
- 2026-06-04 Listed $130,000 Heartland MLS as Distributed by MLS Grid
- 2025-02-20 Rental Removed $1,100 RENTLY
- 2024-12-27 Rental Removed $1,100 APPFOLIO
- 2024-12-27 Price Changed $1,100 APPFOLIO
- 2024-12-26 Listed for Rent $1,150 APPFOLIO
- 2024-12-20 Rental Removed $1,150 APPFOLIO
- 2024-12-20 Listed for Rent $1,150 RENTLY
- 2024-12-20 Listed for Rent $1,150 APPFOLIO
- 2024-06-20 Sold (Public Records) — Public Records
- 2024-06-14 Sold (MLS) — Heartland MLS as Distributed by MLS Grid
- 2024-05-12 Contingent — Heartland MLS as Distributed by MLS Grid
- 2024-05-04 Price Changed $130,000 Heartland MLS as Distributed by MLS Grid
- 2024-04-27 Listed $140,000 Heartland MLS as Distributed by MLS Grid
- 2021-09-21 Sold (Public Records) — Public Records
- 2005-03-02 Sold (Public Records) — Public Records
- 1991-11-16 Sold (Public Records) — Public Records
Property tax history
+3.8%/yrLatest (2025): $845 · -25.4% YoY. Source: county tax records.
Cash-flow waterfall
monthlySold comps — $/sqft
last 12 mo · ≤1 miLoading sold comps…