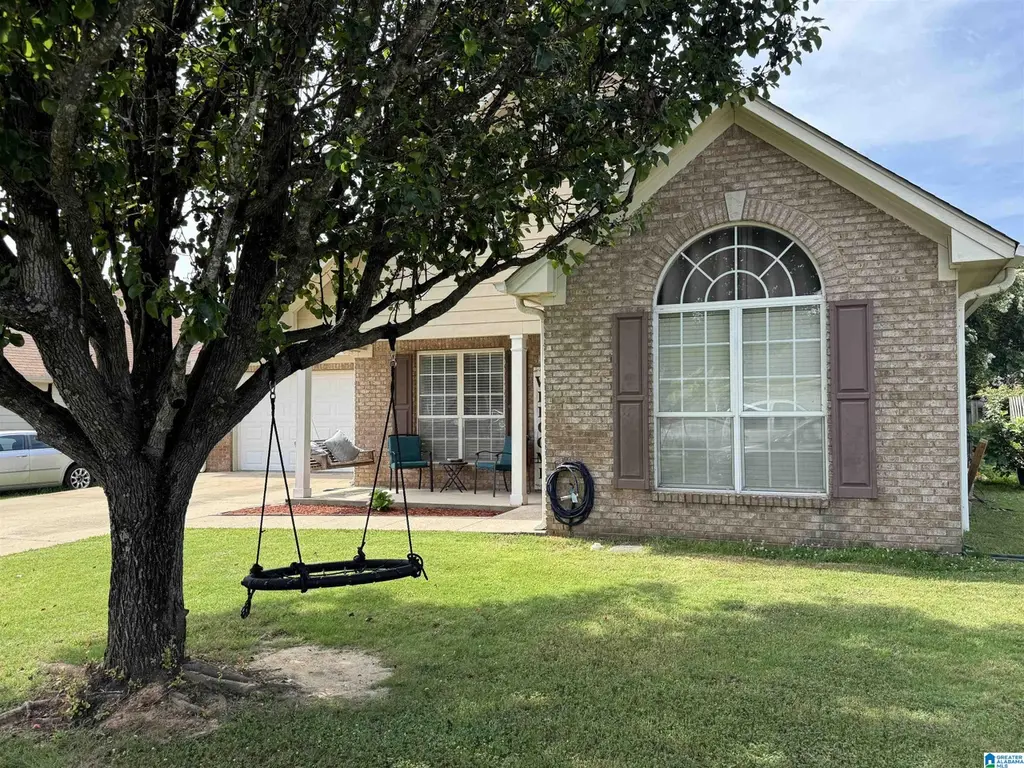
149 Spring St · Calera, AL
Flood risk 1/10 · Minimal
- FEMA flood zone
- X (unshaded)
- Chance of flooding over 30 yrs
- 0.0%
- Est. flood insurance / yr
- $507 – $1,088
Fire risk 4/10 · Minor
- Est. fire insurance / yr
- $916 – $1,700
Heat risk 7/10 · Major
- Hot days now (above 107°F)
- 7 days/yr
- Hot days in 30 yrs
- 20 days/yr
Wind risk 6/10 · Moderate
- Chance of severe wind over 30 yrs
- 56.0%
Air-quality risk 2/10 · Minimal
- Unhealthy air days now
- 2 days/yr
- Unhealthy air days in 30 yrs
- 2 days/yr
Risk factors via First Street. Map © Google.
Why this score? — see what drove the D- grade
The composite is a weighted blend of 9 inputs, each scored 0–100. Each bar is that input's sub-score; the figure is the points it added to the 100-point composite (weight × sub-score).
- Cash flow +12.4/30.0
- ARV discount +4.8/15.0
- Schools +3.9/10.0
- DSCR +3.7/10.0
- Rent growth +3.4/5.0
- Livability +3.0/5.0
- 1% rule +2.5/10.0
- Condition / age +2.5/5.0
- Appreciation +0.0/10.0
$235,000
🖨 Deal sheet (PDF) 📄 Offer letter ✓ Due diligence
Listing remarks MLS
Hurry this one won't last!! A great buy in Calera's Summerchase neighborhood. This home offers a large Great room with a wood burning fireplace, vaulted ceilings and crown molding. The kitchen has plenty of storage a pantry and eating area with French doors that lead out to your covered patio and fenced back yard. The HVAC system is only two years old, the roof new2021. Minutes from I65, shopping and restaurants.
Key facts
- 6,490 sq ft lot
- 2 garage spots
- Built 2002
Property features AI
Finance
- Other: Lot size about 0.149 acres; Property listed in Calera tax district
- HOA & community: Located in the Summerchase subdivision
Exterior
- Parking: Front entry garage; Attached 2-car garage; Driveway parking; Parking at main level
- Utilities: Public water; Connected sewer; Internet service available (T-Mobile)
- Home design: Existing construction; Single-story living spaces (rooms listed at main level)
- Construction: Siding (other) exterior; Slab foundation
- Exterior features: Fenced yard; No pool; No patio, deck, or garden/patio area indicated; Not waterfront
Interior
- Kitchen: Laminate countertops; Dishwasher (built-in); Refrigerator included; Electric stove
- Bedrooms: Master bedroom on main level; Additional bedrooms on main level
- Flooring: Carpet; Tile; Vinyl
- Bathrooms: Two full bathrooms; Master bath with separate shower and garden tub; Additional bath(s) with tub/shower combo and shared bath configuration
- Heating & cooling: Central heating; Central cooling
- Interior features: Living area approximately 1,361 (per tax report); Ceilings: Other (see remarks); No special interior features listed; Wood-burning fireplace with insert in the living room
- Laundry & utility: Laundry on the main level in a closet; Washer hookup provided; Electric dryer hookup; Electric water heater
Neighborhood map
What this means for you Summary
Snapshot
- This is a 3-bed/2.0-bath single-family listed at $235k.
Deal economics
- At list price, monthly cash flow is $-40 ($-484/yr) — negative.
- To cash-flow at today's rent, offer at most $228k (3.0% below list).
- To meet the 1% rule (rent ≥ 1% of price), the offer needs to be $175k (25.4% below list).
- Recommended offer: $175k (25.4% below list) — sets the bar for 1% rule.
- Cap rate 6.1% vs local median 4.5% in Calera — top-decile yield for the area; either an underpriced asset or a hidden risk that comps aren't pricing in. Stress-test before assuming the spread holds.
Location & tenants
- Location reads 59/100 on livability (#325 in AL) — a working-class tenant base; expect higher turnover. Strengths: cost of living A+, housing A+, employment A-; Watch: amenities F, commute F, health & safety F.
- Shelby County (suburban): math 30% / reading 58% proficiency, ranked #16 of 129 in AL (top 12%) — families likely to look elsewhere, expect single-tenant / working-renter base with shorter leases.
- Zoned schools: Calera Elementary (752 students, 64% FRL); Calera Middle (math 9% / reading 45%, grade F, #147 of 257 statewide, top 58%, 755 students, 61% FRL); Calera High (math 18% / reading 21%, grade F, #169 of 305 statewide, top 59%, 1,066 students, 59% FRL) — zoned schools average 62% FRL vs 26% district-wide (36 pts higher); higher-poverty schools than district average — tighter screening recommended.
- Zoned-school proficiency averages 23% at this address vs 44% district-wide (-21 pts) — the specific schools serving this property underperform the Shelby County average; the district grade overstates school quality for this exact location.
- Market conditions: Rents rising (+3.7%/yr); 373 active listings in the ZIP; 10 comparable units currently listed for rent nearby; rentals leasing fast (median 5d on market — plan ~1-2 weeks tenant-placement turnaround); solid renter incomes; 987 units permitted in Shelby County in 2024 (0 in 5+ unit buildings).
Forward outlook
- Local home prices are declining (-3.0%/yr); year-one equity from $2k of loan paydown is wiped out by about $7k of value loss. Plan a longer hold.
- Shelby County population projected at +23% by 2050 — long-run rental-demand tailwind backs the buy-and-hold thesis.
Negotiation context
- Only 8 days on market — expect competitive offers; lowballing is unlikely to land.
- 3 sale attempts since 11y ago with the ask held roughly flat each time — persistent listings suggest the price (not the market) is what's stuck; bring a comps-based counter.
Risks & watch-outs
- Climate carrying-cost: major wind risk, 56% chance of damaging wind over 30y; extreme-heat days projected 7→20/yr by 2055 (HVAC capex compounding) — expect insurance premiums to compound above CPI over the hold.
Questions for the listing agent
- What do current leases actually rent for vs. the listed asking? Can we see a recent rent roll and the last 12 months of T-12 income?
- Is there a deadline driving the sale (1031 exchange, divorce, estate, relocation)? That informs how much negotiation room exists.
- Schools are D-rated, which usually means shorter tenancies and higher turnover. Who's the typical renter profile here, and what's been the actual vacancy rate?
- The area grade is low — what's the realistic commute time and amenity access for the typical tenant pool here? Any planned neighborhood developments (good or bad) we should know about?
- What's the average days-on-market for RENTAL listings here right now (not sales)? A rising rental-DOM trend means longer vacancies and softer asking-rent achievability than the comps imply.
- What's the recent tenant-quality profile in this submarket — average credit score on applications, eviction rate, late-payment / NSF rate, and stable-employment percentage? A property-management company in the area should have these aggregated.
- How much new for-sale + rental construction is in the pipeline within 1–3 miles? Heavy new supply typically softens prices + rents 12–24 months out; constrained supply supports both.
Investment metrics
- 1% rule
- 0.75% ✗
- Cap rate
- 6.09%
- Cash-on-cash
- -0.74%
- DSCR
- 0.97
- GRM
- 11.2
CMA / ARV
- ARV (on-the-fly)
- $221,843
- Comps found
- 12
Show comp detail 12 sales within ~0.75 mi
| Address | Dist | Beds/Ba | Sqft | Sold | Price | $/sf | Match |
|---|---|---|---|---|---|---|---|
| 127 Sunset Ln | 0.07mi | 3/2.0 | 1,399 (+3%) | 8mo | $235,000 | $168 | 86 |
| 452 Summerchase Dr | 0.10mi | 3/2.0 | 1,388 (+2%) | 14mo | $228,000 | $164 | 81 |
| 117 Sunset Ln | 0.08mi | 3/2.0 | 1,444 (+6%) | 13mo | $200,000 | $139 | 75 |
| 109 Spring St | 0.13mi | 3/2.0 | 1,416 (+4%) | 15mo | $240,000 | $169 | 75 |
| 134 Spring St | 0.06mi | 3/2.0 | 1,532 (+13%) | 6mo | $220,000 | $144 | 72 |
| 132 Summerchase Pkwy | 0.16mi | 3/2.0 | 1,260 (-7%) | 10mo | $225,000 | $179 | 71 |
| 153 Summerchase Pkwy | 0.14mi | 3/2.0 | 1,444 (+6%) | 22mo | $235,000 | $163 | 65 |
| 928 Daventry Trl | 0.74mi | 3/2.0 | 1,337 (-2%) | 4mo | $236,000 | $177 | 59 |
| 113 Spring St | 0.11mi | 3/2.0 | 1,552 (+14%) | 17mo | $236,000 | $152 | 57 |
| 904 Daventry Trl | 0.72mi | 3/2.0 | 1,426 (+5%) | 4mo | $230,000 | $161 | 55 |
| 468 Daventry Cir | 0.72mi | 3/2.0 | 1,435 (+5%) | 13mo | $227,500 | $159 | 47 |
| 924 Daventry Trl | 0.73mi | 3/2.0 | 1,477 (+8%) | 15mo | $227,500 | $154 | 40 |
Match score weights: distance 35% · size 25% · config 20% · recency 20%. Top-matched comps best support the ARV.
Projected returns pro-forma
-3.0% appreciation · 3.67% rent growth · sell at horizon
- IRR
- -16.9%
- Equity multiple
- 0.40×
- Total profit
- $-39,557
- Equity at exit
- $35,039
- IRR
- -7.8%
- Equity multiple
- 0.50×
- Total profit
- $-33,197
- Equity at exit
- $20,319
Cash invested: $65,800 (down + closing). Projections, not guarantees.
Landlord ↔ Tenant lean methodology
- Overall (STATE)
- 90 Strongly Landlord-Friendly
- State Alabama
- 90 Strongly Landlord-Friendly · R+15
- County
- — inherits STATE
- City
- — inherits STATE
ZIP-level market 35040
- Home prices YoY
- -16.5%
- Rents YoY
- 3.7%
- Active inventory
- 373
- Price-to-rent
- 11.2×
Monthly cashflow live
- Estimated rent
- $1,753 high interval (Pro) →
- Mortgage (P&I)
- −$1,232
- Tax from tax record
- −$95 /mo · $1,135/yr
- Insurance
- −$98
- HOA
- −$0
- Vacancy / Maint / Mgmt
- −$368
- Net cashflow
- $-40
Break-even live
Sensitivity live
| Price | -10% $93 | -5% $26 | +0% $-40 | +5% $-107 | +10% $-173 |
|---|---|---|---|---|---|
| Rent | -10% $-179 | -5% $-110 | +0% $-40 | +5% $29 | +10% $98 |
| Rate | -1.0pp $78 | -0.5pp $19 | base $-40 | +0.5pp $-101 | +1.0pp $-163 |
UW: 25.0% down · 7.5% · 30yr · 1.5% tax · 5.0% vac · 8.0% maint · 8.0% mgmt
Financing live
Cash to close
- Down payment
- $58,750
- Closing costs
- $7,050
- Reserves months
- —
- Total cash needed
- —
Loan-product check · same deal, 3 products live
Conventional
25% down · 7.5% · 30yr
- Down + closing
- —
- Monthly P&I
- —
- Monthly cashflow
- —
- DSCR
- —
- Eligible?
- —
Personal DTI + credit; lowest rate.
DSCR
20% down · 8.5% · 30yr
- Down + closing
- —
- Monthly P&I
- —
- Monthly cashflow
- —
- DSCR
- —
- Eligible?
- —
No personal income docs; deal must DSCR.
Hard money
10% down · 12.0% · 12mo
- Down + closing
- —
- Monthly P&I
- —
- Monthly cashflow
- —
- DSCR
- —
- Eligible?
- —
Short-term bridge; refi at stabilization.
Rent comps 10 comps
| Address | Beds | Baths | Sqft | Rent | $/sqft | DOM | Units | Dist |
|---|---|---|---|---|---|---|---|---|
| 916 Daventry Trl Calera, AL | 3.0 | 2.0 | 1331 | $1,550 | $1.16 | 3d | 1 | 0.71mi |
| 155 King Richards Way Calera, AL | 3.0 | 2.5 | 1804 | $1,900 | $1.05 | 5d | 1 | 0.82mi |
| 2027 Rossburg Pl Calera, AL | 2.0 | 2.0 | 1073 | $1,300 | $1.21 | 25d | 1 | 1.16mi |
| 2000 Rossburg Pl Calera, AL | 2.0 | 2.0 | 1142 | $1,500 | $1.31 | 5d | 1 | 1.20mi |
| 10 Kensington Manor Dr Calera, AL | 1.0–2.0 | 1.0–2.0 | 1058 | $2,147 | $2.03 | 3d | 1 | 1.25mi |
| 680 The Heights Ln Calera, AL | 3.0 | 2.5 | 1397 | $1,750 | $1.25 | 3d | 1 | 1.34mi |
| 141 Union Station Dr Calera, AL | 4.0 | 2.5 | 1800 | $1,695 | $0.94 | 25d | 1 | 1.34mi |
| 699 The Heights Ln Calera, AL | 2.0 | 2.5 | 1100 | $1,400 | $1.27 | 12d | 1 | 1.35mi |
| 192 Stonecreek Pl Calera, AL | 3.0 | 2.0 | 1220 | $1,738 | $1.42 | 5d | 1 | 1.44mi |
| 316 Union Station Dr Calera, AL | 4.0 | 2.0 | 1620 | $1,775 | $1.10 | 45d | 1 | 1.49mi |
Listing history 7 events
-
2026-06-21days on market $235,000 Active 8 DOM
-
2026-06-18days on market $235,000 Active 5 DOM
-
2026-06-17days on market $235,000 Active 4 DOM
-
2026-06-16days on market $235,000 Active 3 DOM
-
2026-06-15days on market $235,000 Active 2 DOM
-
2026-06-13remarks 310-char remark
-
2026-06-13$235,000 Active 1 DOM
ⓘ Source: listings_history table (triggers on properties + properties_extension) + one-shot
backfill from property_details.listing_events for pre-trigger history.
Tax reassessment forecast AL · Resets to sale price
- Current annual tax
- $1,135 · $95/mo
- Projected year-2 tax
- $1,135 · $95/mo
- Expected delta
- $0/yr ($0/mo · 0.0%)
ⓘ Screening estimate from a state-policy table — verify with the county assessor before closing.
Climate risk First Street
- Flood 1/10 Low FEMA zone X (unshaded) · 0% chance over 30 yrs
- Wildfire 4/10 Moderate
- Heat 7/10 Severe 7 d/yr ≥107°F today · 20 d/yr by 30 yrs out
- Wind 6/10 Major 56% chance of damaging wind over 30 yrs
- Air quality 2/10 Low 2 unhealthy d/yr today · 2 by 30 yrs out
Nearby sold comps map
Loading sold comps map…
Walkable amenities ~0.75 mi
Loading nearby amenities…
Taxation est. · year 1
- Rental income
- $21,031
- − Mortgage interest
- −$13,164
- − Property taxes
- −$1,135
- − Insurance
- −$1,175
- − Repairs & maintenance
- −$1,682
- − Management
- −$1,682
- − Depreciation
- −$6,836
- Taxable loss
- −$4,644
- Est. tax savings @ 24.0%
- +$1,115
- After-tax cash flow
- $630/yr
For passive investors: Depreciation is non-cash, so a rental often shows a tax loss while cash-flowing — sheltering income. Rental losses are passive: they offset passive income freely, and up to $25,000/yr can offset ordinary (W-2) income if you actively participate and your MAGI is under $100k (phasing out to $0 by $150k); unused losses carry forward. On sale, claimed depreciation is recaptured at up to 25%, and gains may owe capital-gains tax (a 1031 exchange can defer both). Figures are a year-1 estimate at your 24.0% rate — not tax advice; consult a CPA.
Schools (NCES district)
- District
- Shelby County
- NCES district ID
- 0103030
- Math proficiency
- 30% ▼ -28.00%
- Reading proficiency
- 58% ▲ 2.00%
- Median HH income
- $66,672
- Composite
- 39.29/100
- National rank
- #3995
- State rank
- #16 of 129 in AL
Livability — Calera
- Score
- 59/100
- State rank
- #325
- US rank
- #19917
Category grades
Schools grade is shown separately in the Schools card above.
Census & demographics
- Census place
- Calera, AL
- County
- Shelby County · 188,970 people
- City population
- 19,304
- Metro
- Birmingham-Hoover, AL
- Population (ZIP)
- 19,304
- Household income
- $84,554
- Rent vs Own
- Severe rent burden
- 388.0
Population outlook (Shelby County) Hauer SSP2
- Today (2025)
- 237,024 people
- By 2030
- 249,868 · +5.4%
- By 2040
- 272,778 · +15.1%
- By 2050
- 291,062 · +22.8%
- By 2075
- 326,049 · +37.6%
- By 2100
- 335,870 · +41.7%
Race, ethnicity, and origin ACS 2023
- Neighborhood character
- Diverse neighborhood (Simpson 0.56)
- Race & ethnicity
- White 59% Black 30% Hispanic / Latino 9% Two or more races 3%
- Hispanic origin (detail)
- Mexican 7%
- Common ancestry
- Slovak 3% Italian 1% Serbian 1%
- Foreign-born
- 6% · Canada, China
- Languages at home
- 91% English-only · Spanish 6% Arabic 1% Chinese 1%
Political lean MEDSL · Shelby
- 2024 margin
- Solid R (+40.9) · D 29.0% · R 69.9% · Other 1.1%
- 2008→2024 swing
- +12.6pp toward D · 2008: -53.4pp · 2024: -40.9pp
- All cycles
- 2024: R+40.9 2020: R+40.4 2016: R+50.3 2012: R+55.6 2008: R+53.4
Not yet ingested
- Civics
- —
Market trends
- HPI YoY
- ▼ -43.58%
- Current HPI
- 220.2843
- Rent YoY
- ▲ 3.67%
- Metro
- Birmingham-Hoover, AL
- State GDP YoY
- ▲ 2.94%
- F500 in state
- 4
Industry mix (Fortune 500 HQ in AL)
| Industry | F500 HQs | Revenue |
|---|---|---|
| Financial Services | 1 | $8B |
|
||
| Healthcare | 1 | $5B |
|
||
Price history
+102.8% since first listed9 events — show timeline
- 2026-06-13 Listed $235,000 Greater Alabama MLS
- 2021-12-09 Sold (Public Records) $205,000 Public Records
- 2021-11-29 Sold (MLS) $205,000 Greater Alabama MLS
- 2021-10-25 Contingent — Greater Alabama MLS
- 2021-10-22 Listed $185,000 Greater Alabama MLS
- 2021-10-19 Coming Soon $185,000 Greater Alabama MLS
- 2015-04-14 Sold (MLS) $108,000 Greater Alabama MLS
- 2015-03-24 Delisted — Greater Alabama MLS
- 2015-01-21 Listed $115,900 Greater Alabama MLS
Property tax history
+4.8%/yrLatest (2025): $1,135 · +0.3% YoY. Source: county tax records.
Cash-flow waterfall
monthlySold comps — $/sqft
last 12 mo · ≤1 miLoading sold comps…