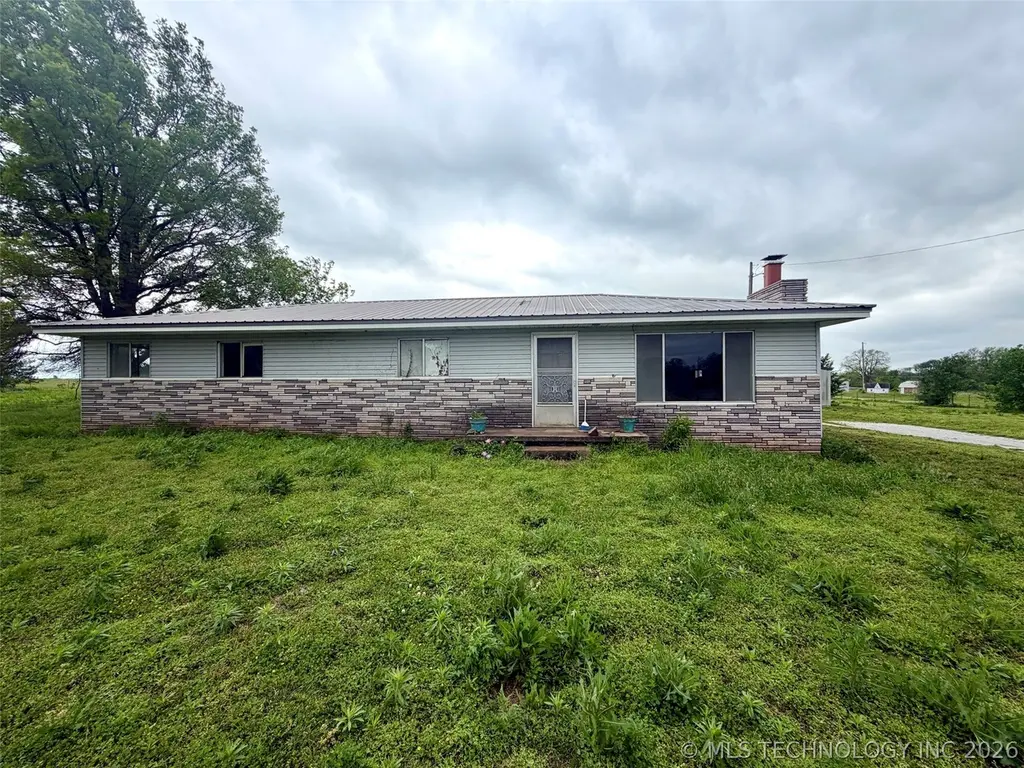
56601 E 150 Rd · Fairland, OK
Flood risk 1/10 · Minimal
- FEMA flood zone
- X (unshaded)
- Chance of flooding over 30 yrs
- 0.0%
- Est. flood insurance / yr
- $507 – $1,088
Fire risk 5/10 · Moderate
- Est. fire insurance / yr
- $2,463 – $4,575
Heat risk 6/10 · Moderate
- Hot days now (above 110°F)
- 7 days/yr
- Hot days in 30 yrs
- 20 days/yr
Wind risk 3/10 · Minor
- Chance of severe wind over 30 yrs
- 4.0%
Air-quality risk 2/10 · Minimal
- Unhealthy air days now
- 1 days/yr
- Unhealthy air days in 30 yrs
- 2 days/yr
Risk factors via First Street. Map © Google.
Why this score? — see what drove the C- grade
The composite is a weighted blend of 9 inputs, each scored 0–100. Each bar is that input's sub-score; the figure is the points it added to the 100-point composite (weight × sub-score).
- Cash flow +18.4/30.0
- ARV discount +7.5/15.0
- Appreciation +7.2/10.0
- DSCR +5.8/10.0
- 1% rule +4.0/10.0
- Livability +3.2/5.0
- Rent growth +2.5/5.0
- Condition / age +2.5/5.0
- Schools +2.1/10.0
$125,000
🖨 Deal sheet 📄 Offer letter ✓ Due diligence
Listing remarks
So much potential in this property! Fully fenced 2 acres just North of Fairland. Plenty of room to raise some chickens, raise some kids, or raise a garden. Lots of places to park a trailer, boat, or RV. Enjoy tinkering around in the 24x30 red iron metal shop with a concrete floor, roll-up door, and electric. Home is brick and vinyl with a metal roof and has 3 bedrooms, a large laundry, and 1.5 baths. Eat-in kitchen with lots of space. The family room has a fireplace for those cold nights. Extra room sits off of the family room and could be used as a formal dining, office, or closed in for another bedroom. Grab your tool belt and bring your dreams!
Key facts
- Brick and vinyl
- Fully fenced 2 acres
- Electric
Tags
Property features AI
Finance
- Other: Property listed as suitable for horses (horses allowed); Lot described as farm/ranch (2 acres)
- HOA & community: Gutter(s) listed as a community/feature
Exterior
- Parking: Attached garage; 4-car garage spaces; Carport
- Security: Storm shelter
- Utilities: Electricity available; Natural gas available; Water available; Septic tank; Rural well water
- Home design: Single-story; Faces north; Basement and slab foundation
- Construction: Built in (public records); Vinyl siding with wood frame construction; Metal roof
- Exterior features: Rain gutters; Chain link full fencing; Workshop; Storm shelter
Interior
- Flooring: Laminate flooring
- Bathrooms: 1 full bathroom; 1 half bathroom
- Heating & cooling: Propane heating
- Interior features: Ceiling fan(s); Laminate counters; Aluminum window frames; Ventilation for improved indoor air quality
- Laundry & utility: Washer hookup; Electric dryer hookup; Electric water heater
Neighborhood map
What this means for you Summary
Snapshot
- This is a 3-bed/1.0-bath single-family listed at $125k.
Deal economics
- At list price, monthly cash flow is $116 ($1k/yr) — positive.
- The deal already cash-flows at list — no discount required.
- To meet the 1% rule (rent ≥ 1% of price), the offer needs to be $113k (9.9% below list).
- Recommended offer: $113k (9.9% below list) — sets the bar for 1% rule.
Location & tenants
- Location reads 64/100 on livability (#170 in OK) — a middle-class / working-renter tenant base. Strengths: crime A+, cost of living A+, housing A+; Watch: schools D+, amenities F, commute F.
- Fairland (rural): math 20% / reading 30% proficiency, ranked #113 of 270 in OK (top 42%) — low school quality limits family demand, transient renter base, plan for 1-2y turnover.
- Market conditions: 14 active listings in the ZIP; 3 units permitted in Ottawa County in 2024 (0 in 5+ unit buildings).
Forward outlook
- In year one you build about $6k of equity ($864 loan paydown + $5k appreciation (4.4% local appreciation)).
- Ottawa County population projected to shrink 4% by 2050 — rents likely to lag national; underwrite the cash flow, not the appreciation.
- At projected returns (4.4% appreciation + 3.0% rent growth), your $35k cash investment doubles in ~5 years — after that, you're playing with house money.
- By year 6, paydown + projected appreciation supports a ~$34k cash-out refi (75% LTV) — recoverable capital for the next deal without selling this one.
Negotiation context
- It's been on market 21 days — a 2% lower offer ($123k) is reasonable based on typical stale-listing flexibility.
- 2 sale attempts since 8y ago with the ask held roughly flat each time — persistent listings suggest the price (not the market) is what's stuck; bring a comps-based counter.
Risks & watch-outs
- Climate carrying-cost: moderate wildfire risk; extreme-heat days projected 7→20/yr by 2055 (HVAC capex compounding) — expect insurance premiums to compound above CPI over the hold.
Questions for the listing agent
- Built in 1965 — when were the roof, HVAC, electrical panel, plumbing, and water heater last replaced?
- Is there a deadline driving the sale (1031 exchange, divorce, estate, relocation)? That informs how much negotiation room exists.
- Schools are D-rated, which usually means shorter tenancies and higher turnover. Who's the typical renter profile here, and what's been the actual vacancy rate?
- What's the average days-on-market for RENTAL listings here right now (not sales)? A rising rental-DOM trend means longer vacancies and softer asking-rent achievability than the comps imply.
- What's the recent tenant-quality profile in this submarket — average credit score on applications, eviction rate, late-payment / NSF rate, and stable-employment percentage? A property-management company in the area should have these aggregated.
- How much new for-sale + rental construction is in the pipeline within 1–3 miles? Heavy new supply typically softens prices + rents 12–24 months out; constrained supply supports both.
Investment metrics
- 1% rule
- 0.90% ✗
- Cap rate
- 7.41%
- Cash-on-cash
- 3.99%
- DSCR
- 1.18
- GRM
- 9.3
CMA / ARV
No comps found within radius.
Projected returns pro-forma
4.36% appreciation · 3.0% rent growth · sell at horizon
- IRR
- 14.7%
- Equity multiple
- 1.90×
- Total profit
- $31,669
- Equity at exit
- $66,038
- IRR
- 15.6%
- Equity multiple
- 3.62×
- Total profit
- $91,578
- Equity at exit
- $110,190
Cash invested: $35,000 (down + closing). Projections, not guarantees.
Landlord ↔ Tenant lean methodology
- Overall (STATE)
- 83 Strongly Landlord-Friendly
- State Oklahoma
- 83 Strongly Landlord-Friendly · R+20
- County
- — inherits STATE
- City
- — inherits STATE
ZIP-level market 74343
- Home prices YoY
- 1.2%
- Active inventory
- 14
- Price-to-rent
- 9.3×
Monthly cashflow live
- Estimated rent
- $1,126 medium interval (Pro) →
- Mortgage (P&I)
- −$656
- Tax from tax record
- −$66 /mo · $788/yr
- Insurance
- −$52
- HOA
- −$0
- Vacancy / Maint / Mgmt
- −$236
- Net cashflow
- $116
Break-even live
UW: 25.0% down · 7.5% · 30yr · 1.5% tax · 5.0% vac · 8.0% maint · 8.0% mgmt
Financing live
Cash to close
- Down payment
- $31,250
- Closing costs
- $3,750
- Reserves months
- —
- Total cash needed
- —
Loan-product check · same deal, 3 products live
Conventional
25% down · 7.5% · 30yr
- Down + closing
- —
- Monthly P&I
- —
- Monthly cashflow
- —
- DSCR
- —
- Eligible?
- —
Personal DTI + credit; lowest rate.
DSCR
20% down · 8.5% · 30yr
- Down + closing
- —
- Monthly P&I
- —
- Monthly cashflow
- —
- DSCR
- —
- Eligible?
- —
No personal income docs; deal must DSCR.
Hard money
10% down · 12.0% · 12mo
- Down + closing
- —
- Monthly P&I
- —
- Monthly cashflow
- —
- DSCR
- —
- Eligible?
- —
Short-term bridge; refi at stabilization.
Listing history 17 events
-
2026-06-18days on market $125,000 Active 21 DOM
-
2026-06-17days on market $125,000 Active 20 DOM
-
2026-06-16days on market $125,000 Active 19 DOM
-
2026-06-15days on market $125,000 Active 18 DOM
-
2026-06-13days on market $125,000 Active 16 DOM
-
2026-06-12days on market $125,000 Active 15 DOM
-
2026-06-09days on market $125,000 Active 12 DOM
-
2026-06-08days on market $125,000 Active 11 DOM
-
2026-06-08days on market $125,000 Active 10 DOM
-
2026-06-07days on market $125,000 Active 9 DOM
-
2026-06-04days on market $125,000 Active 6 DOM
-
2026-06-02days on market $125,000 Active 5 DOM
-
2026-06-01days on market $125,000 Active 4 DOM
-
2026-05-31days on market $125,000 Active 3 DOM
-
2026-05-28$125,000 Active
-
2019-02-01historical
-
2018-08-31$285,000
ⓘ Source: listings_history table (triggers on properties + properties_extension) + one-shot
backfill from property_details.listing_events for pre-trigger history.
Tax reassessment forecast OK · Resets to sale price
- Current annual tax
- $788 · $66/mo
- Projected year-2 tax
- $1,125 · $94/mo
- Expected delta
- +$337/yr (+$28/mo · 42.8%)
ⓘ Screening estimate from a state-policy table — verify with the county assessor before closing.
Climate risk First Street
- Flood 1/10 Low FEMA zone X (unshaded) · 0% chance over 30 yrs
- Wildfire 5/10 Major
- Heat 6/10 Major 7 d/yr ≥110°F today · 20 d/yr by 30 yrs out
- Wind 3/10 Moderate 4% chance of damaging wind over 30 yrs
- Air quality 2/10 Low 1 unhealthy d/yr today · 2 by 30 yrs out
Nearby sold comps map
Loading sold comps map…
Walkable amenities ~0.75 mi
Loading nearby amenities…
Taxation est. · year 1
- Rental income
- $13,512
- − Mortgage interest
- −$7,002
- − Property taxes
- −$788
- − Insurance
- −$625
- − Repairs & maintenance
- −$1,081
- − Management
- −$1,081
- − Depreciation
- −$3,636
- Taxable loss
- −$701
- Est. tax savings @ 24.0%
- +$168
- After-tax cash flow
- $1,564/yr
For passive investors: Depreciation is non-cash, so a rental often shows a tax loss while cash-flowing — sheltering income. Rental losses are passive: they offset passive income freely, and up to $25,000/yr can offset ordinary (W-2) income if you actively participate and your MAGI is under $100k (phasing out to $0 by $150k); unused losses carry forward. On sale, claimed depreciation is recaptured at up to 25%, and gains may owe capital-gains tax (a 1031 exchange can defer both). Figures are a year-1 estimate at your 24.0% rate — not tax advice; consult a CPA.
Schools (NCES district)
- District
- Fairland
- NCES district ID
- 4011250
- Math proficiency
- 20% ▼ -18.00%
- Reading proficiency
- 30% ▼ -9.00%
- Median HH income
- $40,058
- Composite
- 21.07/100
- National rank
- #8446
- State rank
- #113 of 270 in OK
Livability — Fairland
- Score
- 64/100
- State rank
- #170
- US rank
- #13826
Category grades
Schools grade is shown separately in the Schools card above.
Census & demographics
- Population (ZIP)
- 3,245
Population outlook (Ottawa County) Hauer SSP2
- Today (2025)
- 31,860 people
- By 2030
- 31,699 · -0.5%
- By 2040
- 31,324 · -1.7%
- By 2050
- 30,745 · -3.5%
- By 2075
- 29,902 · -6.1%
- By 2100
- 27,545 · -13.5%
Race, ethnicity, and origin ACS 2023
- Neighborhood character
- Diverse neighborhood (Simpson 0.56)
- Race & ethnicity
- White 66% Native American 19% Two or more races 13% Hispanic / Latino 2%
- Common ancestry
- Iranian 2% Italian 1% Portuguese 1%
- Foreign-born
- 2% · Canada, China
- Languages at home
- 98% English-only · Spanish 1% Other Asian/Pacific 1%
Political lean MEDSL · Ottawa
- 2024 margin
- Solid R (+53.5) · D 22.5% · R 76.0% · Other 1.6%
- 2008→2024 swing
- -29.9pp toward R · 2008: -23.6pp · 2024: -53.5pp
- All cycles
- 2024: R+53.5 2020: R+51.2 2016: R+47.2 2012: R+29.7 2008: R+23.6
Not yet ingested
- Civics
- —
Market trends
- HPI YoY
- ▲ 4.36%
- Current HPI
- 354.9286
- Rent YoY
- —
- Metro
- —
- State GDP YoY
- ▲ 1.55%
- F500 in state
- 6
Industry mix (Fortune 500 HQ in OK)
| Industry | F500 HQs | Revenue |
|---|---|---|
| Energy | 3 | $48B |
|
||
Price history
-56.1% since first listed3 events — show timeline
- 2026-05-28 Listed $125,000 MLS Technology, Inc.
- 2019-02-01 Listing Removed — MLS Technology, Inc.
- 2018-08-31 Listed $285,000 MLS Technology, Inc.
Property tax history
+4.9%/yrLatest (2025): $788 · +6.9% YoY. Source: county tax records.
Cash-flow waterfall
monthlySold comps — $/sqft
last 12 mo · ≤1 miLoading sold comps…