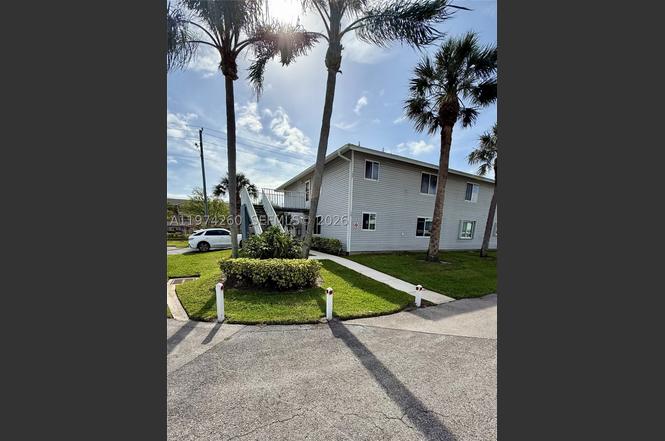
150 SE Village Dr #150 · Port St. Lucie, FL
Flood risk 3/10 · Minor
- FEMA flood zone
- X (unshaded)
- Chance of flooding over 30 yrs
- 0.2%
- Est. flood insurance / yr
- $507 – $1,088
Fire risk 3/10 · Minor
- Est. fire insurance / yr
- $947 – $1,759
Heat risk 10/10 · Severe
- Hot days now (above 106°F)
- 7 days/yr
- Hot days in 30 yrs
- 24 days/yr
Wind risk 10/10 · Severe
- Chance of severe wind over 30 yrs
- 99.0%
Air-quality risk 2/10 · Minimal
- Unhealthy air days now
- 1 days/yr
- Unhealthy air days in 30 yrs
- 1 days/yr
Risk factors via First Street. Map © Google.
Why this score? — see what drove the D grade
The composite is a weighted blend of 9 inputs, each scored 0–100. Each bar is that input's sub-score; the figure is the points it added to the 100-point composite (weight × sub-score).
- Cash flow +10.8/30.0
- 1% rule +7.8/10.0
- ARV discount +7.5/15.0
- Schools +3.7/10.0
- DSCR +3.1/10.0
- Rent growth +3.0/5.0
- Livability +2.5/5.0
- Condition / age +2.5/5.0
- Appreciation +0.0/10.0
$155,000
🖨 Deal sheet 📄 Offer letter ✓ Due diligence
Listing remarks MLS
ALL MEASUREMENTS APPROXIMATE. CARPET LESS THEN A YR OLD DONT MISS OUT ON THIS ONE! , VERY PRIVATE SCREENED PATIO, OPEN CONCEPT , AND GREAT LOCATION !
Key facts
- Canal view
- In unit washer dryer
- First floor condo
Tags
Property features AI
Finance
- Financial info: Pets allowed with possible restrictions
- HOA & community: Monthly association fee; Association amenities include clubhouse, pool, and spa/hot tub; Association covers common areas, cable TV, insurance, grounds and structure maintenance, parking, reserve fund, roof, and trash
Exterior
- Parking: Assigned parking; Guest parking available; One assigned space
- Security: Smoke detector(s)
- Utilities: Electric water heater
- Home design: Attached property; 2 stories; Entry at level 1; Has view
- Construction: Frame construction; Resale property
- Exterior features: Enclosed porch; Porch with screened area; Association pool
Interior
- Kitchen: Dishwasher; Electric range; Microwave; Refrigerator; Garbage disposal; Electric water heater
- Bedrooms: Primary bedroom on main level; At least one bedroom on the main level
- Flooring: Ceramic tile
- Bathrooms: 2 full bathrooms
- Heating & cooling: Central heating; Central air; Ceiling fan(s)
- Interior features: Furnished; First floor entry; Main-level primary suite; Walk-in closet(s); Bedroom on main level
- Laundry & utility: Washer; Dryer
Neighborhood map
What this means for you Summary
Snapshot
- This is a 2-bed/2.0-bath condo listed at $155k.
Deal economics
- At list price, monthly cash flow is $-70 ($-836/yr) — negative.
- To cash-flow at today's rent, offer at most $143k (7.9% below list).
- Meets the 1% rule at list price ($2k rent vs $155k).
- Recommended offer: $141k (9.0% below list) — sets the bar for market timing.
- Cap rate 5.8% vs local median 3.9% in Port St. Lucie — top-decile yield for the area; either an underpriced asset or a hidden risk that comps aren't pricing in. Stress-test before assuming the spread holds.
Location & tenants
- Location reads: area grade D — affects rentability + tenant quality, not the cash-flow math above.
- St. Lucie (urban): math 40% / reading 48% proficiency, ranked #51 of 73 in FL (top 70%) — families likely to look elsewhere, expect single-tenant / working-renter base with shorter leases.
- Market conditions: Rents rising (+1.9%/yr); 639 active listings in the ZIP; 25 comparable units currently listed for rent nearby; rentals leasing fast (median 14d on market — plan ~1-2 weeks tenant-placement turnaround); 4,868 units permitted in St. Lucie County in 2024 (268 in 5+ unit buildings).
- This rent runs 39% of the median local income ($62k/yr) — at the standard rent-burdened threshold; future hikes will face affordability resistance.
Forward outlook
- Local home prices are declining (-3.0%/yr); year-one equity from $1k of loan paydown is wiped out by about $5k of value loss. Plan a longer hold.
- St. Lucie County population projected at +20% by 2050 — long-run rental-demand tailwind backs the buy-and-hold thesis.
Negotiation context
- It's been on market 105 days — a 9% lower offer ($141k) is reasonable based on typical stale-listing flexibility.
- 10 sale attempts since 27y ago; this cycle's ask has dropped $10k (6%) from the opening price — seller is motivated, your offer sets the floor, not the list.
- Current owner paid $120k; 29% above their basis — modest negotiation headroom, anchor on the comps not their cost.
Risks & watch-outs
- Watch-outs: HOA is 32% of rent.
- Climate carrying-cost: severe wind risk, 99% chance of damaging wind over 30y; extreme-heat days projected 7→24/yr by 2055 (HVAC capex compounding) — expect insurance premiums to compound above CPI over the hold.
Questions for the listing agent
- What do current leases actually rent for vs. the listed asking? Can we see a recent rent roll and the last 12 months of T-12 income?
- It's been on market 105 days. Have you received any prior offers? Is the seller open to a 9% concession, seller financing, or rate buy-down credit?
- What does the HOA fee cover, when was the last increase, and are there any pending special assessments or reserve-fund shortfalls?
- Any open or pending special assessments — roof, HVAC, plumbing, elevator, façade? What's the per-unit balance and payoff schedule, and is the seller paying it off at close or rolling it to the buyer?
- Why hasn't it sold? Are there any deal-killer items the seller is aware of (foundation, flood, title, zoning, code violations)?
- Is there a deadline driving the sale (1031 exchange, divorce, estate, relocation)? That informs how much negotiation room exists.
- The area grade is low — what's the realistic commute time and amenity access for the typical tenant pool here? Any planned neighborhood developments (good or bad) we should know about?
- What's the average days-on-market for RENTAL listings here right now (not sales)? A rising rental-DOM trend means longer vacancies and softer asking-rent achievability than the comps imply.
- What's the recent tenant-quality profile in this submarket — average credit score on applications, eviction rate, late-payment / NSF rate, and stable-employment percentage? A property-management company in the area should have these aggregated.
- How much new apartment / multifamily construction is in the pipeline within 1–3 miles? Heavy new supply (>2% of stock underway) typically softens rents 12–24 months out; light construction supports rent growth.
Investment metrics
- 1% rule
- 1.28% ✓
- Cap rate
- 5.75%
- Cash-on-cash
- -1.93%
- DSCR
- 0.91
- GRM
- 6.5
CMA / ARV
No comps found within radius.
Projected returns pro-forma
-3.0% appreciation · 1.92% rent growth · sell at horizon
- IRR
- -21.1%
- Equity multiple
- 0.28×
- Total profit
- $-31,310
- Equity at exit
- $23,111
- IRR
- -18.1%
- Equity multiple
- 0.08×
- Total profit
- $-40,009
- Equity at exit
- $13,402
Cash invested: $43,400 (down + closing). Projections, not guarantees.
Landlord ↔ Tenant lean methodology
- Overall (STATE)
- 87 Strongly Landlord-Friendly
- State Florida
- 87 Strongly Landlord-Friendly · R+3
- County
- — inherits STATE
- City
- — inherits STATE
ZIP-level market 34952
- Home prices YoY
- -29.6%
- Rents YoY
- 1.9%
- Active inventory
- 639
- Price-to-rent
- 6.5×
Monthly cashflow live
- Estimated rent
- $1,983 high interval (Pro) →
- Mortgage (P&I)
- −$813
- Tax from tax record
- −$116 /mo · $1,394/yr
- Insurance
- −$65
- HOA
- −$643
- Vacancy / Maint / Mgmt
- −$417
- Net cashflow
- $-70
Break-even live
UW: 25.0% down · 7.5% · 30yr · 1.5% tax · 5.0% vac · 8.0% maint · 8.0% mgmt
Financing live
Cash to close
- Down payment
- $38,750
- Closing costs
- $4,650
- Reserves months
- —
- Total cash needed
- —
Loan-product check · same deal, 3 products live
Conventional
25% down · 7.5% · 30yr
- Down + closing
- —
- Monthly P&I
- —
- Monthly cashflow
- —
- DSCR
- —
- Eligible?
- —
Personal DTI + credit; lowest rate.
DSCR
20% down · 8.5% · 30yr
- Down + closing
- —
- Monthly P&I
- —
- Monthly cashflow
- —
- DSCR
- —
- Eligible?
- —
No personal income docs; deal must DSCR.
Hard money
10% down · 12.0% · 12mo
- Down + closing
- —
- Monthly P&I
- —
- Monthly cashflow
- —
- DSCR
- —
- Eligible?
- —
Short-term bridge; refi at stabilization.
Rent comps 25 comps
| Address | Beds | Baths | Sqft | Rent | $/sqft | DOM | Units | Dist |
|---|---|---|---|---|---|---|---|---|
| 2051 SE Hillmoor Dr Port Saint Lucie, FL | 1.0–2.0 | 1.0–2.0 | 1014 | $2,539 | $2.50 | 23d | 15 | 0.32mi |
| 9905 S US Highway 1 Port Saint Lucie, FL | 1.0–2.0 | 1.0–2.0 | 966 | $2,239 | $2.32 | 13d | 15 | 0.44mi |
| 1548 SE Royal Green Cir #108 Port St Lucie, FL | 1.0 | 1.0 | 705 | $1,650 | $2.34 | 13d | 1 | 0.67mi |
| 1548 SE Royal Green Cir Unit M-103 Port St. Lucie, FL | 2.0 | 2.0 | 886 | $1,800 | $2.03 | 23d | 1 | 0.67mi |
| 1550 SE Royal Green Cir Unit P-203 Port St. Lucie, FL | 2.0 | 2.0 | 782 | $1,750 | $2.24 | 23d | 1 | 0.69mi |
| 1566 SE Royal Green Cir #203 Port St Lucie, FL | 2.0 | 2.0 | 782 | $2,000 | $2.56 | 13d | 1 | 0.75mi |
| 1536 SE Royal Green Cir #101 Port St Lucie, FL | 2.0 | 2.0 | 782 | $1,750 | $2.24 | 23d | 1 | 0.75mi |
| 1537 SE Royal Green Cir Unit E204 Port St. Lucie, FL | 2.0 | 2.0 | 886 | $1,750 | $1.98 | 13d | 1 | 0.76mi |
| 1500 SE Tiffany Club Pl Port Saint Lucie, FL | 1.0–3.0 | 1.0–2.0 | 895 | $1,922 | $2.15 | 13d | 7 | 0.81mi |
| 1565 SE Royal Green Cir #108 Port St Lucie, FL | 1.0 | 1.0 | 705 | $1,595 | $2.26 | 13d | 1 | 0.83mi |
| 1562 SE Royal Green Cir Unit T-204 Port St. Lucie, FL | 2.0 | 2.0 | 782 | $1,900 | $2.43 | 23d | 1 | 0.87mi |
| 1503 SE Royal Green Cir Unit V104 Port St. Lucie, FL | 2.0 | 2.0 | 865 | $1,750 | $2.02 | 23d | 1 | 0.88mi |
| 1550 SE Royal Green Cir Port St. Lucie, FL | 2.0 | 2.0 | 782 | $1,850 | $2.37 | 13d | 1 | 0.88mi |
| 1524 SE Royal Green Cir Unit Q102 Port St. Lucie, FL | 2.0 | 2.0 | 865 | $1,800 | $2.08 | 13d | 1 | 0.89mi |
| 1520 SE Royal Green Cir Unit K-203 Port St. Lucie, FL | 2.0 | 2.0 | 886 | $1,800 | $2.03 | 23d | 1 | 0.93mi |
| 1516 SE Royal Green Cir #202 Port St Lucie, FL | 3.0 | 2.0 | 921 | $2,100 | $2.28 | 23d | 1 | 0.97mi |
| 1456 SE Rivergreen Cir Port Saint Lucie, FL | 2.0 | 2.0 | 921 | $1,825 | $1.98 | 13d | 1 | 1.21mi |
| 2416 SE Garden Ter #203 Port St Lucie, FL | 2.0 | 2.0 | 861 | $1,700 | $1.97 | 23d | 1 | 1.22mi |
| 2444 SE Garden Ter Port St. Lucie, FL | 2.0 | 2.0 | 861 | $1,950 | $2.26 | 13d | 1 | 1.23mi |
| 1455 SE Colchester Cir Port Saint Lucie, FL | 2.0 | 2.0 | 921 | $1,795 | $1.95 | 13d | 1 | 1.24mi |
| 1350 SE La Haven Ct Port Saint Lucie, FL | 2.0 | 2.0 | 1041 | $2,100 | $2.02 | 23d | 1 | 1.27mi |
| 2289 SE Seamist St Port Saint Lucie, FL | 3.0 | 2.0 | 1008 | $2,500 | $2.48 | 23d | 1 | 1.30mi |
| 1811 SE Walton Lakes Dr Port Saint Lucie, FL | 2.0 | 1.0–2.0 | 1117 | $1,926 | $1.72 | 13d | 6 | 1.31mi |
| 1810 SE Pinewood Trl Port Saint Lucie, FL | 1.0–2.0 | 1.0–2.0 | 1013 | $2,055 | $2.03 | 13d | 7 | 1.45mi |
| 1131 SE Parrish Ct Port Saint Lucie, FL | 2.0 | 1.0 | 902 | $2,000 | $2.22 | 23d | 1 | 1.49mi |
HOA detail condo
- Monthly dues
- $643 · $7,716/yr
- Assessments
- None detected in remarks — confirm with the listing agent.
Listing history 47 events
-
2026-06-18days on market $155,000 Active 105 DOM
-
2026-06-17days on market $155,000 Active 104 DOM
-
2026-06-16days on market $155,000 Active 103 DOM
-
2026-06-15days on market $155,000 Active 102 DOM
-
2026-06-14days on market $155,000 Active 100 DOM
-
2026-06-13days on market $155,000 Active 99 DOM
-
2026-06-10days on market $155,000 Active 97 DOM
-
2026-06-09days on market $155,000 Active 96 DOM
-
2026-06-08days on market $155,000 Active 95 DOM
-
2026-06-07days on market $155,000 Active 94 DOM
-
2026-06-05days on market $155,000 Active 91 DOM
-
2026-06-03days on market $155,000 Active 90 DOM
-
2026-06-02days on market $155,000 Active 89 DOM
-
2026-06-01days on market $155,000 Active 88 DOM
-
2026-05-31days on market $155,000 Active 87 DOM
-
2026-05-30pricedays on market $155,000 Active 86 DOM
-
2026-05-13price $157,000
-
2026-04-22price $158,000
-
2026-03-29price $159,000
-
2026-03-05$165,000 Active
-
2025-09-15historical $2,250
-
2025-08-15price $2,250
-
2025-07-25$2,300
-
2025-01-02historical $2,100
-
2024-12-31$2,100
-
2024-10-03historical $2,100
-
2024-09-30$2,100
-
2024-05-04historical $2,100
-
2024-04-29$2,100
-
2024-01-29historical $2,100
-
2024-01-16price $2,100
-
2023-12-31price $2,200
-
2023-12-23$2,000
-
2023-12-19historical
-
2023-12-09
-
2023-09-11historical
-
2023-09-09
-
2019-06-26soldstatus $120,000
-
2004-02-10soldstatus $82,000
-
2004-02-05soldstatus $82,000 149-char remark
Show marketing remark (149 chars)
ALL MEASUREMENTS APPROXIMATE. CARPET LESS THEN A YR OLD DONT MISS OUT ON THIS ONE! , VERY PRIVATE SCREENED PATIO, OPEN CONCEPT , AND GREAT LOCATION !
-
2004-01-26historical 149-char remark
Show marketing remark (149 chars)
ALL MEASUREMENTS APPROXIMATE. CARPET LESS THEN A YR OLD DONT MISS OUT ON THIS ONE! , VERY PRIVATE SCREENED PATIO, OPEN CONCEPT , AND GREAT LOCATION !
-
2003-07-25$87,000 149-char remark
Show marketing remark (149 chars)
ALL MEASUREMENTS APPROXIMATE. CARPET LESS THEN A YR OLD DONT MISS OUT ON THIS ONE! , VERY PRIVATE SCREENED PATIO, OPEN CONCEPT , AND GREAT LOCATION !
-
2001-07-25soldstatus $54,000
-
2001-07-19soldstatus $54,000 169-char remark
Show marketing remark (169 chars)
LISTER VICTORIA LOYD. KEY WEST 1ST FLR CORNER. COVERED PARKING, POND, CLUBHOUSE, HEATED POOL, JACUZZI. WALK TO SHOPPING. FAMILIES OF ALL AGES. WASHER/DRYER INSIDE CONDO.
-
2000-03-13historical 169-char remark
Show marketing remark (169 chars)
LISTER VICTORIA LOYD. KEY WEST 1ST FLR CORNER. COVERED PARKING, POND, CLUBHOUSE, HEATED POOL, JACUZZI. WALK TO SHOPPING. FAMILIES OF ALL AGES. WASHER/DRYER INSIDE CONDO.
-
1999-09-13$53,000 169-char remark
Show marketing remark (169 chars)
LISTER VICTORIA LOYD. KEY WEST 1ST FLR CORNER. COVERED PARKING, POND, CLUBHOUSE, HEATED POOL, JACUZZI. WALK TO SHOPPING. FAMILIES OF ALL AGES. WASHER/DRYER INSIDE CONDO.
-
1989-04-13soldstatus $54,000
ⓘ Source: listings_history table (triggers on properties + properties_extension) + one-shot
backfill from property_details.listing_events for pre-trigger history.
Tax reassessment forecast FL · Resets to sale price
- Current annual tax
- $1,394 · $116/mo
- Projected year-2 tax
- $1,394 · $116/mo
- Expected delta
- $0/yr ($0/mo · 0.0%)
ⓘ Screening estimate from a state-policy table — verify with the county assessor before closing.
Climate risk First Street
- Flood 3/10 Moderate FEMA zone X (unshaded) · 20% chance over 30 yrs
- Wildfire 3/10 Moderate
- Heat 10/10 Extreme 7 d/yr ≥106°F today · 24 d/yr by 30 yrs out
- Wind 10/10 Extreme 99% chance of damaging wind over 30 yrs
- Air quality 2/10 Low 1 unhealthy d/yr today · 1 by 30 yrs out
Nearby sold comps map
Loading sold comps map…
Walkable amenities ~0.75 mi
Loading nearby amenities…
Taxation est. · year 1
- Rental income
- $23,801
- − Mortgage interest
- −$8,682
- − Property taxes
- −$1,394
- − Insurance
- −$775
- − Repairs & maintenance
- −$1,904
- − Management
- −$1,904
- − HOA
- −$7,716
- − Depreciation
- −$4,509
- Taxable loss
- −$3,084
- Est. tax savings @ 24.0%
- +$740
- After-tax cash flow
- $-96/yr
For passive investors: Depreciation is non-cash, so a rental often shows a tax loss while cash-flowing — sheltering income. Rental losses are passive: they offset passive income freely, and up to $25,000/yr can offset ordinary (W-2) income if you actively participate and your MAGI is under $100k (phasing out to $0 by $150k); unused losses carry forward. On sale, claimed depreciation is recaptured at up to 25%, and gains may owe capital-gains tax (a 1031 exchange can defer both). Figures are a year-1 estimate at your 24.0% rate — not tax advice; consult a CPA.
Schools (NCES district)
- District
- St. Lucie
- NCES district ID
- 1201770
- Math proficiency
- 40% ▼ -11.00%
- Reading proficiency
- 48% ▼ -4.00%
- Median HH income
- $44,737
- Composite
- 37.28/100
- National rank
- #4449
- State rank
- #51 of 73 in FL
Livability — Port St. Lucie
No livability data for this city. (Only ~50 U.S. cities are tracked.)
Census & demographics
- Census place
- Port St. Lucie, FL
- County
- Saint Lucie County · 337,150 people
- City population
- 221,051
- Metro
- Port St. Lucie, FL
- Population (ZIP)
- 42,655
- Household income
- $61,628
- Rent vs Own
- Severe rent burden
- 1759.0
Population outlook (St. Lucie County) Hauer SSP2
- Today (2025)
- 338,016 people
- By 2030
- 355,687 · +5.2%
- By 2040
- 385,521 · +14.1%
- By 2050
- 406,106 · +20.1%
- By 2075
- 441,054 · +30.5%
- By 2100
- 436,885 · +29.2%
Race, ethnicity, and origin ACS 2023
- Neighborhood character
- Diverse neighborhood (Simpson 0.57)
- Race & ethnicity
- White 62% Hispanic / Latino 19% Two or more races 14% Black 10% Asian 3%
- Hispanic origin (detail)
- Mexican 4% Puerto Rican 4% Cuban 2% Dominican 2%
- Common ancestry
- Romanian 3% Lithuanian 2% Hispanic 1%
- Foreign-born
- 18% · Canada, Jamaica, China
- Languages at home
- 76% English-only · Spanish 16% French/Haitian/Cajun 3% Tagalog/Filipino 2%
Political lean MEDSL · St. Lucie
- 2024 margin
- Lean R (+9.1) · D 45.1% · R 54.2%
- 2008→2024 swing
- -21.2pp toward R · 2008: 12.1pp · 2024: -9.1pp
- All cycles
- 2024: R+9.1 2020: R+1.6 2016: R+2.5 2012: D+7.9 2008: D+12.1
Not yet ingested
- Civics
- —
Market trends
- HPI YoY
- ▼ -155.80%
- Current HPI
- 371.0573
- Rent YoY
- ▲ 1.92%
- Metro
- Port St. Lucie, FL
- State GDP YoY
- ▲ 3.28%
- F500 in state
- 36
Industry mix (Fortune 500 HQ in FL)
| Industry | F500 HQs | Revenue |
|---|---|---|
| Industrial Technology | 2 | $29B |
|
||
| Insurance | 2 | $17B |
|
||
| Retail | 1 | $60B |
|
||
| Technology Distribution | 1 | $58B |
|
||
| Homebuilding | 1 | $35B |
|
||
| Technology Manufacturing | 1 | $35B |
|
||
Price history
+190.7% since first listed31 events — show timeline
- 2026-05-13 Price Changed $157,000 MARMLS
- 2026-04-22 Price Changed $158,000 MARMLS
- 2026-03-29 Price Changed $159,000 MARMLS
- 2026-03-05 Listed $165,000 MARMLS
- 2025-09-15 Rental Removed $2,250 MARMLS
- 2025-08-15 Price Changed $2,250 MARMLS
- 2025-07-25 Listed for Rent $2,300 MARMLS
- 2025-01-02 Rental Removed $2,100 MARMLS
- 2024-12-31 Listed for Rent $2,100 MARMLS
- 2024-10-03 Rental Removed $2,100 MARMLS
- 2024-09-30 Listed for Rent $2,100 MARMLS
- 2024-05-04 Rental Removed $2,100 MARMLS
- 2024-04-29 Listed for Rent $2,100 MARMLS
- 2024-01-29 Rental Removed $2,100 MARMLS
- 2024-01-16 Price Changed $2,100 MARMLS
- 2023-12-31 Price Changed $2,200 MARMLS
- 2023-12-23 Listed for Rent $2,000 MARMLS
- 2023-12-19 Rental Removed — MARMLS
- 2023-12-09 Listed for Rent — MARMLS
- 2023-09-11 Rental Removed — MARMLS
- 2023-09-09 Listed for Rent — MARMLS
- 2019-06-26 Sold (Public Records) $120,000 Public Records
- 2004-02-10 Sold (Public Records) $82,000 Public Records
- 2004-02-05 Sold (MLS) $82,000 Beaches MLS
- 2004-01-26 Listing Removed — Beaches MLS
- 2003-07-25 Listed $87,000 Beaches MLS
- 2001-07-25 Sold (Public Records) $54,000 Public Records
- 2001-07-19 Sold (MLS) $54,000 Beaches MLS
- 2000-03-13 Listing Removed — Beaches MLS
- 1999-09-13 Listed $53,000 Beaches MLS
- 1989-04-13 Sold (Public Records) $54,000 Public Records
Property tax history
+11.0%/yrLatest (2025): $1,394 · +4.1% YoY. Source: county tax records.
Cash-flow waterfall
monthlySold comps — $/sqft
last 12 mo · ≤1 miLoading sold comps…