 🏗️ New Construction
Durango Plan · Ashland, NE
Flood risk 1/10 · Minimal
- FEMA flood zone
- X (unshaded)
- Chance of flooding over 30 yrs
- 0.0%
- Est. flood insurance / yr
- $507 – $1,088
Fire risk 3/10 · Minor
- Est. fire insurance / yr
- $1,161 – $2,155
Heat risk 3/10 · Minor
- Hot days now (above 104°F)
- 7 days/yr
- Hot days in 30 yrs
- 16 days/yr
Wind risk 2/10 · Minimal
- Chance of severe wind over 30 yrs
- —
Air-quality risk 1/10 · Minimal
- Unhealthy air days now
- 0 days/yr
- Unhealthy air days in 30 yrs
- 0 days/yr
Risk factors via First Street. Map © Google.
Why this score? — see what drove the F grade
The composite is a weighted blend of 9 inputs, each scored 0–100. Each bar is that input's sub-score; the figure is the points it added to the 100-point composite (weight × sub-score).
- ARV discount +7.5/15.0
- Appreciation +5.1/10.0
- Schools +4.6/10.0
- Livability +4.2/5.0
- Rent growth +2.5/5.0
- Condition / age +2.5/5.0
- Cash flow +2.3/30.0
- 1% rule +0.0/10.0
- DSCR +0.0/10.0
$295,600
🖨 Deal sheet 📄 Offer letter ✓ Due diligence
Listing remarks MLS
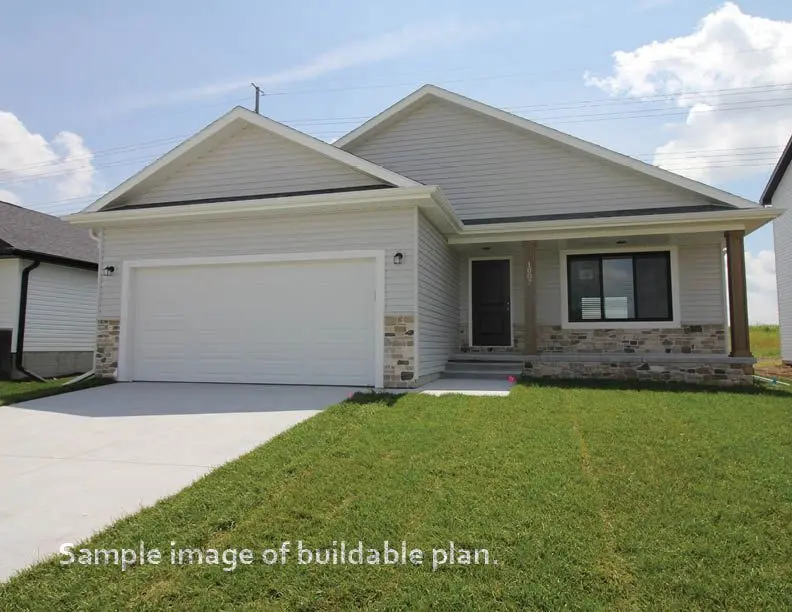
This home is not built and is a sample of an available plan in this neighborhood. Lot not included in price. The Remington Homes Durango plan is a three-bedroom, two-bathroom ranch plan with 1,417 square-feet. It features an oversized kitchen island and walk-in pantry. Vaulted ceilings in the kitchen, dining, living room, and master bathroom make these spaces feel even more grand. A large covered patio is a great addition for outdoor gatherings.
Key facts
- Large covered patio
- Vaulted ceilings
- Walk-in pantry
Tags
Neighborhood map
What this means for you Summary
Snapshot
- This is a 3-bed/2.0-bath single-family listed at $296k.
Deal economics
- At list price, monthly cash flow is $-1k ($-18k/yr) — negative.
- To cash-flow at today's rent, offer at most $206k (30.4% below list).
- To meet the 1% rule (rent ≥ 1% of price), the offer needs to be $180k (39.1% below list).
- Recommended offer: $180k (39.1% below list) — sets the bar for 1% rule.
Location & tenants
- Location reads 84/100 on livability (#8 in NE, #712 nationally) — a professional / high-income tenant draw. Strengths: crime A+, cost of living A+, housing A+; Watch: amenities D+, commute F.
- Ashland-Greenwood Public Schools (town): math 51% / reading 54% proficiency, ranked #50 of 111 in NE (top 45%) — acceptable for families but not a draw, mixed tenant base, ~2y average lease.
- Market conditions: 152 active listings in the ZIP; 3 comparable units currently listed for rent nearby; rentals leasing fast (median 11d on market — plan ~1-2 weeks tenant-placement turnaround); 138 units permitted in Saunders County in 2024 (0 in 5+ unit buildings).
Forward outlook
- In year one you build about $3k of equity ($3k loan paydown + $564 appreciation (0.1% local appreciation)).
- Saunders County population projected to shrink 6% by 2050 — rents likely to lag national; underwrite the cash flow, not the appreciation.
- By year 8, paydown + projected appreciation supports a ~$34k cash-out refi (75% LTV) — recoverable capital for the next deal without selling this one.
Negotiation context
- It's been on market 390 days — a 12% lower offer ($260k) is reasonable based on typical stale-listing flexibility.
Questions for the listing agent
- What do current leases actually rent for vs. the listed asking? Can we see a recent rent roll and the last 12 months of T-12 income?
- It's been on market 390 days. Have you received any prior offers? Is the seller open to a 39% concession, seller financing, or rate buy-down credit?
- Why hasn't it sold? Are there any deal-killer items the seller is aware of (foundation, flood, title, zoning, code violations)?
- Is there a deadline driving the sale (1031 exchange, divorce, estate, relocation)? That informs how much negotiation room exists.
- Schools are B-rated — typically a magnet for longer-tenancy family renters. What's the average tenant stay here, and is there a school-zone premium baked into asking?
- The area grade is low — what's the realistic commute time and amenity access for the typical tenant pool here? Any planned neighborhood developments (good or bad) we should know about?
- What's the average days-on-market for RENTAL listings here right now (not sales)? A rising rental-DOM trend means longer vacancies and softer asking-rent achievability than the comps imply.
- What's the recent tenant-quality profile in this submarket — average credit score on applications, eviction rate, late-payment / NSF rate, and stable-employment percentage? A property-management company in the area should have these aggregated.
- How much new for-sale + rental construction is in the pipeline within 1–3 miles? Heavy new supply typically softens prices + rents 12–24 months out; constrained supply supports both.
Investment metrics
- 1% rule
- 0.43% ✗
- Cap rate
- 2.05%
- Cash-on-cash
- -15.14%
- DSCR
- 0.33
- GRM
- 19.5
CMA / ARV
- ARV (median comp)
- $420,800
- List price
- $295,600
- Delta
- -29.75%
- Verdict
- UNDERPRICED
- Comps
- 11 within 1.0 mi
Show comp detail 4 sales within ~0.75 mi
| Address | Dist | Beds/Ba | Sqft | Sold | Price | $/sf | Match |
|---|---|---|---|---|---|---|---|
| 1249 S 9th Ave | 0.05mi | 3/2.5 | 1,417 (0%) | 8mo | $378,545 | $267 | 89 |
| 1029 S 9th Ave | 0.15mi | 3/2.5 | 1,493 (+5%) | 2mo | $420,800 | $282 | 80 |
| 1017 S 9th Ave | 0.16mi | 3/2.0 | 1,537 (+8%) | 1mo | $422,525 | $275 | 77 |
| 1452 S 9th Ave | 0.16mi | 3/2.5 | 1,537 (+8%) | 7mo | $426,425 | $277 | 71 |
Match score weights: distance 35% · size 25% · config 20% · recency 20%. Top-matched comps best support the ARV.
Projected returns pro-forma
0.13% appreciation · 3.0% rent growth · sell at horizon
- IRR
- -19.0%
- Equity multiple
- 0.11×
- Total profit
- $-104,323
- Equity at exit
- $125,014
- IRR
- -12.3%
- Equity multiple
- -0.31×
- Total profit
- $-154,448
- Equity at exit
- $152,548
Cash invested: $117,824 (down + closing). Projections, not guarantees.
Landlord ↔ Tenant lean methodology
- Overall (STATE)
- 83 Strongly Landlord-Friendly
- State Nebraska
- 83 Strongly Landlord-Friendly · R+13
- County
- — inherits STATE
- City
- — inherits STATE
ZIP-level market 68003
- Home prices YoY
- 0.1%
- Active inventory
- 152
- Price-to-rent
- 13.7×
Monthly cashflow live
- Estimated rent
- $1,799 medium interval (Pro) →
- Mortgage (P&I)
- −$2,207
- Tax est. 1.5%
- −$526 /mo · $6,312/yr
- Insurance
- −$175
- HOA
- −$0
- Vacancy / Maint / Mgmt
- −$378
- Net cashflow
- $-1,487
Break-even live
UW: 25.0% down · 7.5% · 30yr · 1.5% tax · 5.0% vac · 8.0% maint · 8.0% mgmt
Financing live
Cash to close
- Down payment
- $105,200
- Closing costs
- $12,624
- Reserves months
- —
- Total cash needed
- —
Loan-product check · same deal, 3 products live
Conventional
25% down · 7.5% · 30yr
- Down + closing
- —
- Monthly P&I
- —
- Monthly cashflow
- —
- DSCR
- —
- Eligible?
- —
Personal DTI + credit; lowest rate.
DSCR
20% down · 8.5% · 30yr
- Down + closing
- —
- Monthly P&I
- —
- Monthly cashflow
- —
- DSCR
- —
- Eligible?
- —
No personal income docs; deal must DSCR.
Hard money
10% down · 12.0% · 12mo
- Down + closing
- —
- Monthly P&I
- —
- Monthly cashflow
- —
- DSCR
- —
- Eligible?
- —
Short-term bridge; refi at stabilization.
Rent comps 3 comps
| Address | Beds | Baths | Sqft | Rent | $/sqft | DOM | Units | Dist |
|---|---|---|---|---|---|---|---|---|
| 2724 Silver St Unit 101 Ashland, NE | 2.0 | 2.0 | 1299 | $1,850 | $1.42 | 1d | 1 | 1.47mi |
| 2724 Silver St Unit 204 Ashland, NE | 2.0 | 2.0 | 1152 | $1,730 | $1.50 | 43d | 1 | 1.47mi |
| 2724 Silver St Unit 206 Ashland, NE | 2.0 | 2.0 | 1204 | $1,810 | $1.50 | 10d | 1 | 1.47mi |
Listing history 16 events
-
2026-06-18days on market $295,600 Active 390 DOM
-
2026-06-17days on market $295,600 Active 389 DOM
-
2026-06-16days on market $295,600 Active 388 DOM
-
2026-06-15days on market $295,600 Active 387 DOM
-
2026-06-13days on market $295,600 Active 385 DOM
-
2026-06-10days on market $295,600 Active 382 DOM
-
2026-06-09days on market $295,600 Active 381 DOM
-
2026-06-08days on market $295,600 Active 380 DOM
-
2026-06-07days on market $295,600 Active 379 DOM
-
2026-06-05days on market $295,600 Active 376 DOM
-
2026-06-03days on market $295,600 Active 375 DOM
-
2026-06-03days on market $295,600 Active 374 DOM
-
2026-06-01days on market $295,600 Active 373 DOM
-
2026-05-31days on market $295,600 Active 372 DOM
-
2026-03-11price $295,600 449-char remark
Show marketing remark (449 chars)
This home is not built and is a sample of an available plan in this neighborhood. Lot not included in price. The Remington Homes Durango plan is a three-bedroom, two-bathroom ranch plan with 1,417 square-feet. It features an oversized kitchen island and walk-in pantry. Vaulted ceilings in the kitchen, dining, living room, and master bathroom make these spaces feel even more grand. A large covered patio is a great addition for outdoor gatherings.
-
2025-05-24$284,700 Active 449-char remark
Show marketing remark (449 chars)
This home is not built and is a sample of an available plan in this neighborhood. Lot not included in price. The Remington Homes Durango plan is a three-bedroom, two-bathroom ranch plan with 1,417 square-feet. It features an oversized kitchen island and walk-in pantry. Vaulted ceilings in the kitchen, dining, living room, and master bathroom make these spaces feel even more grand. A large covered patio is a great addition for outdoor gatherings.
ⓘ Source: listings_history table (triggers on properties + properties_extension) + one-shot
backfill from property_details.listing_events for pre-trigger history.
Climate risk First Street
- Flood 1/10 Low FEMA zone X (unshaded) · 0% chance over 30 yrs
- Wildfire 3/10 Moderate
- Heat 3/10 Moderate 7 d/yr ≥104°F today · 16 d/yr by 30 yrs out
- Wind 2/10 Low
- Air quality 1/10 Low 0 unhealthy d/yr today · 0 by 30 yrs out
Nearby sold comps map
Loading sold comps map…
Walkable amenities ~0.75 mi
Loading nearby amenities…
Taxation est. · year 1
- Rental income
- $21,588
- − Mortgage interest
- −$23,571
- − Property taxes
- −$6,312
- − Insurance
- −$2,104
- − Repairs & maintenance
- −$1,727
- − Management
- −$1,727
- − Depreciation
- −$12,241
- Taxable loss
- −$26,095
- Est. tax savings @ 24.0%
- +$6,263
- After-tax cash flow
- $-11,579/yr
For passive investors: Depreciation is non-cash, so a rental often shows a tax loss while cash-flowing — sheltering income. Rental losses are passive: they offset passive income freely, and up to $25,000/yr can offset ordinary (W-2) income if you actively participate and your MAGI is under $100k (phasing out to $0 by $150k); unused losses carry forward. On sale, claimed depreciation is recaptured at up to 25%, and gains may owe capital-gains tax (a 1031 exchange can defer both). Figures are a year-1 estimate at your 24.0% rate — not tax advice; consult a CPA.
Schools (NCES district)
- District
- Ashland-Greenwood Public Schools
- NCES district ID
- 3100034
- Math proficiency
- 51% ▼ -8.00%
- Reading proficiency
- 54% ▼ -6.00%
- Median HH income
- $59,116
- Composite
- 45.72/100
- National rank
- #2573
- State rank
- #50 of 111 in NE
Livability — Ashland
- Score
- 84/100
- State rank
- #8
- US rank
- #712
Category grades
Schools grade is shown separately in the Schools card above.
Census & demographics
- Population (ZIP)
- 4,953
Population outlook (Saunders County) Hauer SSP2
- Today (2025)
- 21,261 people
- By 2030
- 21,249 · -0.1%
- By 2040
- 20,927 · -1.6%
- By 2050
- 20,041 · -5.7%
- By 2075
- 18,386 · -13.5%
- By 2100
- 15,066 · -29.1%
Race, ethnicity, and origin ACS 2023
- Neighborhood character
- Predominantly White (93%)
- Race & ethnicity
- White 93% Two or more races 4% Hispanic / Latino 3%
- Common ancestry
- Romanian 4% Italian 3% Lithuanian 3%
- Foreign-born
- 2% · Canada, Vietnam
- Languages at home
- 97% English-only · Other Asian/Pacific 1% Spanish 1% Vietnamese 1%
Political lean MEDSL · Saunders
- 2024 margin
- Solid R (+46.4) · D 26.2% · R 72.6% · Other 1.1%
- 2008→2024 swing
- -22.7pp toward R · 2008: -23.7pp · 2024: -46.4pp
- All cycles
- 2024: R+46.4 2020: R+45.2 2016: R+47.0 2012: R+33.8 2008: R+23.7
Not yet ingested
- Civics
- —
Market trends
- HPI YoY
- ▲ 0.13%
- Current HPI
- 293.1932
- Rent YoY
- —
- Metro
- —
- State GDP YoY
- ▲ 0.68%
- F500 in state
- 2
Industry mix (Fortune 500 HQ in NE)
| Industry | F500 HQs | Revenue |
|---|---|---|
| Conglomerate | 1 | $371B |
|
||
Price history
+3.8% since first listed2 events — show timeline
- 2026-03-11 Price Changed $295,600 Zillow
- 2025-05-24 Listed $284,700 Zillow
Cash-flow waterfall
monthlySold comps — $/sqft
last 12 mo · ≤1 miLoading sold comps…