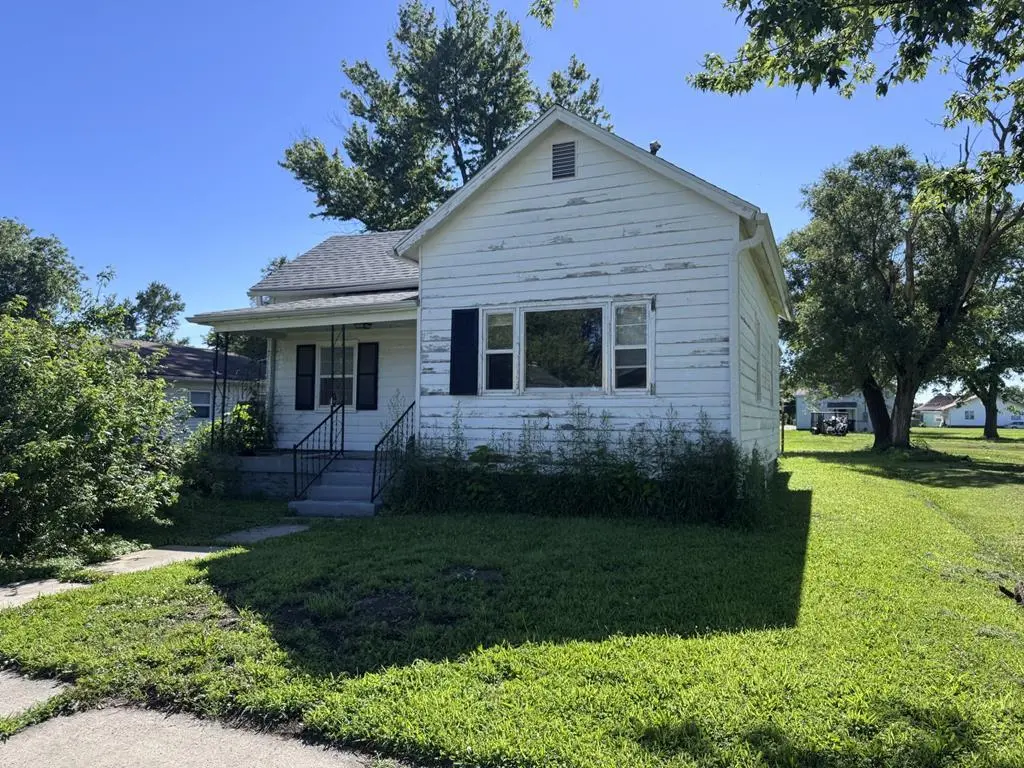
537 Hagood St · Moberly, MO
Flood risk 1/10 · Minimal
- FEMA flood zone
- X (unshaded)
- Chance of flooding over 30 yrs
- 0.0%
- Est. flood insurance / yr
- $507 – $1,088
Fire risk 4/10 · Minor
- Est. fire insurance / yr
- $1,054 – $1,958
Heat risk 4/10 · Minor
- Hot days now (above 106°F)
- 7 days/yr
- Hot days in 30 yrs
- 17 days/yr
Wind risk 2/10 · Minimal
- Chance of severe wind over 30 yrs
- —
Air-quality risk 1/10 · Minimal
- Unhealthy air days now
- 0 days/yr
- Unhealthy air days in 30 yrs
- 0 days/yr
Risk factors via First Street. Map © Google.
Why this score? — see what drove the B- grade
The composite is a weighted blend of 9 inputs, each scored 0–100. Each bar is that input's sub-score; the figure is the points it added to the 100-point composite (weight × sub-score).
- Cash flow +30.0/30.0
- 1% rule +10.0/10.0
- DSCR +10.0/10.0
- ARV discount +7.5/15.0
- Livability +3.9/5.0
- Schools +2.7/10.0
- Rent growth +2.5/5.0
- Condition / age +2.5/5.0
- Appreciation +0.0/10.0
$42,500
🖨 Deal sheet 📄 Offer letter ✓ Due diligence
Listing remarks MLS
With good bones and plenty of potential, this property would make a great fix-and-flip opportunity or an addition to your rental portfolio. Being sold AS-IS condition, much of the demolition work has been completed. Vacant approximately 6 years (but heated during the winter months). Covered front porch & covered back deck. Lots of building supplies will stay: kitchen cabinets, doors, bathroom vanity & dishwasher. The home has one gas wall heater located in the center of the house & one window A/C unit. The roof and gutters are approximately 5 years old, and the property is serviced by a fuse box. Nice deep lot with all in back.
Key facts
- Covered front porch
- Covered back deck
- Window a/c unit
Tags
Property features AI
Exterior
- Utilities: Public water; Public sewer; Natural gas available
- Home design: Single-family residence; Residential property
- Construction: Frame construction; Composition roof; Crawl space basement
- Exterior features: Deck
Interior
- Kitchen: Dishwasher
- Bathrooms: 1 full bathroom
- Heating & cooling: Ceiling fan(s); Window unit(s)
- Interior features: Dishwasher; Ceiling fan(s); Window unit(s) cooling
Neighborhood map
What this means for you Summary
Snapshot
- This is a 2-bed/1.0-bath single-family listed at $42k.
Deal economics
- At list price, monthly cash flow is $681 ($8k/yr) — positive.
- The deal already cash-flows at list — no discount required.
- Meets the 1% rule at list price ($1k rent vs $42k).
- Cap rate 25.5% vs local median 4.5% in Moberly — top-decile yield for the area; either an underpriced asset or a hidden risk that comps aren't pricing in. Stress-test before assuming the spread holds.
Location & tenants
- Location reads 77/100 on livability (#32 in MO, #3,045 nationally) — a middle-class / working-renter tenant base. Strengths: cost of living A+, housing A+, health & safety A+; Watch: employment D, schools D-, amenities F.
- Moberly (town): math 30% / reading 36% proficiency, ranked #246 of 324 in MO (top 76%) — families likely to look elsewhere, expect single-tenant / working-renter base with shorter leases.
- Market conditions: 134 active listings in the ZIP; 25 units permitted in Randolph County in 2024 (0 in 5+ unit buildings).
Forward outlook
- Local home prices are declining (-3.0%/yr); year-one equity from $294 of loan paydown is wiped out by about $1k of value loss. Plan a longer hold.
- Randolph County population projected at -10% by 2050 — secular population decline; favor cash flow + early exit over multi-decade hold.
- At projected returns (-3.0% appreciation + 3.0% rent growth), your $12k cash investment doubles in ~2 years — after that, you're playing with house money.
Negotiation context
- Only 1 days on market — expect competitive offers; lowballing is unlikely to land.
- 2 sale attempts with the ask held roughly flat each time — persistent listings suggest the price (not the market) is what's stuck; bring a comps-based counter.
- Current owner paid $8k; list at $42k implies a 467% gain — meaningful room to come down on a strong offer.
Risks & watch-outs
- Watch-outs: built in 1925 — expect roof / HVAC / electrical / plumbing capex.
Questions for the listing agent
- Built in 1925 — when were the roof, HVAC, electrical panel, plumbing, and water heater last replaced?
- Is there a deadline driving the sale (1031 exchange, divorce, estate, relocation)? That informs how much negotiation room exists.
- Schools are D-rated, which usually means shorter tenancies and higher turnover. Who's the typical renter profile here, and what's been the actual vacancy rate?
- What's the average days-on-market for RENTAL listings here right now (not sales)? A rising rental-DOM trend means longer vacancies and softer asking-rent achievability than the comps imply.
- What's the recent tenant-quality profile in this submarket — average credit score on applications, eviction rate, late-payment / NSF rate, and stable-employment percentage? A property-management company in the area should have these aggregated.
- How much new for-sale + rental construction is in the pipeline within 1–3 miles? Heavy new supply typically softens prices + rents 12–24 months out; constrained supply supports both.
Investment metrics
- 1% rule
- 2.82% ✓
- Cap rate
- 25.53%
- Cash-on-cash
- 68.70%
- DSCR
- 4.06
- GRM
- 3.0
CMA / ARV
- ARV (on-the-fly)
- $106,516
- Comps found
- 12
Show comp detail 12 sales within ~0.75 mi
| Address | Dist | Beds/Ba | Sqft | Sold | Price | $/sf | Match |
|---|---|---|---|---|---|---|---|
| 1412 Buchanan St | 0.67mi | 2/1.0 | 864 (+1%) | 2mo | $92,500 | $107 | 66 |
| 883 W Coates St | 0.35mi | 2/1.0 | 836 (-3%) | 21mo | $42,500 | $51 | 62 |
| 1007 Myra St | 0.29mi | 2/1.0 | 950 (+11%) | 11mo | $145,000 | $153 | 60 |
| 126 Bedford St | 0.47mi | 2/1.0 | 924 (+8%) | 11mo | $115,000 | $124 | 56 |
| 1100 Quinn St | 0.44mi | 2/1.0 | 928 (+8%) | 13mo | $45,000 | $48 | 56 |
| 1029 Concannon St | 0.33mi | 3/2.0 (+1) | 960 (+12%) | 2mo | $165,000 | $172 | 55 |
| 1123 Concannon St | 0.40mi | 3/1.0 (+1) | 968 (+13%) | 1mo | $148,000 | $153 | 55 |
| 218 S Ault St | 0.74mi | 2/1.0 | 858 (-0%) | 16mo | $110,000 | $128 | 52 |
| 319 S 6th St | 0.55mi | 2/1.0 | 966 (+12%) | 7mo | $89,900 | $93 | 48 |
| 119 Hinkley St | 0.59mi | 3/1.0 (+1) | 810 (-6%) | 17mo | $69,500 | $86 | 44 |
| 401 Fulton Ave | 0.74mi | 3/1.0 (+1) | 974 (+13%) | 2mo | $169,900 | $174 | 36 |
| 209 Jefferson Ave | 0.72mi | 2/1.0 | 748 (-13%) | 13mo | $25,000 | $33 | 34 |
Match score weights: distance 35% · size 25% · config 20% · recency 20%. Top-matched comps best support the ARV.
Projected returns pro-forma
-3.0% appreciation · 3.0% rent growth · sell at horizon
- IRR
- 68.1%
- Equity multiple
- 4.07×
- Total profit
- $36,502
- Equity at exit
- $6,337
- IRR
- 72.3%
- Equity multiple
- 8.37×
- Total profit
- $87,655
- Equity at exit
- $3,675
Cash invested: $11,900 (down + closing). Projections, not guarantees.
Landlord ↔ Tenant lean methodology
- Overall (STATE)
- 81 Strongly Landlord-Friendly
- State Missouri
- 81 Strongly Landlord-Friendly · R+10
- County
- — inherits STATE
- City
- — inherits STATE
ZIP-level market 65270
- Home prices YoY
- -30.6%
- Active inventory
- 134
- Price-to-rent
- 3.0×
Monthly cashflow live
- Estimated rent
- $1,197 medium interval (Pro) →
- Mortgage (P&I)
- −$223
- Tax from tax record
- −$24 /mo · $287/yr
- Insurance
- −$18
- HOA
- −$0
- Vacancy / Maint / Mgmt
- −$251
- Net cashflow
- $681
Break-even live
UW: 25.0% down · 7.5% · 30yr · 1.5% tax · 5.0% vac · 8.0% maint · 8.0% mgmt
Financing live
Cash to close
- Down payment
- $10,625
- Closing costs
- $1,275
- Reserves months
- —
- Total cash needed
- —
Loan-product check · same deal, 3 products live
Conventional
25% down · 7.5% · 30yr
- Down + closing
- —
- Monthly P&I
- —
- Monthly cashflow
- —
- DSCR
- —
- Eligible?
- —
Personal DTI + credit; lowest rate.
DSCR
20% down · 8.5% · 30yr
- Down + closing
- —
- Monthly P&I
- —
- Monthly cashflow
- —
- DSCR
- —
- Eligible?
- —
No personal income docs; deal must DSCR.
Hard money
10% down · 12.0% · 12mo
- Down + closing
- —
- Monthly P&I
- —
- Monthly cashflow
- —
- DSCR
- —
- Eligible?
- —
Short-term bridge; refi at stabilization.
Listing history 6 events
-
2026-06-17remarks 643-char remark
-
2026-06-17days on market $42,500 Active 1 DOM
-
2026-06-16days on market $42,500 Active 4 DOM
-
2026-06-15days on market $42,500 Active 3 DOM
-
2026-06-13remarks 641-char remark
-
2026-06-13$42,500 Active 1 DOM
ⓘ Source: listings_history table (triggers on properties + properties_extension) + one-shot
backfill from property_details.listing_events for pre-trigger history.
Tax reassessment forecast MO · Resets to sale price
- Current annual tax
- $287 · $24/mo
- Projected year-2 tax
- $412 · $34/mo
- Expected delta
- +$126/yr (+$10/mo · 43.8%)
ⓘ Screening estimate from a state-policy table — verify with the county assessor before closing.
Climate risk First Street
- Flood 1/10 Low FEMA zone X (unshaded) · 0% chance over 30 yrs
- Wildfire 4/10 Moderate
- Heat 4/10 Moderate 7 d/yr ≥106°F today · 17 d/yr by 30 yrs out
- Wind 2/10 Low
- Air quality 1/10 Low 0 unhealthy d/yr today · 0 by 30 yrs out
Nearby sold comps map
Loading sold comps map…
Walkable amenities ~0.75 mi
Loading nearby amenities…
Taxation est. · year 1
- Rental income
- $14,365
- − Mortgage interest
- −$2,381
- − Property taxes
- −$287
- − Insurance
- −$212
- − Repairs & maintenance
- −$1,149
- − Management
- −$1,149
- − Depreciation
- −$1,236
- Taxable income
- $7,951
- Est. tax owed @ 24.0%
- −$1,908
- After-tax cash flow
- $6,267/yr
For passive investors: Depreciation is non-cash, so a rental often shows a tax loss while cash-flowing — sheltering income. Rental losses are passive: they offset passive income freely, and up to $25,000/yr can offset ordinary (W-2) income if you actively participate and your MAGI is under $100k (phasing out to $0 by $150k); unused losses carry forward. On sale, claimed depreciation is recaptured at up to 25%, and gains may owe capital-gains tax (a 1031 exchange can defer both). Figures are a year-1 estimate at your 24.0% rate — not tax advice; consult a CPA.
Schools (NCES district)
- District
- Moberly
- NCES district ID
- 2921100
- Math proficiency
- 30% ▼ -1.00%
- Reading proficiency
- 36% ▼ -3.00%
- Median HH income
- $36,160
- Composite
- 27.35/100
- National rank
- #6984
- State rank
- #246 of 324 in MO
Livability — Moberly
- Score
- 77/100
- State rank
- #32
- US rank
- #3045
Category grades
Schools grade is shown separately in the Schools card above.
Census & demographics
- Census place
- Moberly, MO
- Population (ZIP)
- 16,762
Population outlook (Randolph County) Hauer SSP2
- Today (2025)
- 24,596 people
- By 2030
- 24,213 · -1.6%
- By 2040
- 23,184 · -5.7%
- By 2050
- 22,081 · -10.2%
- By 2075
- 18,994 · -22.8%
- By 2100
- 15,070 · -38.7%
Race, ethnicity, and origin ACS 2023
- Neighborhood character
- Predominantly White (84%)
- Race & ethnicity
- White 84% Black 7% Two or more races 6% Hispanic / Latino 3%
- Common ancestry
- Italian 2% Lithuanian 2% Iranian 1%
- Foreign-born
- 1% · Canada
- Languages at home
- 98% English-only · Spanish 1%
Political lean MEDSL · Randolph
- 2024 margin
- Solid R (+52.2) · D 23.3% · R 75.5% · Other 1.2%
- 2008→2024 swing
- -28.9pp toward R · 2008: -23.3pp · 2024: -52.2pp
- All cycles
- 2024: R+52.2 2020: R+51.5 2016: R+50.9 2012: R+36.6 2008: R+23.3
Not yet ingested
- Civics
- —
Market trends
- HPI YoY
- ▼ -88.15%
- Current HPI
- 199.9743
- Rent YoY
- —
- Metro
- —
- State GDP YoY
- ▲ 1.84%
- F500 in state
- 20
Industry mix (Fortune 500 HQ in MO)
| Industry | F500 HQs | Revenue |
|---|---|---|
| Healthcare | 1 | $163B |
|
||
| Insurance | 1 | $21B |
|
||
| Industrial Technology | 1 | $17B |
|
||
| Retail | 1 | $16B |
|
||
| Industrial Distribution | 1 | $10B |
|
||
| Utilities | 1 | $9B |
|
||
Price history
+466.7% since first listed3 events — show timeline
- 2026-06-12 Listed $42,500 RCBR
- 2026-06-12 Listed $42,500 NECAR
- 1992-10-07 Sold (Public Records) $7,500 Public Records
Property tax history
+2.5%/yrLatest (2025): $287 · +12.2% YoY. Source: county tax records.
Cash-flow waterfall
monthlySold comps — $/sqft
last 12 mo · ≤1 miLoading sold comps…