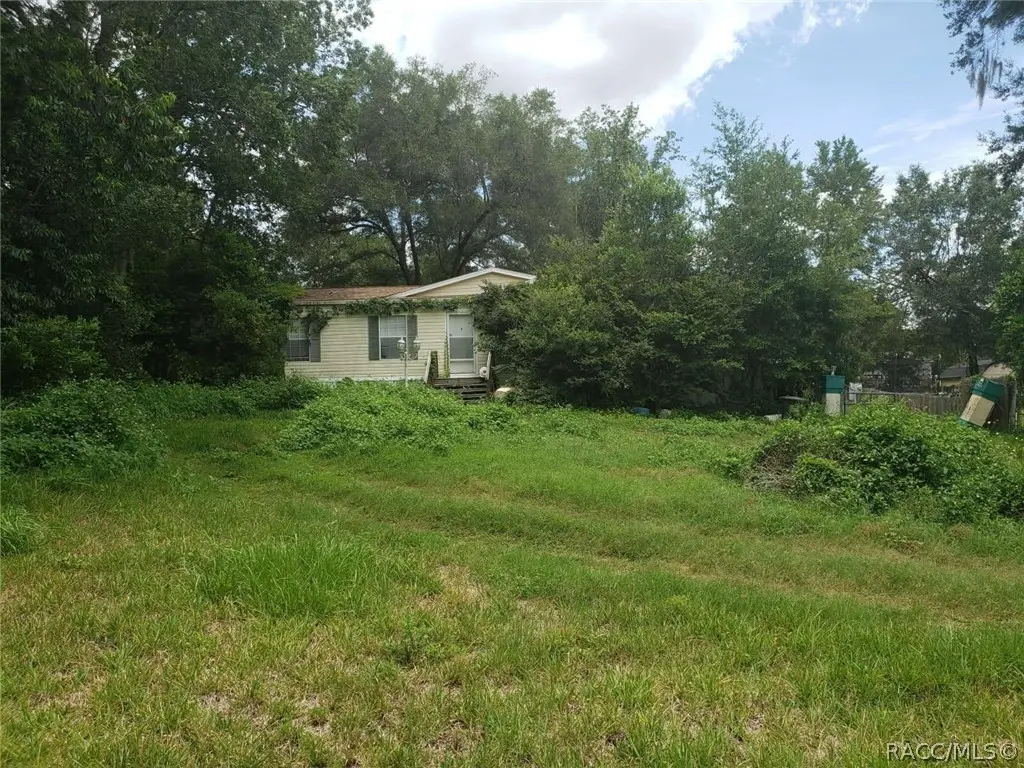
5323 E South Crossing Ct · Inverness Highlands South, FL
Flood risk 1/10 · Minimal
- FEMA flood zone
- X (unshaded)
- Chance of flooding over 30 yrs
- 0.0%
- Est. flood insurance / yr
- $507 – $1,088
Fire risk 5/10 · Moderate
- Est. fire insurance / yr
- $947 – $1,759
Heat risk 9/10 · Severe
- Hot days now (above 108°F)
- 7 days/yr
- Hot days in 30 yrs
- 24 days/yr
Wind risk 9/10 · Severe
- Chance of severe wind over 30 yrs
- 99.0%
Air-quality risk 1/10 · Minimal
- Unhealthy air days now
- 0 days/yr
- Unhealthy air days in 30 yrs
- 0 days/yr
Risk factors via First Street. Map © Google.
Why this score? — see what drove the B+ grade
The composite is a weighted blend of 9 inputs, each scored 0–100. Each bar is that input's sub-score; the figure is the points it added to the 100-point composite (weight × sub-score).
- Cash flow +29.6/30.0
- ARV discount +15.0/15.0
- DSCR +10.0/10.0
- 1% rule +8.7/10.0
- Schools +4.1/10.0
- Livability +3.4/5.0
- Rent growth +2.5/5.0
- Condition / age +2.5/5.0
- Appreciation +0.0/10.0
$129,900
🖨 Deal sheet 📄 Offer letter ✓ Due diligence
Listing remarks MLS
AMAZING HOME RESTING ON 1/3 ACRE, BUILT W/ MARINE PLYWOOD FLOORING, SPACIOUS KITCHEN W/ BEAUTIFULLY DESIGNED WHITE CABINETS & ISLAND, CROWN MOLDING, ALL BEDROOMS W/ WALK INS, & 20 X 10 WORKSHOP W/ POWER. Special Features Include: Master Suite w/ large walk in closet, garden tub, handicap modified, & dual sinks; Great Room w/ wood burning fireplace & cathedral ceiling; Interior Painted 2014; Kitchen w/ pass through window to great room, bar counter w/ sink, built in turn around spice racks in cabinets, breakfast bar, & pantry; Formal Dining Room; 3 Zone Sprinkler System; 200 Amp Service; 20 X 16 Detached Carport; NEW Drain Field 2014; Open/Split Floor Plans. HURRY!
Key facts
- 0.32 acre lot
- Parking
- Built 2006
Property features AI
Exterior
- Parking: 1 parking space; Detached carport; Driveway; Gravel and paved parking areas; Unpaved areas
- Utilities: Private well water; Septic tank sewer
- Home design: Residential mobile home (double wide); Single-story
- Construction: Vinyl siding; Pillar/post/pier foundation
- Exterior features: Asphalt shingle roof; Sloped, rectangular lot; Paved road frontage on a county road; No pool
Interior
- Kitchen: Dishwasher; Electric cooktop; Electric oven; Electric range; Microwave; Refrigerator
- Flooring: Carpet; Vinyl
- Bathrooms: 2 full bathrooms
- Heating & cooling: Central heating; Electric heating; Heat pump; Central air conditioning
- Interior features: Dishwasher; Electric cooktop; Electric oven; Electric range; Microwave; Refrigerator; Water heater; 8 total rooms
- Laundry & utility: Water heater
Neighborhood map
What this means for you Summary
Snapshot
- This is a 3-bed/2.0-bath manufactured listed at $130k.
Deal economics
- At list price, monthly cash flow is $470 ($6k/yr) — positive.
- The deal already cash-flows at list — no discount required.
- Meets the 1% rule at list price ($2k rent vs $130k).
- Cap rate 10.6% vs local median 5.0% in Inverness Highlands South — top-decile yield for the area; either an underpriced asset or a hidden risk that comps aren't pricing in. Stress-test before assuming the spread holds.
Location & tenants
- Location reads 68/100 on livability (#508 in FL) — a middle-class / working-renter tenant base. Strengths: cost of living A+, housing A+, crime B; Watch: employment C-, health & safety C-, amenities F.
- Citrus (rural): math 49% / reading 50% proficiency, ranked #44 of 73 in FL (top 60%) — families likely to look elsewhere, expect single-tenant / working-renter base with shorter leases.
- Zoned schools: Pleasant Grove Elementary School (math 61% / reading 58%, grade B-, #690 of 2,144 statewide, top 34%, 621 students, 67% FRL); Inverness Middle School (math 52% / reading 48%, grade C, #254 of 571 statewide, top 45%, 1,017 students, 60% FRL); Citrus High School (math 34% / reading 51%, grade F, #264 of 667 statewide, top 41%, 1,503 students, 54% FRL) — zoned schools at 60% FRL track the district average.
- Market conditions: 260 active listings in the ZIP; 2,443 units permitted in Citrus County in 2024 (0 in 5+ unit buildings).
Forward outlook
- Local home prices are declining (-3.0%/yr); year-one equity from $898 of loan paydown is wiped out by about $4k of value loss. Plan a longer hold.
- Citrus County population projected to shrink 10% by 2050 — rents likely to lag national; underwrite the cash flow, not the appreciation.
- At projected returns (-3.0% appreciation + 3.0% rent growth), your $36k cash investment doubles in ~8 years — after that, you're playing with house money.
Negotiation context
- Only 10 days on market — expect competitive offers; lowballing is unlikely to land.
- 2 sale attempts since 11y ago with the ask held roughly flat each time — persistent listings suggest the price (not the market) is what's stuck; bring a comps-based counter.
- Current owner paid $85k; list at $130k implies a 53% gain — meaningful room to come down on a strong offer.
Risks & watch-outs
- Climate carrying-cost: severe wind risk, 99% chance of damaging wind over 30y; moderate wildfire risk; extreme-heat days projected 7→24/yr by 2055 (HVAC capex compounding) — expect insurance premiums to compound above CPI over the hold.
Questions for the listing agent
- Is there a deadline driving the sale (1031 exchange, divorce, estate, relocation)? That informs how much negotiation room exists.
- Schools are F-rated, which usually means shorter tenancies and higher turnover. Who's the typical renter profile here, and what's been the actual vacancy rate?
- What's the average days-on-market for RENTAL listings here right now (not sales)? A rising rental-DOM trend means longer vacancies and softer asking-rent achievability than the comps imply.
- What's the recent tenant-quality profile in this submarket — average credit score on applications, eviction rate, late-payment / NSF rate, and stable-employment percentage? A property-management company in the area should have these aggregated.
- How much new for-sale + rental construction is in the pipeline within 1–3 miles? Heavy new supply typically softens prices + rents 12–24 months out; constrained supply supports both.
Investment metrics
- 1% rule
- 1.37% ✓
- Cap rate
- 10.63%
- Cash-on-cash
- 15.50%
- DSCR
- 1.69
- GRM
- 6.1
CMA / ARV
- ARV (on-the-fly)
- $220,224
- Comps found
- 1
Show comp detail 1 sale within ~0.75 mi
| Address | Dist | Beds/Ba | Sqft | Sold | Price | $/sf | Match |
|---|---|---|---|---|---|---|---|
| 5155 E Muzzle Loaders Ct | 0.17mi | 3/2.0 | 1,755 (-12%) | 17mo | $195,000 | $111 | 59 |
Match score weights: distance 35% · size 25% · config 20% · recency 20%. Top-matched comps best support the ARV.
Projected returns pro-forma
-3.0% appreciation · 3.0% rent growth · sell at horizon
- IRR
- 6.3%
- Equity multiple
- 1.25×
- Total profit
- $8,925
- Equity at exit
- $19,369
- IRR
- 15.7%
- Equity multiple
- 2.28×
- Total profit
- $46,509
- Equity at exit
- $11,231
Cash invested: $36,372 (down + closing). Projections, not guarantees.
Landlord ↔ Tenant lean methodology
- Overall (STATE)
- 87 Strongly Landlord-Friendly
- State Florida
- 87 Strongly Landlord-Friendly · R+3
- County
- — inherits STATE
- City
- — inherits STATE
ZIP-level market 34452
- Home prices YoY
- -25.2%
- Active inventory
- 260
- Price-to-rent
- 6.1×
Monthly cashflow live
- Estimated rent
- $1,779 medium interval (Pro) →
- Mortgage (P&I)
- −$681
- Tax from tax record
- −$200 /mo · $2,403/yr
- Insurance
- −$54
- HOA
- −$0
- Vacancy / Maint / Mgmt
- −$374
- Net cashflow
- $470
Break-even live
UW: 25.0% down · 7.5% · 30yr · 1.5% tax · 5.0% vac · 8.0% maint · 8.0% mgmt
Financing live
Cash to close
- Down payment
- $32,475
- Closing costs
- $3,897
- Reserves months
- —
- Total cash needed
- —
Loan-product check · same deal, 3 products live
Conventional
25% down · 7.5% · 30yr
- Down + closing
- —
- Monthly P&I
- —
- Monthly cashflow
- —
- DSCR
- —
- Eligible?
- —
Personal DTI + credit; lowest rate.
DSCR
20% down · 8.5% · 30yr
- Down + closing
- —
- Monthly P&I
- —
- Monthly cashflow
- —
- DSCR
- —
- Eligible?
- —
No personal income docs; deal must DSCR.
Hard money
10% down · 12.0% · 12mo
- Down + closing
- —
- Monthly P&I
- —
- Monthly cashflow
- —
- DSCR
- —
- Eligible?
- —
Short-term bridge; refi at stabilization.
Listing history 9 events
-
2026-06-19days on market $129,900 Active 10 DOM
-
2026-06-18days on market $129,900 Active 9 DOM
-
2026-06-17days on market $129,900 Active 8 DOM
-
2026-06-16days on market $129,900 Active 7 DOM
-
2026-06-15days on market $129,900 Active 6 DOM
-
2026-06-14days on market $129,900 Active 4 DOM
-
2026-06-13days on market $129,900 Active 3 DOM
-
2026-06-10remarks 356-char remark
-
2026-06-10$129,900 Active 1 DOM
ⓘ Source: listings_history table (triggers on properties + properties_extension) + one-shot
backfill from property_details.listing_events for pre-trigger history.
Tax reassessment forecast FL · Resets to sale price
- Current annual tax
- $2,403 · $200/mo
- Projected year-2 tax
- $2,403 · $200/mo
- Expected delta
- $0/yr ($0/mo · 0.0%)
ⓘ Screening estimate from a state-policy table — verify with the county assessor before closing.
Climate risk First Street
- Flood 1/10 Low FEMA zone X (unshaded) · 0% chance over 30 yrs
- Wildfire 5/10 Major
- Heat 9/10 Extreme 7 d/yr ≥108°F today · 24 d/yr by 30 yrs out
- Wind 9/10 Extreme 99% chance of damaging wind over 30 yrs
- Air quality 1/10 Low 0 unhealthy d/yr today · 0 by 30 yrs out
Nearby sold comps map
Loading sold comps map…
Walkable amenities ~0.75 mi
Loading nearby amenities…
Taxation est. · year 1
- Rental income
- $21,348
- − Mortgage interest
- −$7,276
- − Property taxes
- −$2,403
- − Insurance
- −$650
- − Repairs & maintenance
- −$1,708
- − Management
- −$1,708
- − Depreciation
- −$3,779
- Taxable income
- $3,825
- Est. tax owed @ 24.0%
- −$918
- After-tax cash flow
- $4,720/yr
For passive investors: Depreciation is non-cash, so a rental often shows a tax loss while cash-flowing — sheltering income. Rental losses are passive: they offset passive income freely, and up to $25,000/yr can offset ordinary (W-2) income if you actively participate and your MAGI is under $100k (phasing out to $0 by $150k); unused losses carry forward. On sale, claimed depreciation is recaptured at up to 25%, and gains may owe capital-gains tax (a 1031 exchange can defer both). Figures are a year-1 estimate at your 24.0% rate — not tax advice; consult a CPA.
Schools (NCES district)
- District
- Citrus
- NCES district ID
- 1200270
- Math proficiency
- 49% ▼ -10.00%
- Reading proficiency
- 50% ▼ -6.00%
- Median HH income
- $38,618
- Composite
- 41.28/100
- National rank
- #3519
- State rank
- #44 of 73 in FL
Livability — Inverness Highlands South
- Score
- 68/100
- State rank
- #508
- US rank
- #9372
Category grades
Schools grade is shown separately in the Schools card above.
Census & demographics
- Census place
- Inverness Highlands South, FL
- Population (ZIP)
- 13,729
Population outlook (Citrus County) Hauer SSP2
- Today (2025)
- 138,622 people
- By 2030
- 136,886 · -1.3%
- By 2040
- 132,009 · -4.8%
- By 2050
- 125,196 · -9.7%
- By 2075
- 108,570 · -21.7%
- By 2100
- 84,454 · -39.1%
Race, ethnicity, and origin ACS 2023
- Neighborhood character
- Predominantly White (86%)
- Race & ethnicity
- White 86% Hispanic / Latino 9% Two or more races 5% Asian 2%
- Hispanic origin (detail)
- Mexican 1% Puerto Rican 3% Cuban 2% Dominican 1%
- Common ancestry
- Lithuanian 3% Romanian 2% Slovak 2%
- Foreign-born
- 4% · Canada, Jamaica, Dominican Republic
- Languages at home
- 92% English-only · Spanish 6%
Political lean MEDSL · Citrus
- 2024 margin
- Solid R (+45.9) · D 26.8% · R 72.6%
- 2008→2024 swing
- -29.8pp toward R · 2008: -16.1pp · 2024: -45.9pp
- All cycles
- 2024: R+45.9 2020: R+41.0 2016: R+39.7 2012: R+21.9 2008: R+16.1
Not yet ingested
- Civics
- —
Market trends
- HPI YoY
- ▼ -105.43%
- Current HPI
- 312.8871
- Rent YoY
- —
- Metro
- —
- State GDP YoY
- ▲ 3.28%
- F500 in state
- 36
Industry mix (Fortune 500 HQ in FL)
| Industry | F500 HQs | Revenue |
|---|---|---|
| Industrial Technology | 2 | $29B |
|
||
| Insurance | 2 | $17B |
|
||
| Retail | 1 | $60B |
|
||
| Technology Distribution | 1 | $58B |
|
||
| Homebuilding | 1 | $35B |
|
||
| Technology Manufacturing | 1 | $35B |
|
||
Price history
+44.5% since first listed4 events — show timeline
- 2026-06-09 Listed $129,900 RACC
- 2015-12-17 Sold (Public Records) $84,900 Public Records
- 2015-12-17 Sold (MLS) $84,900 RACC
- 2015-08-28 Listed $89,900 RACC
Property tax history
+14.7%/yrLatest (2025): $2,403 · +14.7% YoY. Source: county tax records.
Cash-flow waterfall
monthlySold comps — $/sqft
last 12 mo · ≤1 miLoading sold comps…