 🏗️ New Construction
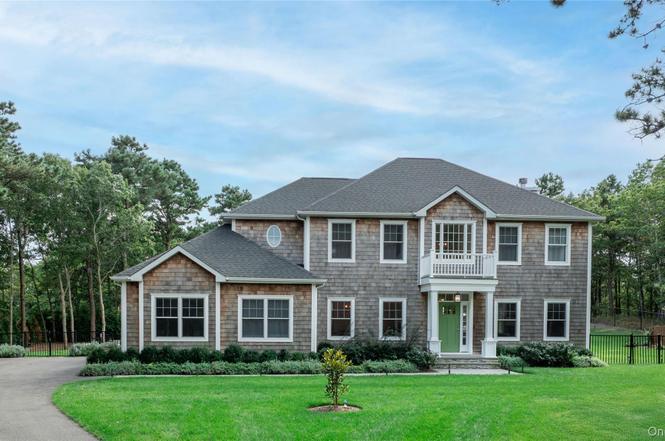
6 Clara Dr · East Quogue, NY
Flood risk 1/10 · Minimal
- FEMA flood zone
- X (unshaded)
- Chance of flooding over 30 yrs
- 0.0%
- Est. flood insurance / yr
- $507 – $1,088
Fire risk 4/10 · Minor
- Est. fire insurance / yr
- $691 – $1,283
Heat risk 4/10 · Minor
- Hot days now (above 90°F)
- 7 days/yr
- Hot days in 30 yrs
- 19 days/yr
Wind risk 8/10 · Major
- Chance of severe wind over 30 yrs
- 80.0%
Air-quality risk 3/10 · Minor
- Unhealthy air days now
- 2 days/yr
- Unhealthy air days in 30 yrs
- 3 days/yr
Risk factors via First Street. Map © Google.
Why this score? — see what drove the B- grade
The composite is a weighted blend of 9 inputs, each scored 0–100. Each bar is that input's sub-score; the figure is the points it added to the 100-point composite (weight × sub-score).
- Cash flow +30.0/30.0
- DSCR +10.0/10.0
- 1% rule +9.0/10.0
- ARV discount +7.5/15.0
- Schools +5.0/10.0
- Livability +3.1/5.0
- Rent growth +2.5/5.0
- Condition / age +2.5/5.0
- Appreciation +0.0/10.0
$2,450,000
🖨 Deal sheet (PDF) 📄 Offer letter ✓ Due diligence
Listing remarks
Welcome to 6 Clara Drive — a modern Hamptons retreat that perfectly blends luxury, privacy, and nature. Completed in 2023, this exceptional new construction sits on 3.79 acres of beautifully wooded land at the end of a quiet cul-de-sac in the coveted Southampton Pines development in East Quogue. Designed for comfort, functionality, and timeless appeal, the home offers 5 spacious bedrooms, 4.5 bathrooms, and the rare combination of modern craftsmanship and serene surroundings. From the moment you arrive, the home’s setting immediately impresses — tucked away and bordered by lush trees, it provides a true sense of seclusion and peace. The approach opens to a beautifully desi
Key facts
- Extensive decking
- Quiet cul-de-sac
- New construction
Tags
Property features AI
Exterior
- Parking: Driveway; Garage with automatic door opener; Two garage spaces; Total of four parking spaces
- Security: Security system
- Utilities: Electricity connected (PSEG); Natural gas connected; Water connected; Sewer connected; Septic tank; Cable connected; Trash collection (private); Underground utilities; Pool equipment and cover provided
- Home design: Single family residence; New construction; Full walk-out basement
- Construction: Shake siding and wood siding; Foam insulation
- Exterior features: Fire pit; Outdoor lighting; Deck; Back yard; Front yard; Sprinklers in front and rear; Borders state land; Cul-de-sac location; Level and partially wooded lot; Private and secluded setting; In-ground saltwater pool with cover and pool/spa combo
Interior
- Kitchen: Convection oven; Gas range; Microwave; Dishwasher; Garbage disposal; Kitchen island; Breakfast bar; Quartz/Quartzite counters; Open kitchen
- Bedrooms: Includes a bedroom on the first floor
- Flooring: Hardwood floors
- Bathrooms: Four full bathrooms; One half bathroom
- Heating & cooling: Forced air heating; Central air conditioning
- Interior features: First-floor bedroom; First-floor full bathroom; Breakfast bar; Central vacuum; Double vanities; Formal dining room; High ceilings; High-speed internet; His-and-hers closets; Kitchen island; Open floorplan; Open kitchen; Primary bathroom; Master suite on main level; Quartz/Quartzite counters; Recessed lighting; Soaking tub; Walk-in closet(s); Oversized double-pane windows; Deck access
- Laundry & utility: Laundry room; Washer and dryer; Tankless water heater; Exhaust fan
Neighborhood map
What this means for you Summary
Snapshot
- This is a 5-bed/4.5-bath single-family listed at $2.45M.
Deal economics
- At list price, monthly cash flow is $8k ($94k/yr) — positive.
- The deal already cash-flows at list — no discount required.
- To meet the 1% rule (rent ≥ 1% of price), the offer needs to be $2.38M (2.8% below list).
- Recommended offer: $2.16M (12.0% below list) — sets the bar for market timing.
Location & tenants
- Location reads 61/100 on livability (#943 in NY) — a middle-class / working-renter tenant base. Strengths: crime A+, employment A+; Watch: amenities F, commute F, cost of living F.
- East Quogue Union Free School District (suburban): math 55% / reading 50% proficiency, ranked #342 of 755 in NY (top 45%) — acceptable for families but not a draw, mixed tenant base, ~2y average lease; only 15% free/reduced lunch — higher-income household profile.
- Zoned schools: East Quogue School (math 57% / reading 62%, grade B-, #745 of 2,108 statewide, top 39%, 355 students, 31% FRL) — zoned schools average 31% FRL vs 15% district-wide (16 pts higher); higher-poverty schools than district average — tighter screening recommended.
- Market conditions: 75 active listings in the ZIP; 14 comparable units currently listed for rent nearby; rentals at typical pace (median 24d on market — plan ~3-4 weeks tenant-placement turnaround); 1,366 units permitted in Suffolk County in 2024 (216 in 5+ unit buildings).
Forward outlook
- Local home prices are declining (-3.0%/yr); year-one equity from $12k of loan paydown is wiped out by about $51k of value loss. Plan a longer hold.
- Suffolk County population projected to shrink 5% by 2050 — rents likely to lag national; underwrite the cash flow, not the appreciation.
- At projected returns (-3.0% appreciation + 3.0% rent growth), your $475k cash investment doubles in ~7 years — after that, you're playing with house money.
Negotiation context
- It's been on market 189 days — a 12% lower offer ($2.16M) is reasonable based on typical stale-listing flexibility.
- 8 sale attempts since 9y ago with the ask held roughly flat each time — persistent listings suggest the price (not the market) is what's stuck; bring a comps-based counter.
- Current owner paid $1.41M; list at $2.45M implies a 73% gain — meaningful room to come down on a strong offer.
Risks & watch-outs
- Climate carrying-cost: severe wind risk, 80% chance of damaging wind over 30y — expect insurance premiums to compound above CPI over the hold.
Questions for the listing agent
- It's been on market 189 days. Have you received any prior offers? Is the seller open to a 12% concession, seller financing, or rate buy-down credit?
- Why hasn't it sold? Are there any deal-killer items the seller is aware of (foundation, flood, title, zoning, code violations)?
- Is there a deadline driving the sale (1031 exchange, divorce, estate, relocation)? That informs how much negotiation room exists.
- Schools are B-rated — typically a magnet for longer-tenancy family renters. What's the average tenant stay here, and is there a school-zone premium baked into asking?
- What's the average days-on-market for RENTAL listings here right now (not sales)? A rising rental-DOM trend means longer vacancies and softer asking-rent achievability than the comps imply.
- What's the recent tenant-quality profile in this submarket — average credit score on applications, eviction rate, late-payment / NSF rate, and stable-employment percentage? A property-management company in the area should have these aggregated.
- How much new for-sale + rental construction is in the pipeline within 1–3 miles? Heavy new supply typically softens prices + rents 12–24 months out; constrained supply supports both.
Investment metrics
- 1% rule
- 1.40% ✓
- Cap rate
- 11.87%
- Cash-on-cash
- 19.90%
- DSCR
- 1.89
- GRM
- 5.9
CMA / ARV
- ARV (on-the-fly)
- $1,694,880
- Comps found
- 3
Show comp detail 3 sales within ~0.75 mi
| Address | Dist | Beds/Ba | Sqft | Sold | Price | $/sf | Match |
|---|---|---|---|---|---|---|---|
| 6 Clara Dr | 0.00mi | 5/4.5 | 3,424 (0%) | 0mo | $2,350,000 | $686 | 100 |
| 36 Corbett Dr | 0.27mi | 4/4.0 (-1) | 3,200 (-6%) | 12mo | $1,500,000 | $469 | 59 |
| 13 Corbett Dr | 0.22mi | 4/4.0 (-1) | 3,936 (+15%) | 18mo | $1,950,000 | $495 | 43 |
Match score weights: distance 35% · size 25% · config 20% · recency 20%. Top-matched comps best support the ARV.
Projected returns pro-forma
-3.0% appreciation · 3.0% rent growth · sell at horizon
- IRR
- 12.0%
- Equity multiple
- 1.48×
- Total profit
- $226,598
- Equity at exit
- $252,712
- IRR
- 21.0%
- Equity multiple
- 2.78×
- Total profit
- $842,422
- Equity at exit
- $146,542
Cash invested: $474,566 (down + closing). Projections, not guarantees.
Landlord ↔ Tenant lean methodology
- Overall (STATE)
- 15 Strongly Tenant-Friendly
- State New York
- 15 Strongly Tenant-Friendly · D+10
- County
- — inherits STATE
- City
- — inherits STATE
ZIP-level market 11942
- Home prices YoY
- -25.0%
- Active inventory
- 75
- Price-to-rent
- 8.6×
Monthly cashflow live
- Estimated rent
- $23,811 high interval (Pro) →
- Mortgage (P&I)
- −$8,888
- Tax from tax record
- −$1,344 /mo · $16,133/yr
- Insurance
- −$706
- HOA
- −$0
- Vacancy / Maint / Mgmt
- −$5,000
- Net cashflow
- $7,872
Break-even live
Sensitivity live
| Price | -10% $8,831 | -5% $8,351 | +0% $7,872 | +5% $7,392 | +10% $6,912 |
|---|---|---|---|---|---|
| Rent | -10% $5,991 | -5% $6,931 | +0% $7,872 | +5% $8,812 | +10% $9,753 |
| Rate | -1.0pp $8,725 | -0.5pp $8,303 | base $7,872 | +0.5pp $7,433 | +1.0pp $6,986 |
UW: 25.0% down · 7.5% · 30yr · 1.5% tax · 5.0% vac · 8.0% maint · 8.0% mgmt
Financing live
Cash to close
- Down payment
- $423,720
- Closing costs
- $50,846
- Reserves months
- —
- Total cash needed
- —
Loan-product check · same deal, 3 products live
Conventional
25% down · 7.5% · 30yr
- Down + closing
- —
- Monthly P&I
- —
- Monthly cashflow
- —
- DSCR
- —
- Eligible?
- —
Personal DTI + credit; lowest rate.
DSCR
20% down · 8.5% · 30yr
- Down + closing
- —
- Monthly P&I
- —
- Monthly cashflow
- —
- DSCR
- —
- Eligible?
- —
No personal income docs; deal must DSCR.
Hard money
10% down · 12.0% · 12mo
- Down + closing
- —
- Monthly P&I
- —
- Monthly cashflow
- —
- DSCR
- —
- Eligible?
- —
Short-term bridge; refi at stabilization.
Rent comps 14 comps
| Address | Beds | Baths | Sqft | Rent | $/sqft | DOM | Units | Dist |
|---|---|---|---|---|---|---|---|---|
| 1 Candace Dr East Quogue, NY | 4.0 | 4.0 | 3000 | $25,000 | $8.33 | 45d | 1 | 0.19mi |
| 156 Maggie Dr East Quogue, NY | 4.0 | 4.0 | 2700 | $95,000 | $35.19 | 45d | 1 | 0.28mi |
| 151 Chardonnay Dr East Quogue, NY | 5.0 | 4.5 | 4136 | $25,000 | $6.04 | 1d | 1 | 0.32mi |
| 4 Aerie Way East Quogue, NY | 4.0 | 3.0 | 2400 | $11,000 | $4.58 | 17d | 1 | 0.49mi |
| 126 Malloy Dr East Quogue, NY | 5.0 | 4.5 | 3550 | $45,000 | $12.68 | 24d | 1 | 0.60mi |
| 4 Bennett Dr East Quogue, NY | 4.0 | 3.0 | 2400 | $11,000 | $4.58 | 19d | 1 | 0.61mi |
| 3 Bennett Dr East Quogue, NY | 4.0 | 4.0 | 2673 | $5,000 | $1.87 | 45d | 1 | 0.63mi |
| 19 Pine Tree Ln East Quogue, NY | 6.0 | 5.0 | 2872 | $23,000 | $8.01 | 0d | 1 | 0.65mi |
| 26 Squires Ave East Quogue, NY | 4.0 | 2.5 | 2950 | $7,000 | $2.37 | 45d | 1 | 1.06mi |
| 10 Foxboro Rd Hampton Bays, NY | 4.0 | 2.5 | 2308 | $17,000 | $7.37 | 0d | 1 | 1.16mi |
| 99 Spinney Rd East Quogue, NY | 5.0 | 4.5 | 3512 | $95,000 | $27.05 | 26d | 1 | 1.18mi |
| 58 Homewood Dr Hampton Bays, NY | 4.0 | 3.0 | 2700 | $17,000 | $6.30 | 0d | 1 | 1.24mi |
| 4 Landing Ln East Quogue, NY | 6.0 | 4.5 | 3000 | $50,000 | $16.67 | 24d | 1 | 1.34mi |
| 32A Vail Ave East Quogue, NY | 4.0 | 5.0 | 4442 | $23,000 | $5.18 | 13d | 1 | 1.36mi |
Listing history 28 events
-
2026-04-24status Pending
-
2025-10-11$2,450,000 Active
-
2024-05-03historical $20,000
-
2024-03-23price $20,000
-
2024-02-05price $40,000
-
2024-01-21price $45,000
-
2023-09-18$5,000
-
2023-07-25soldstatus $1,412,628
-
2020-10-30status Pending
-
2020-07-02historical
-
2020-05-19historical
-
2020-05-19historical
-
2020-02-29$1,795,000 New
-
2020-02-10historical
-
2019-09-05soldstatus $425,000
-
2019-05-13$1,795,000 New
-
2019-05-05price $1,945,000
-
2019-04-27$1,895,000 New
-
2019-04-01historical
-
2018-12-20price $398,990
-
2018-10-06$425,000 New
-
2018-09-24historical
-
2018-08-13price $475,000
-
2018-05-23price $499,000
-
2018-04-11$515,000 New
-
2017-12-01historical
-
2017-06-16$525,000 New
-
2012-06-09soldstatus $256,250
ⓘ Source: listings_history table (triggers on properties + properties_extension) + one-shot
backfill from property_details.listing_events for pre-trigger history.
Tax reassessment forecast NY · Partial reset (capped growth)
- Current annual tax
- $16,133 · $1,344/mo
- Projected year-2 tax
- $28,769 · $2,397/mo
- Expected delta
- +$12,636/yr (+$1,053/mo · 78.3%)
ⓘ Screening estimate from a state-policy table — verify with the county assessor before closing.
Climate risk First Street
- Flood 1/10 Low FEMA zone X (unshaded) · 0% chance over 30 yrs
- Wildfire 4/10 Moderate
- Heat 4/10 Moderate 7 d/yr ≥90°F today · 19 d/yr by 30 yrs out
- Wind 8/10 Severe 80% chance of damaging wind over 30 yrs
- Air quality 3/10 Moderate 2 unhealthy d/yr today · 3 by 30 yrs out
Nearby sold comps map
Loading sold comps map…
Walkable amenities ~0.75 mi
Loading nearby amenities…
Taxation est. · year 1
- Rental income
- $285,729
- − Mortgage interest
- −$94,940
- − Property taxes
- −$16,133
- − Insurance
- −$8,474
- − Repairs & maintenance
- −$22,858
- − Management
- −$22,858
- − Depreciation
- −$49,306
- Taxable income
- $71,160
- Est. tax owed @ 24.0%
- −$17,078
- After-tax cash flow
- $77,383/yr
For passive investors: Depreciation is non-cash, so a rental often shows a tax loss while cash-flowing — sheltering income. Rental losses are passive: they offset passive income freely, and up to $25,000/yr can offset ordinary (W-2) income if you actively participate and your MAGI is under $100k (phasing out to $0 by $150k); unused losses carry forward. On sale, claimed depreciation is recaptured at up to 25%, and gains may owe capital-gains tax (a 1031 exchange can defer both). Figures are a year-1 estimate at your 24.0% rate — not tax advice; consult a CPA.
Schools (NCES district)
- District
- East Quogue Union Free School District
- NCES district ID
- 3609900
- Math proficiency
- 55% ▬ 0.00%
- Reading proficiency
- 50% ▲ 5.00%
- Median HH income
- $81,457
- Composite
- 49.79/100
- National rank
- #4207
- State rank
- #342 of 755 in NY
Livability — East Quogue
- Score
- 61/100
- State rank
- #943
- US rank
- #18348
Category grades
Schools grade is shown separately in the Schools card above.
Census & demographics
- Census place
- East Quogue, NY
- City population
- 5,871
- Population (ZIP)
- 5,871
Population outlook (Suffolk County) Hauer SSP2
- Today (2025)
- 1,505,262 people
- By 2030
- 1,498,318 · -0.5%
- By 2040
- 1,471,101 · -2.3%
- By 2050
- 1,424,848 · -5.3%
- By 2075
- 1,337,157 · -11.2%
- By 2100
- 1,217,720 · -19.1%
Race, ethnicity, and origin ACS 2023
- Neighborhood character
- Predominantly White (80%)
- Race & ethnicity
- White 80% Hispanic / Latino 16% Asian 2% Two or more races 2%
- Hispanic origin (detail)
- Mexican 3%
- Common ancestry
- Romanian 6% Scotch-Irish 3% Lithuanian 3%
- Foreign-born
- 13% · Canada, Jamaica, Guatemala
- Languages at home
- 80% English-only · Spanish 12% Other Indo-European 2% Russian/Polish/Slavic 2%
Political lean MEDSL · Suffolk
- 2024 margin
- Lean R (+10.0) · D 45.0% · R 55.0%
- 2008→2024 swing
- -16.0pp toward R · 2008: 6.0pp · 2024: -10.0pp
- All cycles
- 2024: R+10.0 2020: R+0.0 2016: R+8.2 2012: D+2.9 2008: D+6.0
Not yet ingested
- Civics
- —
Market trends
- HPI YoY
- ▼ -145.33%
- Current HPI
- 435.8017
- Rent YoY
- —
- Metro
- —
- State GDP YoY
- ▲ 2.60%
- F500 in state
- 92
Industry mix (Fortune 500 HQ in NY)
| Industry | F500 HQs | Revenue |
|---|---|---|
| Financial Services | 10 | $950B |
|
||
| Consumer Goods | 9 | $162B |
|
||
| Insurance | 4 | $225B |
|
||
| Telecommunications | 2 | $144B |
|
||
| Pharmaceuticals | 2 | $112B |
|
||
| Media / Entertainment | 2 | $69B |
|
||
Price history
+856.1% since first listed28 events — show timeline
- 2026-04-24 Pending — OneKey® MLS as Distributed by MLS Grid
- 2025-10-11 Listed $2,450,000 OneKey® MLS as Distributed by MLS Grid
- 2024-05-03 Rental Removed $20,000 ONEKEY
- 2024-03-23 Price Changed $20,000 ONEKEY
- 2024-02-05 Price Changed $40,000 ONEKEY
- 2024-01-21 Price Changed $45,000 ONEKEY
- 2023-09-18 Listed for Rent $5,000 ONEKEY
- 2023-07-25 Sold (Public Records) $1,412,628 Public Records
- 2020-10-30 Pending — OneKey® MLS as Distributed by MLS Grid
- 2020-07-02 Listing Removed — OneKey® MLS as Distributed by MLS Grid
- 2020-05-19 Listing Removed — OneKey® MLS as Distributed by MLS Grid
- 2020-05-19 Listing Removed — OneKey® MLS as Distributed by MLS Grid
- 2020-02-29 Listed $1,795,000 OneKey® MLS as Distributed by MLS Grid
- 2020-02-10 Listing Removed — OneKey® MLS as Distributed by MLS Grid
- 2019-09-05 Sold (Public Records) $425,000 Public Records
- 2019-05-13 Listed $1,795,000 OneKey® MLS as Distributed by MLS Grid
- 2019-05-05 Price Changed $1,945,000 OneKey® MLS as Distributed by MLS Grid
- 2019-04-27 Listed $1,895,000 OneKey® MLS as Distributed by MLS Grid
- 2019-04-01 Listing Removed — OneKey® MLS as Distributed by MLS Grid
- 2018-12-20 Price Changed $398,990 OneKey® MLS as Distributed by MLS Grid
- 2018-10-06 Listed $425,000 OneKey® MLS as Distributed by MLS Grid
- 2018-09-24 Listing Removed — OneKey® MLS as Distributed by MLS Grid
- 2018-08-13 Price Changed $475,000 OneKey® MLS as Distributed by MLS Grid
- 2018-05-23 Price Changed $499,000 OneKey® MLS as Distributed by MLS Grid
- 2018-04-11 Listed $515,000 OneKey® MLS as Distributed by MLS Grid
- 2017-12-01 Listing Removed — OneKey® MLS as Distributed by MLS Grid
- 2017-06-16 Listed $525,000 OneKey® MLS as Distributed by MLS Grid
- 2012-06-09 Sold (Public Records) $256,250 Public Records
Property tax history
+12.0%/yrLatest (2024): $16,133 · +0.0% YoY. Source: county tax records.
Cash-flow waterfall
monthlySold comps — $/sqft
last 12 mo · ≤1 miLoading sold comps…