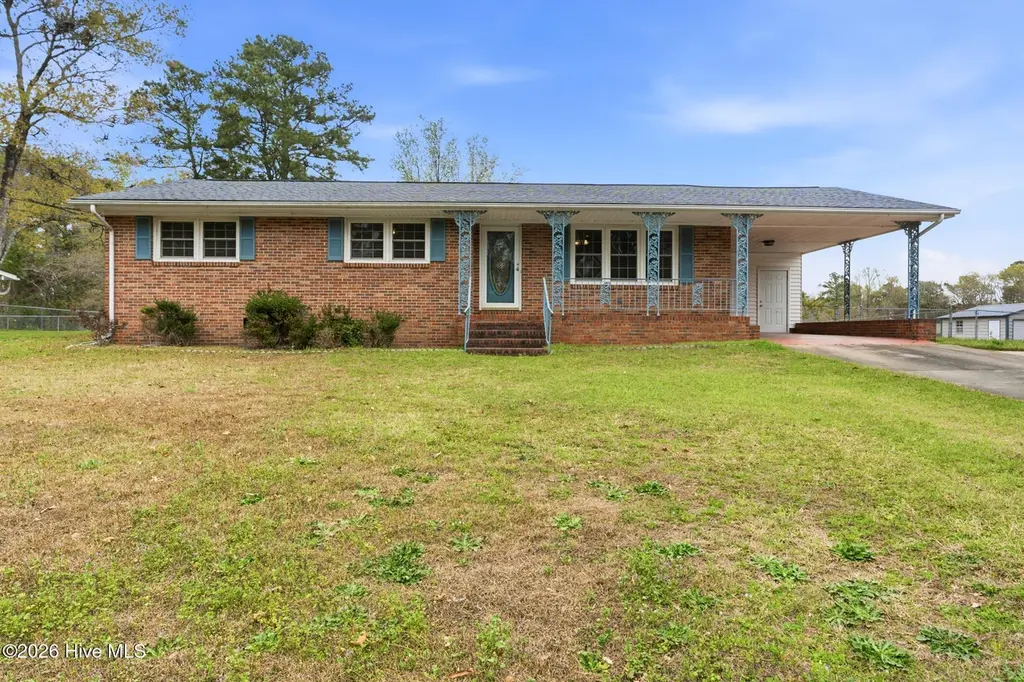
132 Southwood Dr · East Rockingham, NC
Flood risk 1/10 · Minimal
- FEMA flood zone
- X (unshaded)
- Chance of flooding over 30 yrs
- 0.0%
- Est. flood insurance / yr
- $507 – $1,088
Fire risk 4/10 · Minor
- Est. fire insurance / yr
- $906 – $1,684
Heat risk 7/10 · Major
- Hot days now (above 108°F)
- 7 days/yr
- Hot days in 30 yrs
- 16 days/yr
Wind risk 6/10 · Moderate
- Chance of severe wind over 30 yrs
- 64.0%
Air-quality risk 1/10 · Minimal
- Unhealthy air days now
- 0 days/yr
- Unhealthy air days in 30 yrs
- 0 days/yr
Risk factors via First Street. Map © Google.
Why this score? — see what drove the D+ grade
The composite is a weighted blend of 9 inputs, each scored 0–100. Each bar is that input's sub-score; the figure is the points it added to the 100-point composite (weight × sub-score).
- Cash flow +15.7/30.0
- ARV discount +15.0/15.0
- DSCR +4.8/10.0
- 1% rule +3.4/10.0
- Livability +2.9/5.0
- Schools +2.7/10.0
- Rent growth +2.5/5.0
- Condition / age +2.5/5.0
- Appreciation +0.0/10.0
$189,900
🖨 Deal sheet 📄 Offer letter ✓ Due diligence
Listing remarks
Come check out this 3-bedroom, 2 bath brick home with a cozy fireplace in the extra living room, enjoy a convenient carport, fenced in back yard perfect for outdoor gatherings, in a classic ranch layout. Located in a quiet friendly neighborhood. Call today for your private showing.
Key facts
- Classic ranch layout
- Fenced in back yard
- Extra living room
Tags
Property features AI
Exterior
- Parking: Other parking
- Utilities: Natural gas available and connected; Water connected; Sewer connected
- Home design: Single-family residence; One story; Entry level: 1
- Construction: Brick veneer and vinyl siding over frame construction
- Exterior features: Porch; Partial chain-link fencing; Shingle roof; Has view
Interior
- Bedrooms: Total rooms: 6
- Bathrooms: 2 full bathrooms
- Heating & cooling: Central air conditioning; Natural gas heating
- Interior features: Ceiling fans; Window coverings; Gas log fireplace
Neighborhood map
What this means for you Summary
Snapshot
- This is a 3-bed/1.5-bath single-family listed at $190k.
Deal economics
- At list price, monthly cash flow is $83 ($994/yr) — positive.
- The deal already cash-flows at list — no discount required.
- To meet the 1% rule (rent ≥ 1% of price), the offer needs to be $159k (16.1% below list).
- Recommended offer: $159k (16.1% below list) — sets the bar for 1% rule.
Location & tenants
- Location reads 58/100 on livability (#579 in NC) — a working-class tenant base; expect higher turnover. Strengths: cost of living A+, housing A+; Watch: amenities F, commute F, employment F.
- Richmond County Schools (town): math 30% / reading 36% proficiency, ranked #139 of 178 in NC (top 78%) — families likely to look elsewhere, expect single-tenant / working-renter base with shorter leases; 70% free/reduced lunch — lower-income household profile, screen leases tightly.
- Zoned schools: Richmond Senior High (math 58% / reading 38%, grade D, #329 of 535 statewide, top 62%, 1,286 students, 99% FRL) — zoned schools average 99% FRL vs 70% district-wide (30 pts higher); higher-poverty schools than district average — tighter screening recommended.
- Zoned-school proficiency averages 48% at this address vs 33% district-wide (+15 pts) — the actual schools serving this property are materially stronger than the Richmond County Schools average implies; a family-tenant draw the district grade alone would hide.
- Market conditions: 155 active listings in the ZIP; 54 units permitted in Richmond County in 2024 (0 in 5+ unit buildings).
Forward outlook
- Local home prices are declining (-3.0%/yr); year-one equity from $1k of loan paydown is wiped out by about $6k of value loss. Plan a longer hold.
- Richmond County population projected at -22% by 2050 — secular population decline; favor cash flow + early exit over multi-decade hold.
Negotiation context
- It's been on market 55 days — a 3% lower offer ($184k) is reasonable based on typical stale-listing flexibility.
- 2 sale attempts; this cycle's ask has dropped $40k (17%) from the opening price — seller is motivated, your offer sets the floor, not the list.
Risks & watch-outs
- Climate carrying-cost: major wind risk, 64% chance of damaging wind over 30y; extreme-heat days projected 7→16/yr by 2055 (HVAC capex compounding) — expect insurance premiums to compound above CPI over the hold.
Questions for the listing agent
- It's been on market 55 days. Have you received any prior offers? Is the seller open to a 16% concession, seller financing, or rate buy-down credit?
- Built in 1960 — when were the roof, HVAC, electrical panel, plumbing, and water heater last replaced?
- Is there a deadline driving the sale (1031 exchange, divorce, estate, relocation)? That informs how much negotiation room exists.
- Schools are F-rated, which usually means shorter tenancies and higher turnover. Who's the typical renter profile here, and what's been the actual vacancy rate?
- The area grade is low — what's the realistic commute time and amenity access for the typical tenant pool here? Any planned neighborhood developments (good or bad) we should know about?
- What's the average days-on-market for RENTAL listings here right now (not sales)? A rising rental-DOM trend means longer vacancies and softer asking-rent achievability than the comps imply.
- What's the recent tenant-quality profile in this submarket — average credit score on applications, eviction rate, late-payment / NSF rate, and stable-employment percentage? A property-management company in the area should have these aggregated.
- How much new for-sale + rental construction is in the pipeline within 1–3 miles? Heavy new supply typically softens prices + rents 12–24 months out; constrained supply supports both.
Investment metrics
- 1% rule
- 0.84% ✗
- Cap rate
- 6.82%
- Cash-on-cash
- 1.87%
- DSCR
- 1.08
- GRM
- 9.9
CMA / ARV
- ARV (on-the-fly)
- $232,440
- Comps found
- 6
Show comp detail 6 sales within ~0.75 mi
| Address | Dist | Beds/Ba | Sqft | Sold | Price | $/sf | Match |
|---|---|---|---|---|---|---|---|
| 126 Southwood Dr | 0.04mi | 3/1.5 | 1,517 (-3%) | 23mo | $205,000 | $135 | 75 |
| 106 Katie Ln | 0.47mi | 3/2.0 | 1,440 (-8%) | 2mo | $215,000 | $149 | 62 |
| 440 Old Cheraw Hwy | 0.33mi | 3/1.0 | 1,680 (+8%) | 14mo | $78,000 | $46 | 58 |
| 221 Farmstead Ct | 0.54mi | 3/2.0 | 1,483 (-5%) | 21mo | $245,000 | $165 | 47 |
| 214 Country Canyon Dr | 0.75mi | 3/2.0 | 1,568 (+0%) | 19mo | $110,000 | $70 | 46 |
| 237 Farmstead Ct | 0.59mi | 3/2.0 | 1,430 (-8%) | 22mo | $247,000 | $173 | 38 |
Match score weights: distance 35% · size 25% · config 20% · recency 20%. Top-matched comps best support the ARV.
Projected returns pro-forma
-3.0% appreciation · 3.0% rent growth · sell at horizon
- IRR
- -13.4%
- Equity multiple
- 0.52×
- Total profit
- $-25,557
- Equity at exit
- $28,315
- IRR
- -4.5%
- Equity multiple
- 0.70×
- Total profit
- $-15,704
- Equity at exit
- $16,419
Cash invested: $53,172 (down + closing). Projections, not guarantees.
Landlord ↔ Tenant lean methodology
- Overall (STATE)
- 85 Strongly Landlord-Friendly
- State North Carolina
- 85 Strongly Landlord-Friendly · R+3
- County
- — inherits STATE
- City
- — inherits STATE
ZIP-level market 28379
- Home prices YoY
- -32.4%
- Active inventory
- 155
- Price-to-rent
- 9.9×
Monthly cashflow live
- Estimated rent
- $1,594 medium interval (Pro) →
- Mortgage (P&I)
- −$996
- Tax from tax record
- −$101 /mo · $1,213/yr
- Insurance
- −$79
- HOA
- −$0
- Vacancy / Maint / Mgmt
- −$335
- Net cashflow
- $83
Break-even live
UW: 25.0% down · 7.5% · 30yr · 1.5% tax · 5.0% vac · 8.0% maint · 8.0% mgmt
Financing live
Cash to close
- Down payment
- $47,475
- Closing costs
- $5,697
- Reserves months
- —
- Total cash needed
- —
Loan-product check · same deal, 3 products live
Conventional
25% down · 7.5% · 30yr
- Down + closing
- —
- Monthly P&I
- —
- Monthly cashflow
- —
- DSCR
- —
- Eligible?
- —
Personal DTI + credit; lowest rate.
DSCR
20% down · 8.5% · 30yr
- Down + closing
- —
- Monthly P&I
- —
- Monthly cashflow
- —
- DSCR
- —
- Eligible?
- —
No personal income docs; deal must DSCR.
Hard money
10% down · 12.0% · 12mo
- Down + closing
- —
- Monthly P&I
- —
- Monthly cashflow
- —
- DSCR
- —
- Eligible?
- —
Short-term bridge; refi at stabilization.
Listing history 7 events
-
2026-05-15status Pending
-
2026-04-21price $189,900
-
2026-04-20status Active
-
2026-04-16status Pending
-
2026-04-03price $209,900
-
2026-03-24price $217,900
-
2026-03-17$229,900 Active
ⓘ Source: listings_history table (triggers on properties + properties_extension) + one-shot
backfill from property_details.listing_events for pre-trigger history.
Tax reassessment forecast NC · Resets to sale price
- Current annual tax
- $1,213 · $101/mo
- Projected year-2 tax
- $1,557 · $130/mo
- Expected delta
- +$344/yr (+$29/mo · 28.3%)
ⓘ Screening estimate from a state-policy table — verify with the county assessor before closing.
Climate risk First Street
- Flood 1/10 Low FEMA zone X (unshaded) · 0% chance over 30 yrs
- Wildfire 4/10 Moderate
- Heat 7/10 Severe 7 d/yr ≥108°F today · 16 d/yr by 30 yrs out
- Wind 6/10 Major 64% chance of damaging wind over 30 yrs
- Air quality 1/10 Low 0 unhealthy d/yr today · 0 by 30 yrs out
Nearby sold comps map
Loading sold comps map…
Walkable amenities ~0.75 mi
Loading nearby amenities…
Taxation est. · year 1
- Rental income
- $19,123
- − Mortgage interest
- −$10,637
- − Property taxes
- −$1,213
- − Insurance
- −$950
- − Repairs & maintenance
- −$1,530
- − Management
- −$1,530
- − Depreciation
- −$5,524
- Taxable loss
- −$2,261
- Est. tax savings @ 24.0%
- +$543
- After-tax cash flow
- $1,537/yr
For passive investors: Depreciation is non-cash, so a rental often shows a tax loss while cash-flowing — sheltering income. Rental losses are passive: they offset passive income freely, and up to $25,000/yr can offset ordinary (W-2) income if you actively participate and your MAGI is under $100k (phasing out to $0 by $150k); unused losses carry forward. On sale, claimed depreciation is recaptured at up to 25%, and gains may owe capital-gains tax (a 1031 exchange can defer both). Figures are a year-1 estimate at your 24.0% rate — not tax advice; consult a CPA.
Schools (NCES district)
- District
- Richmond County Schools
- NCES district ID
- 3703870
- Math proficiency
- 30% ▼ -12.00%
- Reading proficiency
- 36% ▼ -3.00%
- Median HH income
- $32,224
- Composite
- 26.97/100
- National rank
- #7076
- State rank
- #139 of 178 in NC
Livability — East Rockingham
- Score
- 58/100
- State rank
- #579
- US rank
- #21339
Category grades
Schools grade is shown separately in the Schools card above.
Census & demographics
- Census place
- East Rockingham, NC
- Population (ZIP)
- 24,068
Population outlook (Richmond County) Hauer SSP2
- Today (2025)
- 42,892 people
- By 2030
- 41,257 · -3.8%
- By 2040
- 37,629 · -12.3%
- By 2050
- 33,655 · -21.5%
- By 2075
- 23,992 · -44.1%
- By 2100
- 14,782 · -65.5%
Race, ethnicity, and origin ACS 2023
- Neighborhood character
- Diverse neighborhood (Simpson 0.58)
- Race & ethnicity
- White 56% Black 32% Hispanic / Latino 8% Two or more races 4% Asian 1%
- Hispanic origin (detail)
- Mexican 6%
- Common ancestry
- Serbian 2% Slovak 2% Lithuanian 1%
- Foreign-born
- 4% · Canada, Jamaica
- Languages at home
- 91% English-only · Spanish 7%
Political lean MEDSL · Richmond
- 2024 margin
- Strong R (+20.9) · D 39.2% · R 60.1%
- 2008→2024 swing
- -22.4pp toward R · 2008: 1.5pp · 2024: -20.9pp
- All cycles
- 2024: R+20.9 2020: R+14.8 2016: R+10.1 2012: D+2.7 2008: D+1.5
Not yet ingested
- Civics
- —
Market trends
- HPI YoY
- ▼ -97.10%
- Current HPI
- 203.0628
- Rent YoY
- —
- Metro
- —
- State GDP YoY
- ▲ 3.28%
- F500 in state
- 26
Industry mix (Fortune 500 HQ in NC)
| Industry | F500 HQs | Revenue |
|---|---|---|
| Financial Services | 2 | $213B |
|
||
| Retail | 2 | $95B |
|
||
| Industrial Conglomerate | 1 | $38B |
|
||
| Metals / Steel | 1 | $35B |
|
||
| Utilities | 1 | $30B |
|
||
| Industrial Machinery | 1 | $19B |
|
||
Price history
-17.4% since first listed7 events — show timeline
- 2026-05-15 Pending — Hive MLS
- 2026-04-21 Price Changed $189,900 Hive MLS
- 2026-04-20 Relisted — Hive MLS
- 2026-04-16 Pending — Hive MLS
- 2026-04-03 Price Changed $209,900 Hive MLS
- 2026-03-24 Price Changed $217,900 Hive MLS
- 2026-03-17 Listed $229,900 Hive MLS
Property tax history
+2.1%/yrLatest (2025): $1,213 · -2.0% YoY. Source: county tax records.
Cash-flow waterfall
monthlySold comps — $/sqft
last 12 mo · ≤1 miLoading sold comps…