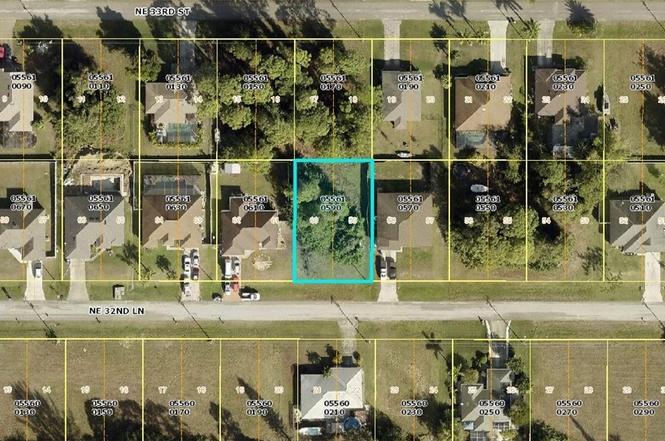
1021 NE 32nd Ln · Cape Coral, FL
Flood risk 1/10 · Minimal
- FEMA flood zone
- X (unshaded)
- Chance of flooding over 30 yrs
- 0.0%
- Est. flood insurance / yr
- $507 – $1,088
Fire risk 4/10 · Minor
- Est. fire insurance / yr
- $947 – $1,759
Heat risk 10/10 · Severe
- Hot days now (above 107°F)
- 7 days/yr
- Hot days in 30 yrs
- 29 days/yr
Wind risk 10/10 · Severe
- Chance of severe wind over 30 yrs
- 99.0%
Air-quality risk 2/10 · Minimal
- Unhealthy air days now
- 1 days/yr
- Unhealthy air days in 30 yrs
- 1 days/yr
Risk factors via First Street. Map © Google.
Why this score? — see what drove the D grade
The composite is a weighted blend of 9 inputs, each scored 0–100. Each bar is that input's sub-score; the figure is the points it added to the 100-point composite (weight × sub-score).
- Cash flow +14.1/30.0
- ARV discount +7.5/15.0
- DSCR +4.3/10.0
- Schools +4.1/10.0
- Livability +3.9/5.0
- 1% rule +2.7/10.0
- Condition / age +2.5/5.0
- Rent growth +1.1/5.0
- Appreciation +0.0/10.0
$299,999
🖨 Deal sheet (PDF) 📄 Offer letter ✓ Due diligence
Listing remarks MLS
Fantastic lot close to schools, shopping, restaurants, and places of worship. Great area to build your dream home and raise the family. Future land use is SM (single family and multi family) Buyer may be able to obtain a variance from the city to build a Duplex. Call today.
Key facts
- Quartz countertops
- Designer cabinets
- 0.24 acre lot
Tags
Neighborhood map
What this means for you Summary
Snapshot
- This is a 4-bed/2.0-bath land listed at $300k.
Deal economics
- At list price, monthly cash flow is $44 ($534/yr) — positive.
- The deal already cash-flows at list — no discount required.
- To meet the 1% rule (rent ≥ 1% of price), the offer needs to be $232k (22.7% below list).
- Recommended offer: $232k (22.7% below list) — sets the bar for 1% rule.
- Cap rate 6.5% vs local median 3.1% in Cape Coral — top-decile yield for the area; either an underpriced asset or a hidden risk that comps aren't pricing in. Stress-test before assuming the spread holds.
Location & tenants
- Location reads 77/100 on livability (#208 in FL, #3,098 nationally) — a middle-class / working-renter tenant base. Strengths: housing A+, health & safety A+, amenities B+; Watch: commute F.
- Lee (suburban): math 47% / reading 50% proficiency, ranked #42 of 73 in FL (top 58%) — families likely to look elsewhere, expect single-tenant / working-renter base with shorter leases.
- Zoned schools: Diplomat Elementary School (math 67% / reading 60%, grade B, #564 of 2,144 statewide, top 27%, 1,069 students, 56% FRL); Mariner Middle School (math 50% / reading 47%, grade C-, #274 of 571 statewide, top 50%, 1,001 students, 53% FRL); Ida S. Baker High School (math 44% / reading 47%, grade D-, #223 of 667 statewide, top 34%, 1,933 students, 39% FRL).
- Market conditions: Rents falling (-5.6%/yr); 1604 active listings in the ZIP; 39 comparable units currently listed for rent nearby; rentals at typical pace (median 22d on market — plan ~3-4 weeks tenant-placement turnaround); 15,411 units permitted in Lee County in 2024 (4,686 in 5+ unit buildings).
- This rent runs 38% of the median local income ($73k/yr) — at the standard rent-burdened threshold; future hikes will face affordability resistance.
Forward outlook
- Local home prices are declining (-3.0%/yr); year-one equity from $2k of loan paydown is wiped out by about $9k of value loss. Plan a longer hold.
- Lee County population projected at +44% by 2050 — long-run rental-demand tailwind backs the buy-and-hold thesis.
Negotiation context
- It's been on market 90 days — a 6% lower offer ($282k) is reasonable based on typical stale-listing flexibility.
- 3 sale attempts since 4y ago; this cycle's ask has dropped $20k (6%) from the opening price — seller is motivated, your offer sets the floor, not the list.
- Current owner paid $87k; list at $300k implies a 245% gain — meaningful room to come down on a strong offer.
Risks & watch-outs
- Climate carrying-cost: severe wind risk, 99% chance of damaging wind over 30y; extreme-heat days projected 7→29/yr by 2055 (HVAC capex compounding) — expect insurance premiums to compound above CPI over the hold.
Questions for the listing agent
- It's been on market 90 days. Have you received any prior offers? Is the seller open to a 23% concession, seller financing, or rate buy-down credit?
- Why hasn't it sold? Are there any deal-killer items the seller is aware of (foundation, flood, title, zoning, code violations)?
- Is there a deadline driving the sale (1031 exchange, divorce, estate, relocation)? That informs how much negotiation room exists.
- Schools are B-rated — typically a magnet for longer-tenancy family renters. What's the average tenant stay here, and is there a school-zone premium baked into asking?
- The area grade is low — what's the realistic commute time and amenity access for the typical tenant pool here? Any planned neighborhood developments (good or bad) we should know about?
- What's the average days-on-market for RENTAL listings here right now (not sales)? A rising rental-DOM trend means longer vacancies and softer asking-rent achievability than the comps imply.
- What's the recent tenant-quality profile in this submarket — average credit score on applications, eviction rate, late-payment / NSF rate, and stable-employment percentage? A property-management company in the area should have these aggregated.
- How much new for-sale + rental construction is in the pipeline within 1–3 miles? Heavy new supply typically softens prices + rents 12–24 months out; constrained supply supports both.
Investment metrics
- 1% rule
- 0.77% ✗
- Cap rate
- 6.47%
- Cash-on-cash
- 0.64%
- DSCR
- 1.03
- GRM
- 10.8
CMA / ARV
No comps found within radius.
Projected returns pro-forma
-3.0% appreciation · 0.0% rent growth · sell at horizon
- IRR
- -18.3%
- Equity multiple
- 0.37×
- Total profit
- $-52,719
- Equity at exit
- $44,731
- IRR
- -16.9%
- Equity multiple
- 0.18×
- Total profit
- $-69,104
- Equity at exit
- $25,938
Cash invested: $84,000 (down + closing). Projections, not guarantees.
Landlord ↔ Tenant lean methodology
- Overall (STATE)
- 87 Strongly Landlord-Friendly
- State Florida
- 87 Strongly Landlord-Friendly · R+3
- County
- — inherits STATE
- City
- — inherits STATE
ZIP-level market 33909
- Home prices YoY
- -23.1%
- Rents YoY
- -5.6%
- Active inventory
- 1604
- Price-to-rent
- 10.8×
Monthly cashflow live
- Estimated rent
- $2,320 high interval (Pro) →
- Mortgage (P&I)
- −$1,573
- Tax from tax record
- −$90 /mo · $1,083/yr
- Insurance
- −$125
- HOA
- −$0
- Vacancy / Maint / Mgmt
- −$487
- Net cashflow
- $44
Break-even live
Sensitivity live
| Price | -10% $214 | -5% $129 | +0% $44 | +5% $-40 | +10% $-125 |
|---|---|---|---|---|---|
| Rent | -10% $-139 | -5% $-47 | +0% $44 | +5% $136 | +10% $228 |
| Rate | -1.0pp $196 | -0.5pp $121 | base $44 | +0.5pp $-33 | +1.0pp $-112 |
UW: 25.0% down · 7.5% · 30yr · 1.5% tax · 5.0% vac · 8.0% maint · 8.0% mgmt
Financing live
Cash to close
- Down payment
- $75,000
- Closing costs
- $9,000
- Reserves months
- —
- Total cash needed
- —
Loan-product check · same deal, 3 products live
Conventional
25% down · 7.5% · 30yr
- Down + closing
- —
- Monthly P&I
- —
- Monthly cashflow
- —
- DSCR
- —
- Eligible?
- —
Personal DTI + credit; lowest rate.
DSCR
20% down · 8.5% · 30yr
- Down + closing
- —
- Monthly P&I
- —
- Monthly cashflow
- —
- DSCR
- —
- Eligible?
- —
No personal income docs; deal must DSCR.
Hard money
10% down · 12.0% · 12mo
- Down + closing
- —
- Monthly P&I
- —
- Monthly cashflow
- —
- DSCR
- —
- Eligible?
- —
Short-term bridge; refi at stabilization.
Rent comps 39 comps
| Address | Beds | Baths | Sqft | Rent | $/sqft | DOM | Units | Dist |
|---|---|---|---|---|---|---|---|---|
| 1015 NE 34th St Cape Coral, FL | 4.0 | 2.0 | 1760 | $2,300 | $1.31 | 25d | 1 | 0.23mi |
| 3223 NE 14th Ave Cape Coral, FL | 4.0 | 3.0 | 1765 | $2,200 | $1.25 | 25d | 1 | 0.38mi |
| 3462 NE 10th Pl Cape Coral, FL | 4.0 | 3.0 | 1665 | $3,000 | $1.80 | 25d | 1 | 0.46mi |
| 3445 NE 8th Pl Cape Coral, FL | 4.0 | 2.0 | 1734 | $2,200 | $1.27 | 25d | 1 | 0.48mi |
| 1424 Weeping Willow Ct Cape Coral, FL | 3.0 | 2.5 | 1679 | $1,999 | $1.19 | 25d | 1 | 0.62mi |
| 3026 NE 6th Pl Cape Coral, FL | 4.0 | 2.0 | 1683 | $2,095 | $1.24 | 25d | 1 | 0.62mi |
| 3610 NE 9th Pl Cape Coral, FL | 4.0 | 2.0 | 1774 | $1,995 | $1.12 | 16d | 1 | 0.64mi |
| 1672 Lake Jessup Cir Cape Coral, FL | 3.0 | 2.5 | 1729 | $2,200 | $1.27 | 12d | 1 | 0.66mi |
| 1541 Fells Cove Ln Unit 1541 Cape Coral, FL | 3.0 | 2.5 | 1657 | $2,400 | $1.45 | 5d | 1 | 0.70mi |
| 1541 Fells Cove Ln Unit 1541 Cape Coral, FL | 3.0 | 2.5 | 1657 | $2,400 | $1.45 | 15d | 1 | 0.70mi |
| 1545 Lake Jessup Cir Cape Coral, FL | 3.0 | 2.5 | 1831 | $2,350 | $1.28 | 25d | 1 | 0.71mi |
| 2925 NE 6th Ave Cape Coral, FL | 4.0 | 2.0 | 1651 | $2,000 | $1.21 | 25d | 1 | 0.72mi |
| 1532 NE 35th St Cape Coral, FL | 4.0 | 2.0 | 1809 | $1,995 | $1.10 | 25d | 1 | 0.78mi |
| 3804 NE 9th Pl Cape Coral, FL | 4.0 | 3.0 | 1683 | $1,995 | $1.19 | 16d | 1 | 0.92mi |
| 3732 NE 12th Pl Cape Coral, FL | 3.0 | 2.0 | 1408 | $1,950 | $1.38 | 25d | 1 | 0.93mi |
| 3717 NE 13th Ave Cape Coral, FL | 3.0 | 2.0 | 1408 | $1,795 | $1.27 | 18d | 1 | 0.93mi |
| 3511 NE 17th Ave Cape Coral, FL | 4.0 | 2.0 | 1717 | $2,350 | $1.37 | 21d | 1 | 0.95mi |
| 2728 NE 6th Pl Cape Coral, FL | 4.0 | 2.0 | 1760 | $1,795 | $1.02 | 3d | 1 | 0.95mi |
| 3512 NE 17th Pl Cape Coral, FL | 4.0 | 3.0 | 1650 | $1,995 | $1.21 | 4d | 1 | 0.98mi |
| 13700 Oak St North Fort Myers, FL | 1.0–3.0 | 1.0–2.0 | 1023 | $2,465 | $2.41 | 5d | 32 | 1.05mi |
| 2620 NE 5th Ave Cape Coral, FL | 3.0 | 2.0 | 1597 | $3,500 | $2.19 | 25d | 1 | 1.17mi |
| 3603 NE 19th Ave Cape Coral, FL | 3.0 | 2.0 | 1147 | $1,750 | $1.53 | 5d | 1 | 1.23mi |
| 3622 NE 19th Ave Cape Coral, FL | 3.0 | 2.0 | 1286 | $2,480 | $1.93 | 25d | 1 | 1.24mi |
| 4028 NE 10th Pl Cape Coral, FL | 3.0 | 2.0 | 1850 | $2,146 | $1.16 | 5d | 1 | 1.25mi |
| 3010 NE 1st Pl Cape Coral, FL | 3.0 | 2.0 | 1582 | $2,750 | $1.74 | 25d | 1 | 1.25mi |
| 3527 NE 19th Pl Cape Coral, FL | 3.0 | 2.0 | 1574 | $2,000 | $1.27 | 25d | 1 | 1.28mi |
| 2603 NE 4th Ave Cape Coral, FL | 3.0 | 2.0 | 1356 | $1,471 | $1.08 | 5d | 1 | 1.28mi |
| 3024 NE 1st Ave Cape Coral, FL | 4.0 | 2.0 | 1499 | $1,695 | $1.13 | 21d | 1 | 1.30mi |
| 1788 Concordia Lake Cir Cape Coral, FL | 2.0–3.0 | 2.0 | 1329 | $3,800 | $2.86 | 13d | 2 | 1.32mi |
| 1724 NE 26th Ter Cape Coral, FL | 4.0 | 2.0 | 1833 | $1,925 | $1.05 | 18d | 1 | 1.32mi |
| 827 NE 23rd Ter Cape Coral, FL | 4.0 | 2.0 | 1412 | $1,850 | $1.31 | 5d | 1 | 1.34mi |
| 3928 NE 17th Ave Cape Coral, FL | 4.0 | 3.0 | 1683 | $2,100 | $1.25 | 25d | 1 | 1.34mi |
| 1800 Concordia Lake Cir #610 Cape Coral, FL | 3.0 | 2.0 | 1680 | $3,300 | $1.96 | 25d | 1 | 1.35mi |
| 4109 NE 9th Pl Cape Coral, FL | 3.0 | 2.0 | 1690 | $1,835 | $1.09 | 5d | 1 | 1.36mi |
| 2907 Santa Barbara Blvd N Cape Coral, FL | 3.0 | 2.0 | 1209 | $1,775 | $1.47 | 12d | 1 | 1.44mi |
| 331 NE 25th St Cape Coral, FL | 4.0 | 2.0 | 1565 | $2,000 | $1.28 | 25d | 1 | 1.44mi |
| 2216 NE 10th Pl Cape Coral, FL | 5.0 | 3.0 | 1836 | $2,300 | $1.25 | 25d | 1 | 1.45mi |
| 1409 NE 23rd St Cape Coral, FL | 3.0 | 2.0 | 1147 | $1,750 | $1.53 | 4d | 1 | 1.48mi |
| 2213 NE 33rd St Cape Coral, FL | 3.0 | 2.0 | 1385 | $1,800 | $1.30 | 25d | 1 | 1.50mi |
Listing history 22 events
-
2026-06-07statusdays on market $299,999 Pending 90 DOM
-
2026-06-02days on market $299,999 Active 87 DOM
-
2026-06-02status $299,999 Active 86 DOM
-
2026-04-01status Pending
-
2026-03-06price $299,999
-
2026-02-06price $309,999
-
2026-01-05$320,490 Active
-
2025-10-23soldstatus $87,000
-
2023-07-20soldstatus $31,500
-
2023-07-12soldstatus $31,500 Closed 274-char remark
Show marketing remark (274 chars)
Fantastic lot close to schools, shopping, restaurants, and places of worship. Great area to build your dream home and raise the family. Future land use is SM (single family and multi family) Buyer may be able to obtain a variance from the city to build a Duplex. Call today.
-
2023-04-28status Pending 274-char remark
Show marketing remark (274 chars)
Fantastic lot close to schools, shopping, restaurants, and places of worship. Great area to build your dream home and raise the family. Future land use is SM (single family and multi family) Buyer may be able to obtain a variance from the city to build a Duplex. Call today.
-
2023-03-28status Active 274-char remark
Show marketing remark (274 chars)
Fantastic lot close to schools, shopping, restaurants, and places of worship. Great area to build your dream home and raise the family. Future land use is SM (single family and multi family) Buyer may be able to obtain a variance from the city to build a Duplex. Call today.
-
2023-03-27status Pending 274-char remark
Show marketing remark (274 chars)
Fantastic lot close to schools, shopping, restaurants, and places of worship. Great area to build your dream home and raise the family. Future land use is SM (single family and multi family) Buyer may be able to obtain a variance from the city to build a Duplex. Call today.
-
2023-02-23price $35,000 274-char remark
Show marketing remark (274 chars)
Fantastic lot close to schools, shopping, restaurants, and places of worship. Great area to build your dream home and raise the family. Future land use is SM (single family and multi family) Buyer may be able to obtain a variance from the city to build a Duplex. Call today.
-
2022-10-13$45,000 Active 274-char remark
Show marketing remark (274 chars)
Fantastic lot close to schools, shopping, restaurants, and places of worship. Great area to build your dream home and raise the family. Future land use is SM (single family and multi family) Buyer may be able to obtain a variance from the city to build a Duplex. Call today.
-
2021-07-14soldstatus $170,000
-
2013-08-20price $9,900
-
2013-08-20soldstatus $9,750
-
2013-08-20soldstatus $19,500
-
2008-02-06soldstatus $12,000
-
2008-01-30price $15,900
-
2008-01-30soldstatus $12,000
ⓘ Source: listings_history table (triggers on properties + properties_extension) + one-shot
backfill from property_details.listing_events for pre-trigger history.
Tax reassessment forecast FL · Resets to sale price
- Current annual tax
- $1,083 · $90/mo
- Projected year-2 tax
- $2,490 · $207/mo
- Expected delta
- +$1,407/yr (+$117/mo · 130.0%)
ⓘ Screening estimate from a state-policy table — verify with the county assessor before closing.
Climate risk First Street
- Flood 1/10 Low FEMA zone X (unshaded) · 0% chance over 30 yrs
- Wildfire 4/10 Moderate
- Heat 10/10 Extreme 7 d/yr ≥107°F today · 29 d/yr by 30 yrs out
- Wind 10/10 Extreme 99% chance of damaging wind over 30 yrs
- Air quality 2/10 Low 1 unhealthy d/yr today · 1 by 30 yrs out
Nearby sold comps map
Loading sold comps map…
Walkable amenities ~0.75 mi
Loading nearby amenities…
Taxation est. · year 1
- Rental income
- $27,842
- − Mortgage interest
- −$16,805
- − Property taxes
- −$1,083
- − Insurance
- −$1,500
- − Repairs & maintenance
- −$2,227
- − Management
- −$2,227
- − Depreciation
- −$8,727
- Taxable loss
- −$4,727
- Est. tax savings @ 24.0%
- +$1,135
- After-tax cash flow
- $1,668/yr
For passive investors: Depreciation is non-cash, so a rental often shows a tax loss while cash-flowing — sheltering income. Rental losses are passive: they offset passive income freely, and up to $25,000/yr can offset ordinary (W-2) income if you actively participate and your MAGI is under $100k (phasing out to $0 by $150k); unused losses carry forward. On sale, claimed depreciation is recaptured at up to 25%, and gains may owe capital-gains tax (a 1031 exchange can defer both). Figures are a year-1 estimate at your 24.0% rate — not tax advice; consult a CPA.
Schools (NCES district)
- District
- Lee
- NCES district ID
- 1201080
- Math proficiency
- 47% ▼ -11.00%
- Reading proficiency
- 50% ▼ -4.00%
- Median HH income
- $49,518
- Composite
- 41.49/100
- National rank
- #3458
- State rank
- #42 of 73 in FL
Livability — Cape Coral
- Score
- 77/100
- State rank
- #208
- US rank
- #3098
Category grades
Schools grade is shown separately in the Schools card above.
Census & demographics
- Census place
- Cape Coral, FL
- County
- Lee County · 788,662 people
- City population
- 217,388
- Metro
- Cape Coral-Fort Myers, FL
- Population (ZIP)
- 40,231
- Household income
- $73,053
- Rent vs Own
- Severe rent burden
- 1657.0
Population outlook (Lee County) Hauer SSP2
- Today (2025)
- 871,946 people
- By 2030
- 955,468 · +9.6%
- By 2040
- 1,113,587 · +27.7%
- By 2050
- 1,256,891 · +44.1%
- By 2075
- 1,560,270 · +78.9%
- By 2100
- 1,726,848 · +98.0%
Race, ethnicity, and origin ACS 2023
- Neighborhood character
- Diverse neighborhood (Simpson 0.55)
- Race & ethnicity
- White 56% Hispanic / Latino 36% Two or more races 24% Black 3% Asian 1%
- Hispanic origin (detail)
- Puerto Rican 7% Cuban 14% Dominican 4%
- Common ancestry
- Romanian 2% Lithuanian 2% Serbian 1%
- Foreign-born
- 20% · Canada, Jamaica
- Languages at home
- 69% English-only · Spanish 27% Other Indo-European 1% German/W. Germanic 1%
Political lean MEDSL · Lee
- 2024 margin
- Strong R (+28.4) · D 35.5% · R 63.9%
- 2008→2024 swing
- -18.0pp toward R · 2008: -10.4pp · 2024: -28.4pp
- All cycles
- 2024: R+28.4 2020: R+19.2 2016: R+20.4 2012: R+16.6 2008: R+10.4
Not yet ingested
- Civics
- —
Market trends
- HPI YoY
- ▼ -94.24%
- Current HPI
- 313.8761
- Rent YoY
- ▼ -5.60%
- Metro
- Cape Coral-Fort Myers, FL
- State GDP YoY
- ▲ 3.28%
- F500 in state
- 36
Industry mix (Fortune 500 HQ in FL)
| Industry | F500 HQs | Revenue |
|---|---|---|
| Industrial Technology | 2 | $29B |
|
||
| Insurance | 2 | $17B |
|
||
| Retail | 1 | $60B |
|
||
| Technology Distribution | 1 | $58B |
|
||
| Homebuilding | 1 | $35B |
|
||
| Technology Manufacturing | 1 | $35B |
|
||
Price history
+1786.8% since first listed19 events — show timeline
- 2026-04-01 Pending — NAPLESMLS
- 2026-03-06 Price Changed $299,999 NAPLESMLS
- 2026-02-06 Price Changed $309,999 NAPLESMLS
- 2026-01-05 Listed $320,490 NAPLESMLS
- 2025-10-23 Sold (Public Records) $87,000 Public Records
- 2023-07-20 Sold (Public Records) $31,500 Public Records
- 2023-07-12 Sold (MLS) $31,500 FORTMLS
- 2023-04-28 Pending — FORTMLS
- 2023-03-28 Relisted — FORTMLS
- 2023-03-27 Pending — FORTMLS
- 2023-02-23 Price Changed $35,000 FORTMLS
- 2022-10-13 Listed $45,000 FORTMLS
- 2021-07-14 Sold (Public Records) $170,000 Public Records
- 2013-08-20 Sold (Public Records) $19,500 Public Records
- 2013-08-20 Sold (MLS) $9,750 FORTMLS
- 2013-08-20 Price Changed $9,900 FORTMLS
- 2008-02-06 Sold (Public Records) $12,000 Public Records
- 2008-01-30 Sold (MLS) $12,000 FORTMLS
- 2008-01-30 Price Changed $15,900 FORTMLS
Property tax history
+12.8%/yrLatest (2025): $1,083 · +8.8% YoY. Source: county tax records.
Cash-flow waterfall
monthlySold comps — $/sqft
last 12 mo · ≤1 miLoading sold comps…