 🏢 Co-op
2156 Cruger Ave Unit 3L · New York, NY
Flood risk 1/10 · Minimal
- FEMA flood zone
- X (unshaded)
- Chance of flooding over 30 yrs
- 0.0%
- Est. flood insurance / yr
- $507 – $1,088
Fire risk 1/10 · Minimal
- Est. fire insurance / yr
- $691 – $1,283
Heat risk 6/10 · Moderate
- Hot days now (above 99°F)
- 7 days/yr
- Hot days in 30 yrs
- 14 days/yr
Wind risk 6/10 · Moderate
- Chance of severe wind over 30 yrs
- 27.0%
Air-quality risk 3/10 · Minor
- Unhealthy air days now
- 3 days/yr
- Unhealthy air days in 30 yrs
- 4 days/yr
Risk factors via First Street. Map © Google.
Why this score? — see what drove the B grade
The composite is a weighted blend of 9 inputs, each scored 0–100. Each bar is that input's sub-score; the figure is the points it added to the 100-point composite (weight × sub-score).
- Cash flow +30.0/30.0
- 1% rule +10.0/10.0
- DSCR +10.0/10.0
- ARV discount +7.5/15.0
- Schools +5.0/10.0
- Rent growth +4.9/5.0
- Livability +3.8/5.0
- Condition / age +2.2/5.0
- Appreciation +0.0/10.0
$125,900
🖨 Deal sheet (PDF) 📄 Offer letter ✓ Due diligence
Listing remarks
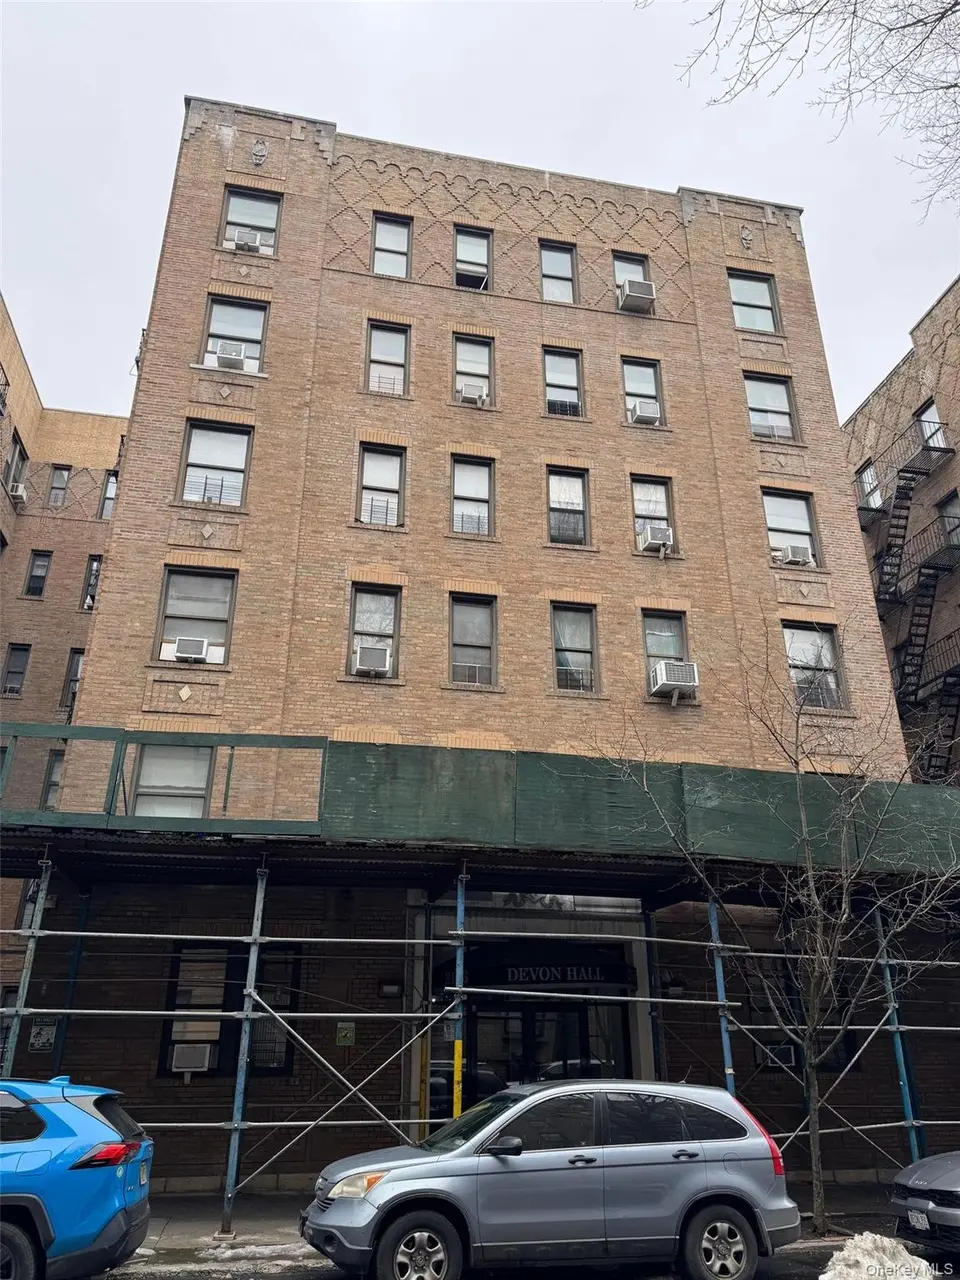
Spacoius one bedroom one bath co-op apartment located in a well maintained elavator building in the Pelham Parkway section of the Bronx. Shops, schools , public transportation and highways all in close proximity. Transfers will be subject to reporting when buyers use entities or trusts to take title to residential real estate, when the transaction is all-cash, privately financed or HELOC.
Key facts
- Built 1930
- Listed 120 days
Property features AI
Finance
- HOA & community: Association managed by HSC MANAGEMENT CORP.
Exterior
- Parking: No carport; No dedicated parking
- Utilities: Public sewer; Cable available; Electricity connected; Natural gas connected; Phone available; Sewer connected; Public trash collection; Water connected
- Home design: Stock cooperative
- Construction: Brick construction
- Exterior features: Brick construction; Not waterfront; No additional parcels
Interior
- Kitchen: Other appliances
- Bedrooms: Entry level: 3; Total rooms: 3
- Bathrooms: 1 full bathroom
- Heating & cooling: Hot water heating; Other heating; No cooling
- Interior features: Other interior features
Neighborhood map
What this means for you Summary
Snapshot
- This is a 1-bed/1.0-bath condo listed at $126k. Condition is rated fair.
Deal economics
- At list price, monthly cash flow is $973 ($12k/yr) — positive.
- The deal already cash-flows at list — no discount required.
- Meets the 1% rule at list price ($2k rent vs $126k).
- Recommended offer: $111k (12.0% below list) — sets the bar for market timing.
- Cap rate 15.6% vs local median 2.6% in New York — top-decile yield for the area; either an underpriced asset or a hidden risk that comps aren't pricing in. Stress-test before assuming the spread holds.
Location & tenants
- Location reads 75/100 on livability (#268 in NY, #4,188 nationally) — a middle-class / working-renter tenant base. Strengths: amenities A+, commute A+, health & safety A; Watch: crime F, cost of living F.
- Market conditions: Rents rising fast (+9.4%/yr); 191 active listings in the ZIP; 1 comparable units currently listed for rent nearby; 6,929 units permitted in Bronx County in 2024 (6,829 in 5+ unit buildings).
- At $2,333/mo this rent would consume 46% of the median local household income ($61k/yr) (locally 7650% of renters already pay >50% of income on rent) — very limited rent-growth headroom before tenants either downsize or default.
Forward outlook
- Local home prices are declining (-3.0%/yr); year-one equity from $870 of loan paydown is wiped out by about $4k of value loss. Plan a longer hold.
- Bronx County population projected at +21% by 2050 — long-run rental-demand tailwind backs the buy-and-hold thesis.
- At projected returns (-3.0% appreciation + 8.0% rent growth), your $35k cash investment doubles in ~4 years — after that, you're playing with house money.
Negotiation context
- It's been on market 121 days — a 12% lower offer ($111k) is reasonable based on typical stale-listing flexibility.
Risks & watch-outs
- Watch-outs: built in 1930 — expect roof / HVAC / electrical / plumbing capex.
- Climate carrying-cost: major wind risk, 27% chance of damaging wind over 30y; extreme-heat days projected 7→14/yr by 2055 (HVAC capex compounding) — expect insurance premiums to compound above CPI over the hold.
Questions for the listing agent
- It's been on market 121 days. Have you received any prior offers? Is the seller open to a 12% concession, seller financing, or rate buy-down credit?
- Have any recent inspections been done? Can we get a copy of the seller's disclosures and any deferred-maintenance estimates?
- Built in 1930 — when were the roof, HVAC, electrical panel, plumbing, and water heater last replaced?
- Any open or pending special assessments — roof, HVAC, plumbing, elevator, façade? What's the per-unit balance and payoff schedule, and is the seller paying it off at close or rolling it to the buyer?
- Why hasn't it sold? Are there any deal-killer items the seller is aware of (foundation, flood, title, zoning, code violations)?
- Is there a deadline driving the sale (1031 exchange, divorce, estate, relocation)? That informs how much negotiation room exists.
- Schools are B-rated — typically a magnet for longer-tenancy family renters. What's the average tenant stay here, and is there a school-zone premium baked into asking?
- Crime grade is F in this area — have there been break-ins, vandalism, or insurance claims at this property in the last 3 years? What carrier currently insures it and at what premium?
- What's the average days-on-market for RENTAL listings here right now (not sales)? A rising rental-DOM trend means longer vacancies and softer asking-rent achievability than the comps imply.
- What's the recent tenant-quality profile in this submarket — average credit score on applications, eviction rate, late-payment / NSF rate, and stable-employment percentage? A property-management company in the area should have these aggregated.
- How much new apartment / multifamily construction is in the pipeline within 1–3 miles? Heavy new supply (>2% of stock underway) typically softens rents 12–24 months out; light construction supports rent growth.
Investment metrics
- 1% rule
- 1.85% ✓
- Cap rate
- 15.57%
- Cash-on-cash
- 33.13%
- DSCR
- 2.47
- GRM
- 4.5
CMA / ARV
No comps found within radius.
Projected returns pro-forma
-3.0% appreciation · 8.0% rent growth · sell at horizon
- IRR
- 33.9%
- Equity multiple
- 2.53×
- Total profit
- $53,949
- Equity at exit
- $18,772
- IRR
- 43.4%
- Equity multiple
- 6.19×
- Total profit
- $183,058
- Equity at exit
- $10,886
Cash invested: $35,252 (down + closing). Projections, not guarantees.
Landlord ↔ Tenant lean methodology
- Overall (CITY)
- 0 Strongly Tenant-Friendly
- State New York
- 15 Strongly Tenant-Friendly · D+10
- County
- — inherits STATE
- City New York
- 0 Strongly Tenant-Friendly · D+34
ZIP-level market 10462
- Home prices YoY
- -10.4%
- Rents YoY
- 9.4%
- Active inventory
- 191
- Price-to-rent
- 4.5×
Monthly cashflow live
- Estimated rent
- $2,333 medium interval (Pro) →
- Mortgage (P&I)
- −$660
- Tax est. 1.5%
- −$157 /mo · $1,888/yr
- Insurance
- −$52
- HOA
- −$0
- Vacancy / Maint / Mgmt
- −$490
- Net cashflow
- $973
Break-even live
Sensitivity live
| Price | -10% $1,060 | -5% $1,017 | +0% $973 | +5% $930 | +10% $886 |
|---|---|---|---|---|---|
| Rent | -10% $789 | -5% $881 | +0% $973 | +5% $1,065 | +10% $1,158 |
| Rate | -1.0pp $1,037 | -0.5pp $1,005 | base $973 | +0.5pp $941 | +1.0pp $907 |
UW: 25.0% down · 7.5% · 30yr · 1.5% tax · 5.0% vac · 8.0% maint · 8.0% mgmt
Financing live
Cash to close
- Down payment
- $31,475
- Closing costs
- $3,777
- Reserves months
- —
- Total cash needed
- —
Loan-product check · same deal, 3 products live
Conventional
25% down · 7.5% · 30yr
- Down + closing
- —
- Monthly P&I
- —
- Monthly cashflow
- —
- DSCR
- —
- Eligible?
- —
Personal DTI + credit; lowest rate.
DSCR
20% down · 8.5% · 30yr
- Down + closing
- —
- Monthly P&I
- —
- Monthly cashflow
- —
- DSCR
- —
- Eligible?
- —
No personal income docs; deal must DSCR.
Hard money
10% down · 12.0% · 12mo
- Down + closing
- —
- Monthly P&I
- —
- Monthly cashflow
- —
- DSCR
- —
- Eligible?
- —
Short-term bridge; refi at stabilization.
Rent comps 1 comps
| Address | Beds | Baths | Sqft | Rent | $/sqft | DOM | Units | Dist |
|---|---|---|---|---|---|---|---|---|
| 1250 Pelham Pkwy S Unit B Bronx, NY | 1.0 | 1.0 | 725 | $2,850 | $3.93 | 25d | 1 | 0.83mi |
HOA detail condo
- Monthly dues
- $0 · $0/yr
- Assessments
- None detected in remarks — confirm with the listing agent.
Listing history 15 events
-
2026-06-21days on market $125,900 Active 121 DOM
-
2026-06-18days on market $125,900 Active 118 DOM
-
2026-06-17price $125,900 Active 117 DOM
-
2026-06-17days on market $127,900 Active 117 DOM
-
2026-06-15days on market $127,900 Active 115 DOM
-
2026-06-13days on market $127,900 Active 113 DOM
-
2026-06-10days on market $127,900 Active 109 DOM
-
2026-06-08days on market $127,900 Active 108 DOM
-
2026-06-08days on market $127,900 Active 107 DOM
-
2026-06-04days on market $127,900 Active 104 DOM
-
2026-06-03days on market $127,900 Active 103 DOM
-
2026-06-01days on market $127,900 Active 101 DOM
-
2026-05-31days on market $127,900 Active 100 DOM
-
2026-04-30price $127,900
-
2026-02-19$129,900 Active
ⓘ Source: listings_history table (triggers on properties + properties_extension) + one-shot
backfill from property_details.listing_events for pre-trigger history.
Climate risk First Street
- Flood 1/10 Low FEMA zone X (unshaded) · 0% chance over 30 yrs
- Wildfire 1/10 Low
- Heat 6/10 Major 7 d/yr ≥99°F today · 14 d/yr by 30 yrs out
- Wind 6/10 Major 27% chance of damaging wind over 30 yrs
- Air quality 3/10 Moderate 3 unhealthy d/yr today · 4 by 30 yrs out
Nearby sold comps map
Loading sold comps map…
Walkable amenities ~0.75 mi
Loading nearby amenities…
Taxation est. · year 1
- Rental income
- $27,999
- − Mortgage interest
- −$7,052
- − Property taxes
- −$1,888
- − Insurance
- −$630
- − Repairs & maintenance
- −$2,240
- − Management
- −$2,240
- − Depreciation
- −$3,663
- Taxable income
- $10,286
- Est. tax owed @ 24.0%
- −$2,469
- After-tax cash flow
- $9,210/yr
For passive investors: Depreciation is non-cash, so a rental often shows a tax loss while cash-flowing — sheltering income. Rental losses are passive: they offset passive income freely, and up to $25,000/yr can offset ordinary (W-2) income if you actively participate and your MAGI is under $100k (phasing out to $0 by $150k); unused losses carry forward. On sale, claimed depreciation is recaptured at up to 25%, and gains may owe capital-gains tax (a 1031 exchange can defer both). Figures are a year-1 estimate at your 24.0% rate — not tax advice; consult a CPA.
Condition & rehab AI · 13 photos
A moderate rehab project is needed to address roof and exterior paint issues, with updates to kitchen and bath also recommended for increased value.
Repairs flagged
- Major roof — visible wear on roof tiles
- Moderate exterior paint — brick facade appears faded
Value-add opportunities
- Both painting exterior and interior — enhances curb appeal and interior aesthetics
- Both HVAC upgrade — improves comfort and energy efficiency
- Both kitchen and bath updates — modernizes spaces and increases appeal
Renovation cost estimate screening
| Repair item | Severity | Est. cost |
|---|---|---|
| roof · visible wear on roof tiles | Major | $15,000–50,000 |
| exterior paint · brick facade appears faded | Moderate | $3,000–15,000 |
| Total estimated repair cost · 2 items | $18,000–65,000 |
Value-add ROI direction
- Both painting exterior and interior — enhances curb appeal and interior aesthetics ↑
- Both HVAC upgrade — improves comfort and energy efficiency ↑
- Both kitchen and bath updates — modernizes spaces and increases appeal ↑
ⓘ Cost ranges are severity-bucket heuristics (US national rule-of-thumb). Get contractor quotes + a written scope before underwriting a rehab budget.
Schools (NCES district)
No district data.
Livability — New York
- Score
- 75/100
- State rank
- #268
- US rank
- #4188
Category grades
Schools grade is shown separately in the Schools card above.
Census & demographics
- Census place
- New York, NY
- County
- Bronx County · 1,197,324 people
- City population
- 7,731,280
- Metro
- New York-Newark-Jersey City, NY-NJ-PA
- Population (ZIP)
- 76,320
- Household income
- $60,966
- Rent vs Own
- Severe rent burden
- 7650.0
Population outlook (Bronx County) Hauer SSP2
- Today (2025)
- 1,607,353 people
- By 2030
- 1,681,852 · +4.6%
- By 2040
- 1,824,421 · +13.5%
- By 2050
- 1,945,470 · +21.0%
- By 2075
- 2,187,887 · +36.1%
- By 2100
- 2,244,136 · +39.6%
Race, ethnicity, and origin ACS 2023
- Neighborhood character
- Diverse neighborhood (Simpson 0.70)
- Race & ethnicity
- Hispanic / Latino 46% Black 22% Asian 18% White 10% Two or more races 9% Native American 1%
- Hispanic origin (detail)
- Mexican 4% Puerto Rican 17% Dominican 15%
- Foreign-born
- 34% · Canada, China, Vietnam
- Languages at home
- 39% English-only · Spanish 36% Other Indo-European 16% Arabic 3%
Political lean MEDSL · Bronx
- 2024 margin
- Solid D (+45.4) · D 72.7% · R 27.3%
- 2008→2024 swing
- -32.3pp toward R · 2008: 77.8pp · 2024: 45.4pp
- All cycles
- 2024: D+45.4 2020: D+67.6 2016: D+79.1 2012: D+82.9 2008: D+77.8
Not yet ingested
- Civics
- —
Market trends
- HPI YoY
- ▼ -41.59%
- Current HPI
- 356.326
- Rent YoY
- ▲ 9.43%
- Metro
- New York-Newark-Jersey City, NY-NJ-PA
- State GDP YoY
- ▲ 2.60%
- F500 in state
- 92
Industry mix (Fortune 500 HQ in NY)
| Industry | F500 HQs | Revenue |
|---|---|---|
| Financial Services | 10 | $950B |
|
||
| Consumer Goods | 9 | $162B |
|
||
| Insurance | 4 | $225B |
|
||
| Telecommunications | 2 | $144B |
|
||
| Pharmaceuticals | 2 | $112B |
|
||
| Media / Entertainment | 2 | $69B |
|
||
Price history
-1.5% since first listed2 events — show timeline
- 2026-04-30 Price Changed $127,900 OneKey® MLS as Distributed by MLS Grid
- 2026-02-19 Listed $129,900 OneKey® MLS as Distributed by MLS Grid
Cash-flow waterfall
monthlySold comps — $/sqft
last 12 mo · ≤1 miLoading sold comps…