5253 N Lovers Lane Road Rd N #301 · Milwaukee, WI
Flood risk 1/10 · Minimal
- FEMA flood zone
- X (unshaded)
- Chance of flooding over 30 yrs
- 0.0%
- Est. flood insurance / yr
- $507 – $1,088
Fire risk 1/10 · Minimal
- Est. fire insurance / yr
- $636 – $1,182
Heat risk 2/10 · Minimal
- Hot days now (above 101°F)
- 7 days/yr
- Hot days in 30 yrs
- 13 days/yr
Wind risk 2/10 · Minimal
- Chance of severe wind over 30 yrs
- —
Air-quality risk 2/10 · Minimal
- Unhealthy air days now
- 1 days/yr
- Unhealthy air days in 30 yrs
- 2 days/yr
Risk factors via First Street. Map © Google.
Why this score? — see what drove the D grade
The composite is a weighted blend of 9 inputs, each scored 0–100. Each bar is that input's sub-score; the figure is the points it added to the 100-point composite (weight × sub-score).
- Cash flow +12.2/30.0
- ARV discount +7.5/15.0
- 1% rule +7.2/10.0
- Rent growth +4.3/5.0
- Livability +4.0/5.0
- DSCR +3.6/10.0
- Condition / age +2.5/5.0
- Schools +1.2/10.0
- Appreciation +0.0/10.0
$109,900
🖨 Deal sheet (PDF) 📄 Offer letter ✓ Due diligence
Listing remarks MLS
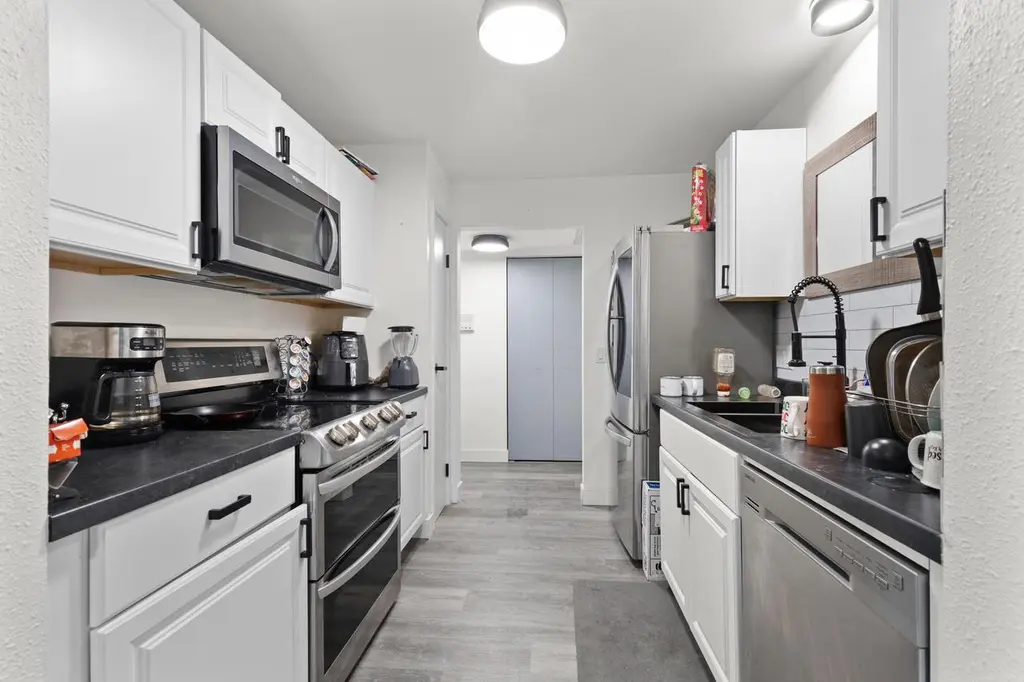
Mint condition 2BR, 2BA Condo at popular Newport West! Remodeled KIT w/ some newer appliances, newer floor & KIT cabinets. Newer carpeting, newer C/A & lots of storage. Huge MBR has adjoining BA. Heated underground parking, clubhouse, pool & elevators. Monthly fee includes heat. Pets not allowed. Nice unit!
Key facts
- Outdoor pool
- Laundry rooms
- Community room
Tags
Property features AI
Finance
- HOA & community: Monthly condo fee of $350; Building amenities include elevator, outdoor pool, pool, laundry facilities, and security; 120 units in the building/association; Condominium name: Newport West
Exterior
- Parking: Attached underground garage with 1 parking space
- Security: Building security
- Utilities: Municipal water; Municipal sewer; Electric service
- Home design: Condo in a midrise (3–5 stories) building; One-story unit; Located in the city of Milwaukee; Zoned RM2
- Construction: Brick/stone construction; Assessor/public record used for year built
- Exterior features: Brick and brick/stone exterior
Interior
- Kitchen: Dishwasher; Oven; Range; Refrigerator; Garbage disposal; Microwave
- Flooring: Wood or simulated wood floors
- Bathrooms: Two full bathrooms; Master bathroom with tub/shower combo; Separate tub-only bath; Shower stall
- Heating & cooling: Central air; Forced air; Radiant/hot water heating; Electric heat source
- Interior features: Cable/satellite available; Storage lockers; Wood or simulated wood floors
- Laundry & utility: Laundry facilities in the building
Neighborhood map
What this means for you Summary
Snapshot
- This is a 2-bed/2.0-bath condo listed at $110k.
Deal economics
- At list price, monthly cash flow is $-22 ($-269/yr) — negative.
- To cash-flow at today's rent, offer at most $106k (3.6% below list).
- Meets the 1% rule at list price ($1k rent vs $110k).
- Recommended offer: $106k (3.6% below list) — sets the bar for cash-flow.
Location & tenants
- Location reads 81/100 on livability (#55 in WI, #1,534 nationally) — a professional / high-income tenant draw. Strengths: amenities A+, commute A+, cost of living A+; Watch: employment D+, schools F, crime F.
- Milwaukee School District (urban): math 10% / reading 18% proficiency, ranked #337 of 342 in WI (top 98%) — low school quality limits family demand, transient renter base, plan for 1-2y turnover; 77% free/reduced lunch — lower-income household profile, screen leases tightly.
- Market conditions: Rents rising fast (+7.1%/yr); 45 active listings in the ZIP; 17 comparable units currently listed for rent nearby; rentals at typical pace (median 17d on market — plan ~3-4 weeks tenant-placement turnaround); 1,017 units permitted in Milwaukee County in 2024 (803 in 5+ unit buildings).
Forward outlook
- Local home prices are declining (-3.0%/yr); year-one equity from $760 of loan paydown is wiped out by about $3k of value loss. Plan a longer hold.
- Milwaukee County population projected at +4% by 2050 — modest demand growth; plan on rents tracking national, not racing it.
Negotiation context
- It's been on market 19 days — a 2% lower offer ($108k) is reasonable based on typical stale-listing flexibility.
- 2 sale attempts since 13y ago with the ask held roughly flat each time — persistent listings suggest the price (not the market) is what's stuck; bring a comps-based counter.
Risks & watch-outs
- Watch-outs: HOA is 26% of rent.
Questions for the listing agent
- What do current leases actually rent for vs. the listed asking? Can we see a recent rent roll and the last 12 months of T-12 income?
- Built in 1972 — when were the roof, HVAC, electrical panel, plumbing, and water heater last replaced?
- What does the HOA fee cover, when was the last increase, and are there any pending special assessments or reserve-fund shortfalls?
- Any open or pending special assessments — roof, HVAC, plumbing, elevator, façade? What's the per-unit balance and payoff schedule, and is the seller paying it off at close or rolling it to the buyer?
- Is there a deadline driving the sale (1031 exchange, divorce, estate, relocation)? That informs how much negotiation room exists.
- Schools are F-rated, which usually means shorter tenancies and higher turnover. Who's the typical renter profile here, and what's been the actual vacancy rate?
- Crime grade is F in this area — have there been break-ins, vandalism, or insurance claims at this property in the last 3 years? What carrier currently insures it and at what premium?
- The area grade is low — what's the realistic commute time and amenity access for the typical tenant pool here? Any planned neighborhood developments (good or bad) we should know about?
- What's the average days-on-market for RENTAL listings here right now (not sales)? A rising rental-DOM trend means longer vacancies and softer asking-rent achievability than the comps imply.
- What's the recent tenant-quality profile in this submarket — average credit score on applications, eviction rate, late-payment / NSF rate, and stable-employment percentage? A property-management company in the area should have these aggregated.
- How much new apartment / multifamily construction is in the pipeline within 1–3 miles? Heavy new supply (>2% of stock underway) typically softens rents 12–24 months out; light construction supports rent growth.
Investment metrics
- 1% rule
- 1.22% ✓
- Cap rate
- 6.05%
- Cash-on-cash
- -0.87%
- DSCR
- 0.96
- GRM
- 6.8
CMA / ARV
No comps found within radius.
Projected returns pro-forma
-3.0% appreciation · 7.14% rent growth · sell at horizon
- IRR
- -11.2%
- Equity multiple
- 0.57×
- Total profit
- $-13,209
- Equity at exit
- $16,386
- IRR
- 4.8%
- Equity multiple
- 1.44×
- Total profit
- $13,504
- Equity at exit
- $9,502
Cash invested: $30,772 (down + closing). Projections, not guarantees.
Landlord ↔ Tenant lean methodology
- Overall (STATE)
- 73 Landlord-Friendly
- State Wisconsin
- 73 Landlord-Friendly · R+2
- County
- — inherits STATE
- City
- — inherits STATE
ZIP-level market 53225
- Home prices YoY
- -21.1%
- Rents YoY
- 7.1%
- Active inventory
- 45
- Price-to-rent
- 6.8×
Monthly cashflow live
- Estimated rent
- $1,339 high interval (Pro) →
- Mortgage (P&I)
- −$576
- Tax from tax record
- −$108 /mo · $1,293/yr
- Insurance
- −$46
- HOA
- −$350
- Vacancy / Maint / Mgmt
- −$281
- Net cashflow
- $-22
Break-even live
Sensitivity live
| Price | -10% $40 | -5% $9 | +0% $-22 | +5% $-53 | +10% $-85 |
|---|---|---|---|---|---|
| Rent | -10% $-128 | -5% $-75 | +0% $-22 | +5% $30 | +10% $83 |
| Rate | -1.0pp $33 | -0.5pp $6 | base $-22 | +0.5pp $-51 | +1.0pp $-80 |
UW: 25.0% down · 7.5% · 30yr · 1.5% tax · 5.0% vac · 8.0% maint · 8.0% mgmt
Financing live
Cash to close
- Down payment
- $27,475
- Closing costs
- $3,297
- Reserves months
- —
- Total cash needed
- —
Loan-product check · same deal, 3 products live
Conventional
25% down · 7.5% · 30yr
- Down + closing
- —
- Monthly P&I
- —
- Monthly cashflow
- —
- DSCR
- —
- Eligible?
- —
Personal DTI + credit; lowest rate.
DSCR
20% down · 8.5% · 30yr
- Down + closing
- —
- Monthly P&I
- —
- Monthly cashflow
- —
- DSCR
- —
- Eligible?
- —
No personal income docs; deal must DSCR.
Hard money
10% down · 12.0% · 12mo
- Down + closing
- —
- Monthly P&I
- —
- Monthly cashflow
- —
- DSCR
- —
- Eligible?
- —
Short-term bridge; refi at stabilization.
Rent comps 17 comps
| Address | Beds | Baths | Sqft | Rent | $/sqft | DOM | Units | Dist |
|---|---|---|---|---|---|---|---|---|
| 11049 W Hampton Ave Unit 1 Milwaukee, WI | 2.0 | 1.0 | 950 | $1,100 | $1.16 | 45d | 1 | 0.64mi |
| 11049 W Hampton Ave Apt 4 Milwaukee, WI | 2.0 | 1.0 | 950 | $1,295 | $1.36 | 6d | 1 | 0.64mi |
| 11027 W Hampton Ave Apt 3 Milwaukee, WI | 2.0 | 1.0 | 950 | $1,295 | $1.36 | 6d | 1 | 0.66mi |
| 11027 W Hampton Ave Unit 4 Milwaukee, WI | 2.0 | 1.0 | 950 | $1,350 | $1.42 | 45d | 1 | 0.66mi |
| 10431 W Rohr Ave Milwaukee, WI | 3.0 | 1.0 | 1010 | $2,000 | $1.98 | 5d | 1 | 0.66mi |
| 5824 N 117th St Milwaukee, WI | 3.0 | 2.0 | 1146 | $1,695 | $1.48 | 6d | 1 | 0.72mi |
| 4824 N 104th St Unit 12 Milwaukee, WI | 3.0 | 2.0 | 1300 | $1,510 | $1.16 | 19d | 1 | 0.88mi |
| 5951 N Lovers Lane Rd Milwaukee, WI | 2.0 | 2.0 | 1000 | $1,195 | $1.20 | 5d | 1 | 0.89mi |
| 4812 N 104th St Apt 4 Milwaukee, WI | 2.0 | 1.5 | 1000 | $1,285 | $1.28 | 45d | 1 | 0.89mi |
| 12804 W Hampton Ave Butler, WI | 2.0 | 1.0 | 800 | $1,200 | $1.50 | 45d | 1 | 0.97mi |
| 10628 W Bobolink Ave Milwaukee, WI | 2.0 | 1.0 | 725 | $1,195 | $1.65 | 4d | 1 | 1.01mi |
| 10628 W Bobolink Ave Milwaukee, WI | 2.0 | 1.0 | 700 | $1,295 | $1.85 | 16d | 1 | 1.01mi |
| 12811 W Hampton Ave Butler, WI | 2.0 | 1.0 | 1000 | $1,225 | $1.23 | 23d | 1 | 1.03mi |
| 4718 N 100th St Milwaukee, WI | 2.0 | 1.5–2.0 | 1200 | $1,625 | $1.35 | 25d | 1 | 1.23mi |
| 5721 N 94th St Milwaukee, WI | 2.0 | 1.0 | 1050 | $1,175 | $1.12 | 16d | 2 | 1.46mi |
| 9800 W Menomonee Park Ct Milwaukee, WI | 2.0 | 1.5 | 850 | $970 | $1.14 | 6d | 1 | 1.47mi |
| 4225 N 104th St Unit 2 Milwaukee, WI | 2.0 | 1.5 | 1000 | $1,250 | $1.25 | 45d | 1 | 1.48mi |
HOA detail condo
- Monthly dues
- $350 · $4,200/yr
- Likely covers
- pool
- Assessments
- None detected in remarks — confirm with the listing agent.
Listing history 13 events
-
2026-06-21days on market $109,900 Active 19 DOM
-
2026-06-18days on market $109,900 Active 16 DOM
-
2026-06-17days on market $109,900 Active 15 DOM
-
2026-06-16days on market $109,900 Active 14 DOM
-
2026-06-15days on market $109,900 Active 13 DOM
-
2026-06-13days on market $109,900 Active 11 DOM
-
2026-06-13days on market $109,900 Active 10 DOM
-
2026-06-09days on market $109,900 Active 7 DOM
-
2026-06-08days on market $109,900 Active 6 DOM
-
2026-06-07days on market $109,900 Active 5 DOM
-
2026-06-05days on market $109,900 Active 2 DOM
-
2026-06-03remarks 559-char remark
-
2026-06-03$109,900 Active 1 DOM
ⓘ Source: listings_history table (triggers on properties + properties_extension) + one-shot
backfill from property_details.listing_events for pre-trigger history.
Tax reassessment forecast WI · Partial reset (capped growth)
- Current annual tax
- $1,293 · $108/mo
- Projected year-2 tax
- $1,663 · $139/mo
- Expected delta
- +$370/yr (+$31/mo · 28.6%)
ⓘ Screening estimate from a state-policy table — verify with the county assessor before closing.
Climate risk First Street
- Flood 1/10 Low FEMA zone X (unshaded) · 0% chance over 30 yrs
- Wildfire 1/10 Low
- Heat 2/10 Low 7 d/yr ≥101°F today · 13 d/yr by 30 yrs out
- Wind 2/10 Low
- Air quality 2/10 Low 1 unhealthy d/yr today · 2 by 30 yrs out
Nearby sold comps map
Loading sold comps map…
Walkable amenities ~0.75 mi
Loading nearby amenities…
Taxation est. · year 1
- Rental income
- $16,063
- − Mortgage interest
- −$6,156
- − Property taxes
- −$1,293
- − Insurance
- −$550
- − Repairs & maintenance
- −$1,285
- − Management
- −$1,285
- − HOA
- −$4,200
- − Depreciation
- −$3,197
- Taxable loss
- −$1,903
- Est. tax savings @ 24.0%
- +$457
- After-tax cash flow
- $188/yr
For passive investors: Depreciation is non-cash, so a rental often shows a tax loss while cash-flowing — sheltering income. Rental losses are passive: they offset passive income freely, and up to $25,000/yr can offset ordinary (W-2) income if you actively participate and your MAGI is under $100k (phasing out to $0 by $150k); unused losses carry forward. On sale, claimed depreciation is recaptured at up to 25%, and gains may owe capital-gains tax (a 1031 exchange can defer both). Figures are a year-1 estimate at your 24.0% rate — not tax advice; consult a CPA.
Schools (NCES district)
- District
- Milwaukee School District
- NCES district ID
- 5509600
- Math proficiency
- 10% ▼ -5.00%
- Reading proficiency
- 18% ▬ 0.00%
- Median HH income
- $36,339
- Composite
- 11.61/100
- National rank
- #9696
- State rank
- #337 of 342 in WI
Livability — Milwaukee
- Score
- 81/100
- State rank
- #55
- US rank
- #1534
Category grades
Schools grade is shown separately in the Schools card above.
Census & demographics
- Census place
- Milwaukee, WI
- County
- Milwaukee County · 926,379 people
- City population
- 573,768
- Metro
- Milwaukee-Waukesha, WI
- Population (ZIP)
- 25,187
- Household income
- $56,545
- Rent vs Own
- Severe rent burden
- 1391.0
Population outlook (Milwaukee County) Hauer SSP2
- Today (2025)
- 995,758 people
- By 2030
- 1,009,124 · +1.3%
- By 2040
- 1,028,128 · +3.3%
- By 2050
- 1,040,066 · +4.4%
- By 2075
- 1,057,849 · +6.2%
- By 2100
- 1,039,774 · +4.4%
Race, ethnicity, and origin ACS 2023
- Neighborhood character
- Diverse neighborhood (Simpson 0.59)
- Race & ethnicity
- Black 58% White 26% Two or more races 7% Asian 6% Hispanic / Latino 5%
- Hispanic origin (detail)
- Mexican 2% Puerto Rican 3%
- Common ancestry
- Romanian 2% Lithuanian 2% Iranian 1%
- Foreign-born
- 8% · Canada, Vietnam
- Languages at home
- 89% English-only · Other Asian/Pacific 4% Spanish 3% Other Indo-European 1%
Political lean MEDSL · Milwaukee
- 2024 margin
- Solid D (+38.5) · D 68.3% · R 29.8% · Other 1.8%
- 2008→2024 swing
- +2.7pp toward D · 2008: 35.9pp · 2024: 38.5pp
- All cycles
- 2024: D+38.5 2020: D+39.9 2016: D+37.5 2012: D+34.6 2008: D+35.9
Not yet ingested
- Civics
- —
Market trends
- HPI YoY
- ▼ -70.59%
- Current HPI
- 264.1941
- Rent YoY
- ▲ 7.14%
- Metro
- Milwaukee-Waukesha, WI
- State GDP YoY
- ▲ 2.10%
- F500 in state
- 20
Industry mix (Fortune 500 HQ in WI)
| Industry | F500 HQs | Revenue |
|---|---|---|
| Industrial Machinery | 4 | $23B |
|
||
| Industrial Technology | 2 | $36B |
|
||
| Insurance | 1 | $36B |
|
||
| Professional Services | 1 | $19B |
|
||
| Utilities | 1 | $9B |
|
||
| Consumer Goods | 1 | $3B |
|
||
Price history
+174.8% since first listed7 events — show timeline
- 2026-06-02 Listed $109,900 METROMLS
- 2025-07-03 Sold (Public Records) $103,000 Public Records
- 2013-07-11 Listing Removed — METROMLS
- 2013-07-11 Listed $71,500 METROMLS
- 2006-12-05 Sold (Public Records) $66,000 Public Records
- 2006-10-13 Sold (MLS) $66,000 METROMLS
- 1992-10-01 Sold (Public Records) $40,000 Public Records
Property tax history
-0.3%/yrLatest (2024): $1,293 · +2.1% YoY. Source: county tax records.
Cash-flow waterfall
monthlySold comps — $/sqft
last 12 mo · ≤1 miLoading sold comps…