 7-Plex
1041 Calla Ave · Imperial Beach, CA
Flood risk 1/10 · Minimal
- FEMA flood zone
- X (unshaded)
- Chance of flooding over 30 yrs
- 0.0%
- Est. flood insurance / yr
- $507 – $1,088
Fire risk 4/10 · Minor
- Est. fire insurance / yr
- $659 – $1,223
Heat risk 4/10 · Minor
- Hot days now (above 84°F)
- 7 days/yr
- Hot days in 30 yrs
- 21 days/yr
Wind risk 1/10 · Minimal
- Chance of severe wind over 30 yrs
- —
Air-quality risk 1/10 · Minimal
- Unhealthy air days now
- 0 days/yr
- Unhealthy air days in 30 yrs
- 0 days/yr
Risk factors via First Street. Map © Google.
Why this score? — see what drove the D grade
The composite is a weighted blend of 9 inputs, each scored 0–100. Each bar is that input's sub-score; the figure is the points it added to the 100-point composite (weight × sub-score).
- Cash flow +13.0/30.0
- ARV discount +8.1/15.0
- DSCR +3.9/10.0
- Schools +3.9/10.0
- 1% rule +3.7/10.0
- Livability +3.0/5.0
- Rent growth +2.9/5.0
- Condition / age +2.5/5.0
- Appreciation +0.0/10.0
$2,095,000
🖨 Deal sheet (PDF) 📄 Offer letter ✓ Due diligence
Multi-family units
County records classify this as Multi-Family (5+ Unit). Listing-text estimate: 7 units. confirmed
5+ unit building — per-unit beds/baths from public records are typically unavailable; the breakdown below (if shown) is an estimate from the listing text.
Listing remarks
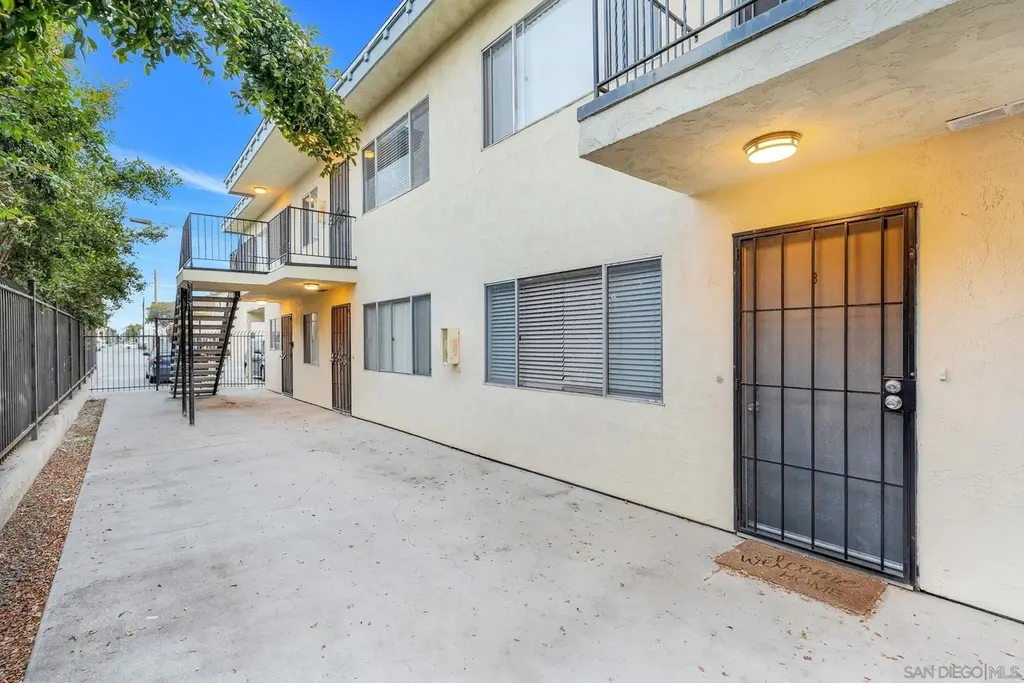
1041 Calla Ave in Imperial Beach offers a rare opportunity to own a 7-unit apartment property just minutes from the beach, shopping, dining, and entertainment. Comprised of six 2 bed / 1 bath units and one 1 bed / 1 bath unit, the property is ideally located in a highly walkable neighborhood with a walk score of 85, giving residents easy access to both coastal living and everyday conveniences. The property features a refreshed exterior along with full fencing and gated access. Three units have been fully updated, two units have been partially updated, and two units remain mostly original, offering additional upside potential for a new owner. A full 3D Matterport scan of the entire property
Key facts
- Full fencing
- Refreshed exterior
- Walk score of 85
Tags
Property features AI
Exterior
- Parking: Total of 9 parking spaces
- Home design: Residential income property (multi-unit/commercial-residential)
- Construction: Zoned R-4 (multifamily)
- Exterior features: Composition roof
Interior
- Bathrooms: Six full bathrooms
- Heating & cooling: No cooling system listed
- Interior features: No central cooling
Neighborhood map
What this means for you Summary
Snapshot
- This is a 6×2bd/1ba + 1×1bd/1ba units multifamily listed at $2.10M.
Deal economics
- At list price, monthly cash flow is $-127 ($-2k/yr) — negative. Per door: $-18/mo.
- To cash-flow at today's rent, offer at most $2.07M (1.1% below list).
- To meet the 1% rule (rent ≥ 1% of price), the offer needs to be $1.83M (12.8% below list).
- Recommended offer: $1.83M (12.8% below list) — sets the bar for 1% rule.
- Cap rate 6.2% vs local median 2.3% in Imperial Beach — top-decile yield for the area; either an underpriced asset or a hidden risk that comps aren't pricing in. Stress-test before assuming the spread holds.
Location & tenants
- Location reads 60/100 on livability (#573 in CA) — a middle-class / working-renter tenant base. Strengths: commute A+, housing B; Watch: crime D+, schools F, amenities F.
- Sweetwater Union High (suburban): math 36% / reading 52% proficiency, ranked #187 of 517 in CA (top 36%) — families likely to look elsewhere, expect single-tenant / working-renter base with shorter leases.
- Market conditions: Rents rising (+1.8%/yr); 139 active listings in the ZIP; solid renter incomes; 11,759 units permitted in San Diego County in 2024 (7,244 in 5+ unit buildings).
- At $18,271/mo this rent would consume 255% of the median local household income ($86k/yr) (locally 1654% of renters already pay >50% of income on rent) — very limited rent-growth headroom before tenants either downsize or default.
Forward outlook
- Local home prices are declining (-3.0%/yr); year-one equity from $14k of loan paydown is wiped out by about $63k of value loss. Plan a longer hold.
- San Diego County population projected at +20% by 2050 — long-run rental-demand tailwind backs the buy-and-hold thesis.
Negotiation context
- It's been on market 22 days — a 2% lower offer ($2.06M) is reasonable based on typical stale-listing flexibility.
- 4 sale attempts since 3y ago with the ask held roughly flat each time — persistent listings suggest the price (not the market) is what's stuck; bring a comps-based counter.
- Current owner paid $107k; list at $2.10M implies a 1858% gain — meaningful room to come down on a strong offer.
Questions for the listing agent
- What do current leases actually rent for vs. the listed asking? Can we see a recent rent roll and the last 12 months of T-12 income?
- Can we see the unit-by-unit rent roll, current vacancy, and any below-market leases? What's the average tenancy length?
- What capital expenditures (roof, boiler, parking lot, exteriors) have been made in the last 5 years, and what's planned in the next 2?
- Built in 1971 — when were the roof, HVAC, electrical panel, plumbing, and water heater last replaced?
- Is there a deadline driving the sale (1031 exchange, divorce, estate, relocation)? That informs how much negotiation room exists.
- Schools are F-rated, which usually means shorter tenancies and higher turnover. Who's the typical renter profile here, and what's been the actual vacancy rate?
- Crime grade is D in this area — have there been break-ins, vandalism, or insurance claims at this property in the last 3 years? What carrier currently insures it and at what premium?
- The area grade is low — what's the realistic commute time and amenity access for the typical tenant pool here? Any planned neighborhood developments (good or bad) we should know about?
- What's the average days-on-market for RENTAL listings here right now (not sales)? A rising rental-DOM trend means longer vacancies and softer asking-rent achievability than the comps imply.
- What's the recent tenant-quality profile in this submarket — average credit score on applications, eviction rate, late-payment / NSF rate, and stable-employment percentage? A property-management company in the area should have these aggregated.
- How much new apartment / multifamily construction is in the pipeline within 1–3 miles? Heavy new supply (>2% of stock underway) typically softens rents 12–24 months out; light construction supports rent growth.
Investment metrics
- 1% rule
- 0.87% ✗
- Cap rate
- 6.22%
- Cash-on-cash
- -0.26%
- DSCR
- 0.99
- GRM
- 9.6
CMA / ARV
- ARV (on-the-fly)
- $2,121,408
- Comps found
- 1
Show comp detail 1 sale within ~0.75 mi
| Address | Dist | Beds/Ba | Sqft | Sold | Price | $/sf | Match |
|---|---|---|---|---|---|---|---|
| 565-67 Florida St | 0.15mi | 12/6.0 (-1) | 5,861 (+5%) | 15mo | $2,235,000 | $381 | 62 |
Match score weights: distance 35% · size 25% · config 20% · recency 20%. Top-matched comps best support the ARV.
Projected returns pro-forma
-3.0% appreciation · 1.77% rent growth · sell at horizon
- IRR
- -18.1%
- Equity multiple
- 0.37×
- Total profit
- $-369,552
- Equity at exit
- $312,371
- IRR
- -12.9%
- Equity multiple
- 0.28×
- Total profit
- $-420,276
- Equity at exit
- $181,137
Cash invested: $586,600 (down + closing). Projections, not guarantees.
Landlord ↔ Tenant lean methodology
- Overall (STATE)
- 18 Strongly Tenant-Friendly
- State California
- 18 Strongly Tenant-Friendly · D+13
- County
- — inherits STATE
- City
- — inherits STATE
ZIP-level market 91932
- Rents YoY
- 1.8%
- Active inventory
- 139
- Price-to-rent
- 66.3×
Monthly cashflow live
- Estimated rent
- $18,271 high interval (Pro) →
- Mortgage (P&I)
- −$10,986
- Tax from tax record
- −$2,701 /mo · $32,416/yr
- Insurance
- −$873
- HOA
- −$0
- Vacancy / Maint / Mgmt
- −$3,837
- Net cashflow
- $-127
Break-even live
Sensitivity live
| Price | -10% $1,059 | -5% $466 | +0% $-127 | +5% $-720 | +10% $-1,312 |
|---|---|---|---|---|---|
| Rent | -10% $-1,570 | -5% $-848 | +0% $-127 | +5% $595 | +10% $1,317 |
| Rate | -1.0pp $929 | -0.5pp $406 | base $-127 | +0.5pp $-669 | +1.0pp $-1,222 |
7-unit breakdown (identical units grouped — click to expand)
| Units | Beds | Baths | Est. rent |
|---|---|---|---|
| 6× units | 2 | 1 | $15,804 |
| #1 | 2 | 1 | $2,634 |
| #2 | 2 | 1 | $2,634 |
| #3 | 2 | 1 | $2,634 |
| #4 | 2 | 1 | $2,634 |
| #5 | 2 | 1 | $2,634 |
| #6 | 2 | 1 | $2,634 |
| 1× unit | 1 | 1 | $2,468 |
| Total (7 units) | $18,271 | ||
UW: 25.0% down · 7.5% · 30yr · 1.5% tax · 5.0% vac · 8.0% maint · 8.0% mgmt
Financing live
Cash to close
- Down payment
- $523,750
- Closing costs
- $62,850
- Reserves months
- —
- Total cash needed
- —
Loan-product check · same deal, 3 products live
Conventional
25% down · 7.5% · 30yr
- Down + closing
- —
- Monthly P&I
- —
- Monthly cashflow
- —
- DSCR
- —
- Eligible?
- —
Personal DTI + credit; lowest rate.
DSCR
20% down · 8.5% · 30yr
- Down + closing
- —
- Monthly P&I
- —
- Monthly cashflow
- —
- DSCR
- —
- Eligible?
- —
No personal income docs; deal must DSCR.
Hard money
10% down · 12.0% · 12mo
- Down + closing
- —
- Monthly P&I
- —
- Monthly cashflow
- —
- DSCR
- —
- Eligible?
- —
Short-term bridge; refi at stabilization.
Listing history 30 events
-
2026-06-21statusdays on market $2,095,000 Pending 22 DOM
-
2026-06-18days on market $2,095,000 Active 21 DOM
-
2026-06-17days on market $2,095,000 Active 20 DOM
-
2026-06-16days on market $2,095,000 Active 19 DOM
-
2026-06-15days on market $2,095,000 Active 18 DOM
-
2026-06-13days on market $2,095,000 Active 16 DOM
-
2026-06-13days on market $2,095,000 Active 15 DOM
-
2026-06-09days on market $2,095,000 Active 12 DOM
-
2026-06-08days on market $2,095,000 Active 11 DOM
-
2026-06-07days on market $2,095,000 Active 10 DOM
-
2026-06-04days on market $2,095,000 Active 7 DOM
-
2026-06-03days on market $2,095,000 Active 6 DOM
-
2026-06-02days on market $2,095,000 Active 5 DOM
-
2026-06-01days on market $2,095,000 Active 4 DOM
-
2026-05-31days on market $2,095,000 Active 3 DOM
-
2026-05-28$2,095,000 Active
-
2025-08-24historical $1,775
-
2025-07-31price $1,775
-
2025-07-19price $1,875
-
2025-06-05price $1,975
-
2025-05-21$2,050
-
2024-09-28historical $2,200
-
2024-09-21$2,200
-
2023-11-18historical $1,995
-
2023-10-15price $1,995
-
2023-10-08price $2,025
-
2023-09-27price $2,095
-
2023-09-20price $2,195
-
2023-09-10$2,295
-
1976-04-29soldstatus $107,000
ⓘ Source: listings_history table (triggers on properties + properties_extension) + one-shot
backfill from property_details.listing_events for pre-trigger history.
Tax reassessment forecast CA · Resets to sale price
- Current annual tax
- $32,416 · $2,701/mo
- Projected year-2 tax
- $32,416 · $2,701/mo
- Expected delta
- $0/yr ($0/mo · 0.0%)
ⓘ Screening estimate from a state-policy table — verify with the county assessor before closing.
Climate risk First Street
- Flood 1/10 Low FEMA zone X (unshaded) · 0% chance over 30 yrs
- Wildfire 4/10 Moderate
- Heat 4/10 Moderate 7 d/yr ≥84°F today · 21 d/yr by 30 yrs out
- Wind 1/10 Low
- Air quality 1/10 Low 0 unhealthy d/yr today · 0 by 30 yrs out
Nearby sold comps map
Loading sold comps map…
Walkable amenities ~0.75 mi
Loading nearby amenities…
Taxation est. · year 1
- Rental income
- $219,252
- − Mortgage interest
- −$117,353
- − Property taxes
- −$32,416
- − Insurance
- −$10,475
- − Repairs & maintenance
- −$17,540
- − Management
- −$17,540
- − Depreciation
- −$60,945
- Taxable loss
- −$37,017
- Est. tax savings @ 24.0%
- +$8,884
- After-tax cash flow
- $7,366/yr
For passive investors: Depreciation is non-cash, so a rental often shows a tax loss while cash-flowing — sheltering income. Rental losses are passive: they offset passive income freely, and up to $25,000/yr can offset ordinary (W-2) income if you actively participate and your MAGI is under $100k (phasing out to $0 by $150k); unused losses carry forward. On sale, claimed depreciation is recaptured at up to 25%, and gains may owe capital-gains tax (a 1031 exchange can defer both). Figures are a year-1 estimate at your 24.0% rate — not tax advice; consult a CPA.
Schools (NCES district)
- District
- Sweetwater Union High
- NCES district ID
- 0638640
- Math proficiency
- 36% ▲ 3.00%
- Reading proficiency
- 52% ▼ -2.00%
- Median HH income
- $59,051
- Composite
- 38.61/100
- National rank
- #4158
- State rank
- #187 of 517 in CA
Livability — Imperial Beach
- Score
- 60/100
- State rank
- #573
- US rank
- #18732
Category grades
Schools grade is shown separately in the Schools card above.
Census & demographics
- Census place
- Imperial Beach, CA
- County
- San Diego County · 3,178,799 people
- City population
- 25,741
- Metro
- San Diego-Chula Vista-Carlsbad, CA
- Population (ZIP)
- 25,741
- Household income
- $85,833
- Rent vs Own
- Severe rent burden
- 1654.0
Population outlook (San Diego County) Hauer SSP2
- Today (2025)
- 3,678,185 people
- By 2030
- 3,856,546 · +4.8%
- By 2040
- 4,171,407 · +13.4%
- By 2050
- 4,421,607 · +20.2%
- By 2075
- 4,831,599 · +31.4%
- By 2100
- 4,832,502 · +31.4%
Race, ethnicity, and origin ACS 2023
- Neighborhood character
- Diverse neighborhood (Simpson 0.63)
- Race & ethnicity
- Hispanic / Latino 51% White 33% Two or more races 25% Asian 6% Black 4%
- Hispanic origin (detail)
- Mexican 46% Puerto Rican 2%
- Common ancestry
- Lithuanian 2% Italian 2% Romanian 2%
- Foreign-born
- 18% · Canada
- Languages at home
- 58% English-only · Spanish 37% Tagalog/Filipino 3%
Political lean MEDSL · San Diego
- 2024 margin
- D (+16.8) · D 56.9% · R 40.1% · Other 2.9%
- 2008→2024 swing
- +6.6pp toward D · 2008: 10.2pp · 2024: 16.8pp
- All cycles
- 2024: D+16.8 2020: D+22.8 2016: D+17.8 2012: D+5.1 2008: D+10.2
Not yet ingested
- Civics
- —
Market trends
- HPI YoY
- ▼ -648.48%
- Current HPI
- 382.1556
- Rent YoY
- ▲ 1.77%
- Metro
- San Diego-Chula Vista-Carlsbad, CA
- State GDP YoY
- ▲ 3.21%
- F500 in state
- 116
Industry mix (Fortune 500 HQ in CA)
| Industry | F500 HQs | Revenue |
|---|---|---|
| Technology | 27 | $1,492B |
|
||
| Financial Services | 3 | $174B |
|
||
| Retail | 3 | $44B |
|
||
| Insurance | 3 | $26B |
|
||
| Media / Entertainment | 2 | $115B |
|
||
| Pharmaceuticals / Biotech | 2 | $62B |
|
||
Price history
+1857.9% since first listed15 events — show timeline
- 2026-05-28 Listed $2,095,000 SDMLS
- 2025-08-24 Rental Removed $1,775 APPFOLIO
- 2025-07-31 Price Changed $1,775 APPFOLIO
- 2025-07-19 Price Changed $1,875 APPFOLIO
- 2025-06-05 Price Changed $1,975 APPFOLIO
- 2025-05-21 Listed for Rent $2,050 APPFOLIO
- 2024-09-28 Rental Removed $2,200 APPFOLIO
- 2024-09-21 Listed for Rent $2,200 APPFOLIO
- 2023-11-18 Rental Removed $1,995 APPFOLIO
- 2023-10-15 Price Changed $1,995 APPFOLIO
- 2023-10-08 Price Changed $2,025 APPFOLIO
- 2023-09-27 Price Changed $2,095 APPFOLIO
- 2023-09-20 Price Changed $2,195 APPFOLIO
- 2023-09-10 Listed for Rent $2,295 APPFOLIO
- 1976-04-29 Sold (Public Records) $107,000 Public Records
Property tax history
+13.8%/yrLatest (2025): $32,416 · +5.1% YoY. Source: county tax records.
Cash-flow waterfall
monthlySold comps — $/sqft
last 12 mo · ≤1 miLoading sold comps…