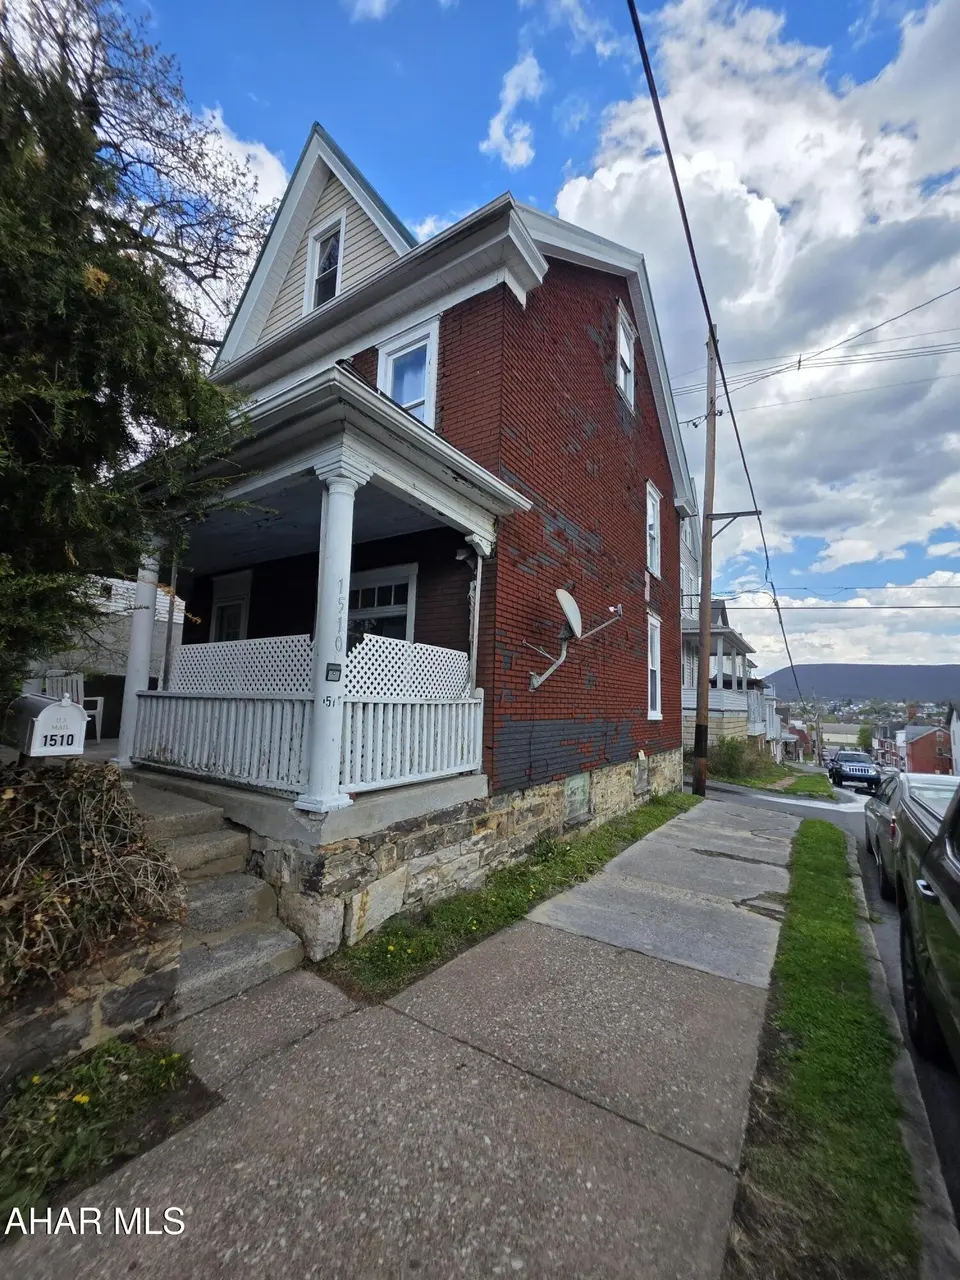
1510 3rd St · Altoona, PA
Flood risk 1/10 · Minimal
- FEMA flood zone
- X (unshaded)
- Chance of flooding over 30 yrs
- 0.0%
- Est. flood insurance / yr
- $507 – $1,088
Fire risk 1/10 · Minimal
- Est. fire insurance / yr
- $511 – $949
Heat risk 4/10 · Minor
- Hot days now (above 95°F)
- 7 days/yr
- Hot days in 30 yrs
- 18 days/yr
Wind risk 2/10 · Minimal
- Chance of severe wind over 30 yrs
- —
Air-quality risk 2/10 · Minimal
- Unhealthy air days now
- 1 days/yr
- Unhealthy air days in 30 yrs
- 3 days/yr
Risk factors via First Street. Map © Google.
Why this score? — see what drove the B grade
The composite is a weighted blend of 9 inputs, each scored 0–100. Each bar is that input's sub-score; the figure is the points it added to the 100-point composite (weight × sub-score).
- Cash flow +30.0/30.0
- DSCR +10.0/10.0
- 1% rule +9.7/10.0
- ARV discount +8.9/15.0
- Livability +4.0/5.0
- Schools +3.1/10.0
- Rent growth +2.5/5.0
- Condition / age +2.2/5.0
- Appreciation +0.0/10.0
$69,900
🖨 Deal sheet 📄 Offer letter ✓ Due diligence
Listing remarks MLS
LOW TAXES!!! Charming 2-story home offering classic character and a functional layout! This property features a covered porch, perfect for relaxing, and a spacious interior with a separate dining room and large living area filled with natural light. The kitchen offers ample cabinet space and a convenient layout with direct access to the rear entry. Upstairs, you'll find comfortable bedrooms with generous space, along with a full bathroom. The finished attic provides additional flexible space--ideal for storage, a home office, or potential bonus room, or additional bedroom.
Key facts
- Covered porch
- Large living area
- Finished attic
Tags
Neighborhood map
What this means for you Summary
Snapshot
- This is a 3-bed/1.0-bath single-family listed at $70k. Condition is rated fair.
Deal economics
- At list price, monthly cash flow is $328 ($4k/yr) — positive.
- The deal already cash-flows at list — no discount required.
- Meets the 1% rule at list price ($1k rent vs $70k).
- Recommended offer: $66k (6.0% below list) — sets the bar for market timing.
- Cap rate 11.9% vs local median 5.8% in Altoona — top-decile yield for the area; either an underpriced asset or a hidden risk that comps aren't pricing in. Stress-test before assuming the spread holds.
Location & tenants
- Location reads 79/100 on livability (#237 in PA, #2,060 nationally) — a middle-class / working-renter tenant base. Strengths: commute A+, cost of living A+, housing A+; Watch: crime C-, employment D, amenities F.
- Altoona Area SD (urban): math 30% / reading 44% proficiency, ranked #406 of 539 in PA (top 75%) — families likely to look elsewhere, expect single-tenant / working-renter base with shorter leases.
- Market conditions: 186 active listings in the ZIP; 12 comparable units currently listed for rent nearby; rentals lingering (median 44d on market — plan ~5-8 weeks vacancy on turnover, expect pricing pressure); 100% of comp listings sitting > 30 days — soft ceiling on asking rent; 99 units permitted in Blair County in 2024 (0 in 5+ unit buildings).
Forward outlook
- Local home prices are declining (-3.0%/yr); year-one equity from $483 of loan paydown is wiped out by about $2k of value loss. Plan a longer hold.
- Blair County population projected at -18% by 2050 — secular population decline; favor cash flow + early exit over multi-decade hold.
- At projected returns (-3.0% appreciation + 3.0% rent growth), your $20k cash investment doubles in ~7 years — after that, you're playing with house money.
Negotiation context
- It's been on market 67 days — a 6% lower offer ($66k) is reasonable based on typical stale-listing flexibility.
- 7 sale attempts since 23y ago; this cycle's ask has dropped $4k (6%) from the opening price — seller is motivated, your offer sets the floor, not the list.
- Current owner paid $55k; 27% above their basis — modest negotiation headroom, anchor on the comps not their cost.
Risks & watch-outs
- Watch-outs: built in 1924 — expect roof / HVAC / electrical / plumbing capex.
Questions for the listing agent
- It's been on market 67 days. Have you received any prior offers? Is the seller open to a 6% concession, seller financing, or rate buy-down credit?
- Have any recent inspections been done? Can we get a copy of the seller's disclosures and any deferred-maintenance estimates?
- Built in 1924 — when were the roof, HVAC, electrical panel, plumbing, and water heater last replaced?
- Why hasn't it sold? Are there any deal-killer items the seller is aware of (foundation, flood, title, zoning, code violations)?
- Is there a deadline driving the sale (1031 exchange, divorce, estate, relocation)? That informs how much negotiation room exists.
- Schools are B-rated — typically a magnet for longer-tenancy family renters. What's the average tenant stay here, and is there a school-zone premium baked into asking?
- What's the average days-on-market for RENTAL listings here right now (not sales)? A rising rental-DOM trend means longer vacancies and softer asking-rent achievability than the comps imply.
- What's the recent tenant-quality profile in this submarket — average credit score on applications, eviction rate, late-payment / NSF rate, and stable-employment percentage? A property-management company in the area should have these aggregated.
- How much new for-sale + rental construction is in the pipeline within 1–3 miles? Heavy new supply typically softens prices + rents 12–24 months out; constrained supply supports both.
Investment metrics
- 1% rule
- 1.47% ✓
- Cap rate
- 11.92%
- Cash-on-cash
- 20.09%
- DSCR
- 1.89
- GRM
- 5.7
CMA / ARV
- ARV (median comp)
- $72,102
- List price
- $69,900
- Delta
- -3.05%
- Verdict
- FAIR
- Comps
- 20 within 1.0 mi
Show comp detail 12 sales within ~0.75 mi
| Address | Dist | Beds/Ba | Sqft | Sold | Price | $/sf | Match |
|---|---|---|---|---|---|---|---|
| 229 21st Ave | 0.36mi | 3/1.0 | 1,328 (-5%) | 1mo | $36,500 | $27 | 73 |
| 322 Beech Ave | 0.22mi | 3/1.5 | 1,560 (+11%) | 3mo | $62,000 | $40 | 66 |
| 311 26th Ave | 0.65mi | 3/1.0 | 1,414 (+1%) | 6mo | $147,000 | $104 | 63 |
| 215 7th Ave | 0.47mi | 3/1.0 | 1,548 (+11%) | 3mo | $45,000 | $29 | 58 |
| 2309 1st St | 0.54mi | 4/1.5 (+1) | 1,496 (+7%) | 1mo | $147,100 | $98 | 56 |
| 511 26th Ave | 0.68mi | 3/2.0 | 1,438 (+3%) | 5mo | $163,000 | $113 | 56 |
| 2514 3rd St | 0.65mi | 2/1.0 (-1) | 1,326 (-5%) | 4mo | $154,500 | $117 | 53 |
| 1308 17th Ave | 0.69mi | 3/2.0 | 1,483 (+6%) | 5mo | $54,800 | $37 | 50 |
| 1222 19th Ave | 0.66mi | 2/2.0 (-1) | 1,450 (+4%) | 6mo | $32,504 | $22 | 50 |
| 2109 9th St | 0.51mi | 3/1.0 | 1,200 (-14%) | 5mo | $122,500 | $102 | 48 |
| 1225 19th Ave | 0.66mi | 3/2.0 | 1,600 (+14%) | 2mo | $138,500 | $87 | 40 |
| 908 26th Ave | 0.73mi | 3/1.0 | 1,194 (-15%) | 3mo | $162,000 | $136 | 38 |
Match score weights: distance 35% · size 25% · config 20% · recency 20%. Top-matched comps best support the ARV.
Projected returns pro-forma
-3.0% appreciation · 3.0% rent growth · sell at horizon
- IRR
- 12.3%
- Equity multiple
- 1.49×
- Total profit
- $9,561
- Equity at exit
- $10,422
- IRR
- 21.2%
- Equity multiple
- 2.80×
- Total profit
- $35,266
- Equity at exit
- $6,044
Cash invested: $19,572 (down + closing). Projections, not guarantees.
Landlord ↔ Tenant lean methodology
- Overall (STATE)
- 62 Landlord-Friendly
- State Pennsylvania
- 62 Landlord-Friendly · EVEN
- County
- — inherits STATE
- City
- — inherits STATE
ZIP-level market 16601
- Home prices YoY
- -24.9%
- Active inventory
- 186
- Price-to-rent
- 5.7×
Monthly cashflow live
- Estimated rent
- $1,026 high interval (Pro) →
- Mortgage (P&I)
- −$367
- Tax est. 1.5%
- −$87 /mo · $1,048/yr
- Insurance
- −$29
- HOA
- −$0
- Vacancy / Maint / Mgmt
- −$216
- Net cashflow
- $328
Break-even live
UW: 25.0% down · 7.5% · 30yr · 1.5% tax · 5.0% vac · 8.0% maint · 8.0% mgmt
Financing live
Cash to close
- Down payment
- $17,475
- Closing costs
- $2,097
- Reserves months
- —
- Total cash needed
- —
Loan-product check · same deal, 3 products live
Conventional
25% down · 7.5% · 30yr
- Down + closing
- —
- Monthly P&I
- —
- Monthly cashflow
- —
- DSCR
- —
- Eligible?
- —
Personal DTI + credit; lowest rate.
DSCR
20% down · 8.5% · 30yr
- Down + closing
- —
- Monthly P&I
- —
- Monthly cashflow
- —
- DSCR
- —
- Eligible?
- —
No personal income docs; deal must DSCR.
Hard money
10% down · 12.0% · 12mo
- Down + closing
- —
- Monthly P&I
- —
- Monthly cashflow
- —
- DSCR
- —
- Eligible?
- —
Short-term bridge; refi at stabilization.
Rent comps 12 comps
| Address | Beds | Baths | Sqft | Rent | $/sqft | DOM | Units | Dist |
|---|---|---|---|---|---|---|---|---|
| 1102 17th Ave Altoona, PA | 3.0 | 1.0 | 1430 | $899 | $0.63 | 44d | 1 | 0.49mi |
| 1326 14th Ave Altoona, PA | 3.0 | 1.0 | 1600 | $1,150 | $0.72 | 44d | 1 | 0.73mi |
| 100 College Park Dr Altoona, PA | 2.0 | 2.0 | 940 | $975 | $1.04 | 44d | 1 | 0.74mi |
| 200 College Park Dr Altoona, PA | 2.0 | 2.0 | 940 | $975 | $1.04 | 44d | 1 | 0.77mi |
| 201 2nd Ave Unit 2nd Fl Altoona, PA | 3.0 | 1.0 | 1244 | $790 | $0.64 | 44d | 1 | 0.77mi |
| 212 College Park Dr Altoona, PA | 2.0 | 2.0 | 950 | $975 | $1.03 | 44d | 2 | 0.80mi |
| 300 College Park Dr Altoona, PA | 2.0 | 2.0 | 940 | $975 | $1.04 | 44d | 1 | 0.81mi |
| 400 College Park Dr Altoona, PA | 2.0 | 2.0 | 940 | $975 | $1.04 | 44d | 1 | 0.84mi |
| 1489 Washington Ave Altoona, PA | 3.0 | 1.5 | 1050 | $850 | $0.81 | 44d | 1 | 1.04mi |
| 2708 Wehnwood Rd Altoona, PA | 1.0–4.0 | 1.0–1.5 | 960 | $967 | $1.01 | 44d | 5 | 1.10mi |
| 2015 12th Ave Altoona, PA | 3.0 | 1.0 | 1600 | $1,200 | $0.75 | 44d | 1 | 1.25mi |
| 1101 E Walton Ave Altoona, PA | 2.0–3.0 | 1.0–1.5 | 975 | $1,605 | $1.65 | 44d | 9 | 1.39mi |
Listing history 30 events
-
2026-06-19days on market $69,900 Active 67 DOM
-
2026-06-18days on market $69,900 Active 66 DOM
-
2026-06-17days on market $69,900 Active 65 DOM
-
2026-06-16days on market $69,900 Active 64 DOM
-
2026-06-15days on market $69,900 Active 63 DOM
-
2026-06-14days on market $69,900 Active 61 DOM
-
2026-06-13days on market $69,900 Active 60 DOM
-
2026-06-10days on market $69,900 Active 58 DOM
-
2026-06-09days on market $69,900 Active 57 DOM
-
2026-06-09price $69,900 Active 56 DOM
-
2026-06-08days on market $74,000 Active 56 DOM
-
2026-06-07days on market $74,000 Active 55 DOM
-
2026-06-05days on market $74,000 Active 52 DOM
-
2026-06-03days on market $74,000 Active 51 DOM
-
2026-06-02days on market $74,000 Active 50 DOM
-
2026-06-01days on market $74,000 Active 49 DOM
-
2026-05-31days on market $74,000 Active 48 DOM
-
2026-05-30days on market $74,000 Active 47 DOM
-
2026-04-13$74,000 Active 582-char remark
Show marketing remark (582 chars)
LOW TAXES!!! Charming 2-story home offering classic character and a functional layout! This property features a covered porch, perfect for relaxing, and a spacious interior with a separate dining room and large living area filled with natural light. The kitchen offers ample cabinet space and a convenient layout with direct access to the rear entry. Upstairs, you'll find comfortable bedrooms with generous space, along with a full bathroom. The finished attic provides additional flexible space--ideal for storage, a home office, or potential bonus room, or additional bedroom.
-
2025-04-29soldstatus $55,000 Closed 250-char remark
Show marketing remark (250 chars)
This property has been a great rental for the currant owner. Rent $795 per month plus water over $75. Tenant pays all other utilities. NEW Roof and windows in 2018. NEW carpet and paint in 2024. Check it out! Seller is a licensed Real Estate Agent.
-
2025-03-28status Pending 250-char remark
Show marketing remark (250 chars)
This property has been a great rental for the currant owner. Rent $795 per month plus water over $75. Tenant pays all other utilities. NEW Roof and windows in 2018. NEW carpet and paint in 2024. Check it out! Seller is a licensed Real Estate Agent.
-
2025-03-22price $59,900 250-char remark
Show marketing remark (250 chars)
This property has been a great rental for the currant owner. Rent $795 per month plus water over $75. Tenant pays all other utilities. NEW Roof and windows in 2018. NEW carpet and paint in 2024. Check it out! Seller is a licensed Real Estate Agent.
-
2025-03-03$65,000 Active 250-char remark
Show marketing remark (250 chars)
This property has been a great rental for the currant owner. Rent $795 per month plus water over $75. Tenant pays all other utilities. NEW Roof and windows in 2018. NEW carpet and paint in 2024. Check it out! Seller is a licensed Real Estate Agent.
-
2020-03-06$34,900
-
2014-05-29soldstatus $19,900
-
2014-01-31$19,900
-
2006-10-10$29,900
-
2005-06-29$32,000
-
2004-01-31soldstatus $24,900
-
2003-07-23$24,900
ⓘ Source: listings_history table (triggers on properties + properties_extension) + one-shot
backfill from property_details.listing_events for pre-trigger history.
Climate risk First Street
- Flood 1/10 Low FEMA zone X (unshaded) · 0% chance over 30 yrs
- Wildfire 1/10 Low
- Heat 4/10 Moderate 7 d/yr ≥95°F today · 18 d/yr by 30 yrs out
- Wind 2/10 Low
- Air quality 2/10 Low 1 unhealthy d/yr today · 3 by 30 yrs out
Nearby sold comps map
Loading sold comps map…
Walkable amenities ~0.75 mi
Loading nearby amenities…
Taxation est. · year 1
- Rental income
- $12,316
- − Mortgage interest
- −$3,915
- − Property taxes
- −$1,048
- − Insurance
- −$350
- − Repairs & maintenance
- −$985
- − Management
- −$985
- − Depreciation
- −$2,033
- Taxable income
- $2,998
- Est. tax owed @ 24.0%
- −$720
- After-tax cash flow
- $3,213/yr
For passive investors: Depreciation is non-cash, so a rental often shows a tax loss while cash-flowing — sheltering income. Rental losses are passive: they offset passive income freely, and up to $25,000/yr can offset ordinary (W-2) income if you actively participate and your MAGI is under $100k (phasing out to $0 by $150k); unused losses carry forward. On sale, claimed depreciation is recaptured at up to 25%, and gains may owe capital-gains tax (a 1031 exchange can defer both). Figures are a year-1 estimate at your 24.0% rate — not tax advice; consult a CPA.
Condition & rehab AI · 12 photos
This 2-story home requires moderate renovations to improve its condition and increase its value. Repairs to the roof, exterior siding, and windows are necessary, along with updates to the kitchen and bathroom. Painting the exterior and replacing dated flooring and cabinets will significantly enhance its curb appeal and value.
Repairs flagged
- Major roof — visible damage
- Major exterior siding — damaged
- Major windows — damaged frames
- Minor kitchen cabinets — dated
- Minor bathroom wallpaper — dated
- Minor kitchen flooring — carpeted
- Minor bathroom flooring — carpeted
Value-add opportunities
- Both paint exterior — enhances curb appeal and value
- Both repair damaged siding — improves structural integrity and appearance
- Both replace damaged windows — increases natural light and energy efficiency
- Both replace kitchen cabinets — modernizes the space and increases value
- Both replace bathroom wallpaper — updates the space and improves aesthetics
- Both replace kitchen flooring — modernizes the space and increases value
- Both replace bathroom flooring — modernizes the space and increases value
Renovation cost estimate screening
| Repair item | Severity | Est. cost |
|---|---|---|
| roof · visible damage | Major | $15,000–50,000 |
| exterior siding · damaged | Major | $15,000–50,000 |
| windows · damaged frames | Major | $15,000–50,000 |
| kitchen cabinets · dated | Minor | $500–3,000 |
| bathroom wallpaper · dated | Minor | $500–3,000 |
| kitchen flooring · carpeted | Minor | $500–3,000 |
| bathroom flooring · carpeted | Minor | $500–3,000 |
| Total estimated repair cost · 7 items | $47,000–162,000 |
Value-add ROI direction
- Both paint exterior — enhances curb appeal and value ↑
- Both repair damaged siding — improves structural integrity and appearance ↑
- Both replace damaged windows — increases natural light and energy efficiency ↑
- Both replace kitchen cabinets — modernizes the space and increases value ↑
- Both replace bathroom wallpaper — updates the space and improves aesthetics ↑
- Both replace kitchen flooring — modernizes the space and increases value ↑
- Both replace bathroom flooring — modernizes the space and increases value ↑
ⓘ Cost ranges are severity-bucket heuristics (US national rule-of-thumb). Get contractor quotes + a written scope before underwriting a rehab budget.
Schools (NCES district)
- District
- Altoona Area SD
- NCES district ID
- 4202340
- Math proficiency
- 30% ▼ -15.00%
- Reading proficiency
- 44% ▼ -15.00%
- Median HH income
- $38,465
- Composite
- 30.85/100
- National rank
- #6130
- State rank
- #406 of 539 in PA
Livability — Altoona
- Score
- 79/100
- State rank
- #237
- US rank
- #2060
Category grades
Schools grade is shown separately in the Schools card above.
Census & demographics
- Census place
- Altoona, PA
- County
- Blair County · 59,867 people
- City population
- 59,867
- Metro
- Altoona, PA
- Population (ZIP)
- 33,515
- Household income
- $58,070
- Rent vs Own
- Severe rent burden
- 715.0
Population outlook (Blair County) Hauer SSP2
- Today (2025)
- 121,571 people
- By 2030
- 117,966 · -3.0%
- By 2040
- 109,174 · -10.2%
- By 2050
- 99,542 · -18.1%
- By 2075
- 76,775 · -36.8%
- By 2100
- 54,326 · -55.3%
Race, ethnicity, and origin ACS 2023
- Neighborhood character
- Predominantly White (90%)
- Race & ethnicity
- White 90% Two or more races 5% Black 3% Hispanic / Latino 1%
- Common ancestry
- Romanian 5% Slovak 2% Lithuanian 2%
- Foreign-born
- 1% · Vietnam
- Languages at home
- 97% English-only · German/W. Germanic 1% Spanish 1%
Political lean MEDSL · Blair
- 2024 margin
- Solid R (+43.5) · D 27.9% · R 71.4%
- 2008→2024 swing
- -19.2pp toward R · 2008: -24.3pp · 2024: -43.5pp
- All cycles
- 2024: R+43.5 2020: R+43.5 2016: R+46.4 2012: R+33.5 2008: R+24.3
Not yet ingested
- Civics
- —
Market trends
- HPI YoY
- ▼ -60.97%
- Current HPI
- 183.9907
- Rent YoY
- —
- Metro
- Altoona, PA
- State GDP YoY
- ▲ 1.68%
- F500 in state
- 34
Industry mix (Fortune 500 HQ in PA)
| Industry | F500 HQs | Revenue |
|---|---|---|
| Healthcare | 2 | $309B |
|
||
| Insurance | 2 | $27B |
|
||
| Telecommunications / Media | 1 | $124B |
|
||
| Industrial Distribution | 1 | $22B |
|
||
| Financial Services | 1 | $20B |
|
||
| Chemicals / Materials | 1 | $18B |
|
||
Price history
+197.2% since first listed12 events — show timeline
- 2026-04-13 Listed $74,000 AHARMLS
- 2025-04-29 Sold (MLS) $55,000 AHARMLS
- 2025-03-28 Pending — AHARMLS
- 2025-03-22 Price Changed $59,900 AHARMLS
- 2025-03-03 Listed $65,000 AHARMLS
- 2020-03-06 Listed $34,900 AHARMLS
- 2014-05-29 Sold (MLS) $19,900 AHARMLS
- 2014-01-31 Listed $19,900 AHARMLS
- 2006-10-10 Listed $29,900 AHARMLS
- 2005-06-29 Listed $32,000 AHARMLS
- 2004-01-31 Sold (MLS) $24,900 AHARMLS
- 2003-07-23 Listed $24,900 AHARMLS
Cash-flow waterfall
monthlySold comps — $/sqft
last 12 mo · ≤1 miLoading sold comps…