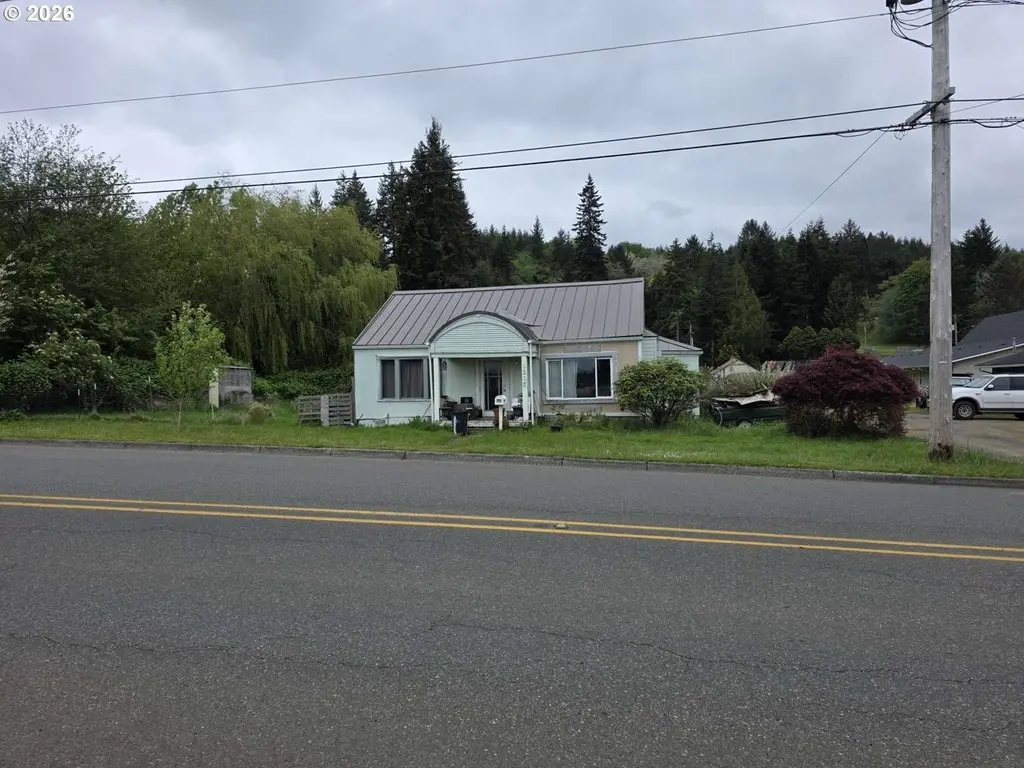
1305 Park Ave · Raymond, WA
Flood risk 1/10 · Minimal
- FEMA flood zone
- X (unshaded)
- Chance of flooding over 30 yrs
- 0.0%
- Est. flood insurance / yr
- $507 – $1,088
Fire risk 1/10 · Minimal
- Est. fire insurance / yr
- $604 – $1,122
Heat risk 2/10 · Minimal
- Hot days now (above 83°F)
- 8 days/yr
- Hot days in 30 yrs
- 16 days/yr
Wind risk 1/10 · Minimal
- Chance of severe wind over 30 yrs
- —
Air-quality risk 6/10 · Moderate
- Unhealthy air days now
- 6 days/yr
- Unhealthy air days in 30 yrs
- 7 days/yr
Risk factors via First Street. Map © Google.
Why this score? — see what drove the B+ grade
The composite is a weighted blend of 9 inputs, each scored 0–100. Each bar is that input's sub-score; the figure is the points it added to the 100-point composite (weight × sub-score).
- Cash flow +30.0/30.0
- ARV discount +15.0/15.0
- 1% rule +10.0/10.0
- DSCR +10.0/10.0
- Livability +3.6/5.0
- Schools +3.5/10.0
- Rent growth +2.5/5.0
- Condition / age +2.5/5.0
- Appreciation +1.1/10.0
$154,900
🖨 Deal sheet 📄 Offer letter ✓ Due diligence
Listing remarks
Investor special with tons of potential! This 3-bedroom, 1-bath home offers approximately 1,340 sqft of living space situated on a spacious 0.25-acre lot. Property needs extensive repairs and updates, making it a great opportunity for investors, flippers, or buyers looking for a full renovation project. Large lot provides room for outdoor improvements, expansion possibilities, or additional parking. Conveniently located near local amenities, schools, and downtown Raymond. Bring your vision and restore this property to its full potential!
Key facts
- 0.25 acre lot
- 2 garage spots
- Built 1940
Property features AI
Finance
- Other: Lot about 0.25 acre (10,000 to 14,999 SqFt)
- HOA & community: Not a senior community
Exterior
- Parking: Detached 2-car garage; Total parking for 2 vehicles
- Utilities: Public water; Public sewer; No fuel source specified
- Home design: Single-family residence; Residential property; Resale; Main living area is on one level; No notable view; Address: 1305 Park Ave, Raymond, WA 98577
- Construction: Built in 1940; Owner-occupied building area
- Exterior features: Wood composite exterior; Wood siding
Interior
- Kitchen: Kitchen
- Bedrooms: Primary bedroom on main level; Second bedroom on main level; Third bedroom on main level
- Bathrooms: One full bathroom on main level
- Heating & cooling: No central heating; No central cooling
- Interior features: One fireplace
Neighborhood map
What this means for you Summary
Snapshot
- This is a 3-bed/1.0-bath single-family listed at $155k.
Deal economics
- At list price, monthly cash flow is $965 ($12k/yr) — positive.
- The deal already cash-flows at list — no discount required.
- Meets the 1% rule at list price ($2k rent vs $155k).
- Recommended offer: $150k (3.0% below list) — sets the bar for market timing.
- Cap rate 13.8% vs local median 4.0% in Raymond — top-decile yield for the area; either an underpriced asset or a hidden risk that comps aren't pricing in. Stress-test before assuming the spread holds.
Location & tenants
- Location reads 72/100 on livability (#212 in WA) — a middle-class / working-renter tenant base. Strengths: crime A+, cost of living A+, housing A+; Watch: commute F.
- Raymond School District (rural): math 30% / reading 48% proficiency, ranked #231 of 291 in WA (top 79%) — families likely to look elsewhere, expect single-tenant / working-renter base with shorter leases.
- Zoned schools: Raymond Elementary School (224 students, 75% FRL); Raymond Jr Sr High School (259 students, 72% FRL) — zoned schools average 74% FRL vs 52% district-wide (21 pts higher); higher-poverty schools than district average — tighter screening recommended.
- Market conditions: 91 active listings in the ZIP; 1 comparable units currently listed for rent nearby; 90 units permitted in Pacific County in 2024 (0 in 5+ unit buildings).
Forward outlook
- Local home prices are declining (-3.0%/yr); year-one equity from $1k of loan paydown is wiped out by about $5k of value loss. Plan a longer hold.
- Pacific County population projected at -10% by 2050 — secular population decline; favor cash flow + early exit over multi-decade hold.
- At projected returns (-3.0% appreciation + 3.0% rent growth), your $43k cash investment doubles in ~5 years — after that, you're playing with house money.
Negotiation context
- It's been on market 42 days — a 3% lower offer ($150k) is reasonable based on typical stale-listing flexibility.
- 3 sale attempts since 15y ago; this cycle's ask has dropped $55k (26%) from the opening price — seller is motivated, your offer sets the floor, not the list.
- Current owner paid $55k; list at $155k implies a 182% gain — meaningful room to come down on a strong offer.
Risks & watch-outs
- Watch-outs: built in 1940 — expect roof / HVAC / electrical / plumbing capex.
Questions for the listing agent
- It's been on market 42 days. Have you received any prior offers? Is the seller open to a 3% concession, seller financing, or rate buy-down credit?
- Built in 1940 — when were the roof, HVAC, electrical panel, plumbing, and water heater last replaced?
- Is there a deadline driving the sale (1031 exchange, divorce, estate, relocation)? That informs how much negotiation room exists.
- Schools are D-rated, which usually means shorter tenancies and higher turnover. Who's the typical renter profile here, and what's been the actual vacancy rate?
- What's the average days-on-market for RENTAL listings here right now (not sales)? A rising rental-DOM trend means longer vacancies and softer asking-rent achievability than the comps imply.
- What's the recent tenant-quality profile in this submarket — average credit score on applications, eviction rate, late-payment / NSF rate, and stable-employment percentage? A property-management company in the area should have these aggregated.
- How much new for-sale + rental construction is in the pipeline within 1–3 miles? Heavy new supply typically softens prices + rents 12–24 months out; constrained supply supports both.
Investment metrics
- 1% rule
- 1.61% ✓
- Cap rate
- 13.77%
- Cash-on-cash
- 26.71%
- DSCR
- 2.19
- GRM
- 5.2
CMA / ARV
- ARV (on-the-fly)
- $259,960
- Comps found
- 11
Show comp detail 11 sales within ~0.75 mi
| Address | Dist | Beds/Ba | Sqft | Sold | Price | $/sf | Match |
|---|---|---|---|---|---|---|---|
| 1507 Park Ave | 0.12mi | 2/1.0 (-1) | 1,320 (-2%) | 5mo | $100,000 | $76 | 83 |
| 1203 Larch St | 0.34mi | 3/1.5 | 1,351 (+1%) | 8mo | $283,400 | $210 | 74 |
| 1143 Willapa St | 0.22mi | 3/1.0 | 1,270 (-5%) | 11mo | $290,000 | $228 | 72 |
| 1217 Godfrey St | 0.15mi | 3/2.0 | 1,448 (+8%) | 7mo | $318,000 | $220 | 70 |
| 900 Crescent St | 0.14mi | 3/2.0 | 1,284 (-4%) | 21mo | $318,000 | $248 | 65 |
| 1120 Godfrey St | 0.08mi | 3/1.0 | 1,476 (+10%) | 21mo | $160,000 | $108 | 62 |
| 1001 Howard St | 0.07mi | 3/1.0 | 1,498 (+12%) | 20mo | $248,000 | $166 | 60 |
| 1205 Cedar St | 0.29mi | 4/2.0 (+1) | 1,492 (+11%) | 2mo | $289,212 | $194 | 57 |
| 1921 Garfield Ave | 0.35mi | 3/1.5 | 1,513 (+13%) | 8mo | $160,000 | $106 | 53 |
| 204 Peters St | 0.69mi | 3/2.0 | 1,432 (+7%) | 4mo | $135,000 | $94 | 49 |
| 1242 Mill St | 0.43mi | 2/1.5 (-1) | 1,520 (+13%) | 18mo | $300,000 | $197 | 35 |
Match score weights: distance 35% · size 25% · config 20% · recency 20%. Top-matched comps best support the ARV.
Projected returns pro-forma
-3.0% appreciation · 3.0% rent growth · sell at horizon
- IRR
- 20.6%
- Equity multiple
- 1.84×
- Total profit
- $36,387
- Equity at exit
- $23,096
- IRR
- 28.8%
- Equity multiple
- 3.56×
- Total profit
- $110,861
- Equity at exit
- $13,393
Cash invested: $43,372 (down + closing). Projections, not guarantees.
Landlord ↔ Tenant lean methodology
- Overall (STATE)
- 28 Tenant-Leaning
- State Washington
- 28 Tenant-Leaning · D+8
- County
- — inherits STATE
- City
- — inherits STATE
ZIP-level market 98577
- Home prices YoY
- -2.8%
- Active inventory
- 91
- Price-to-rent
- 5.2×
Monthly cashflow live
- Estimated rent
- $2,500 medium interval (Pro) →
- Mortgage (P&I)
- −$812
- Tax from tax record
- −$133 /mo · $1,593/yr
- Insurance
- −$65
- HOA
- −$0
- Vacancy / Maint / Mgmt
- −$525
- Net cashflow
- $965
Break-even live
UW: 25.0% down · 7.5% · 30yr · 1.5% tax · 5.0% vac · 8.0% maint · 8.0% mgmt
Financing live
Cash to close
- Down payment
- $38,725
- Closing costs
- $4,647
- Reserves months
- —
- Total cash needed
- —
Loan-product check · same deal, 3 products live
Conventional
25% down · 7.5% · 30yr
- Down + closing
- —
- Monthly P&I
- —
- Monthly cashflow
- —
- DSCR
- —
- Eligible?
- —
Personal DTI + credit; lowest rate.
DSCR
20% down · 8.5% · 30yr
- Down + closing
- —
- Monthly P&I
- —
- Monthly cashflow
- —
- DSCR
- —
- Eligible?
- —
No personal income docs; deal must DSCR.
Hard money
10% down · 12.0% · 12mo
- Down + closing
- —
- Monthly P&I
- —
- Monthly cashflow
- —
- DSCR
- —
- Eligible?
- —
Short-term bridge; refi at stabilization.
Rent comps 1 comps
| Address | Beds | Baths | Sqft | Rent | $/sqft | DOM | Units | Dist |
|---|---|---|---|---|---|---|---|---|
| 945 Fowler St Raymond, WA | 4.0 | 1.5 | 1792 | $2,500 | $1.40 | 44d | 1 | 1.42mi |
Listing history 30 events
-
2026-06-18days on market $154,900 Active 42 DOM
-
2026-06-17days on market $154,900 Active 41 DOM
-
2026-06-16days on market $154,900 Active 40 DOM
-
2026-06-15days on market $154,900 Active 39 DOM
-
2026-06-15pricedays on market $154,900 Active 38 DOM
-
2026-06-13days on market $163,900 Active 37 DOM
-
2026-06-12days on market $163,900 Active 36 DOM
-
2026-06-09days on market $163,900 Active 33 DOM
-
2026-06-08days on market $163,900 Active 32 DOM
-
2026-06-08pricedays on market $163,900 Active 31 DOM
-
2026-06-05days on market $166,900 Active 29 DOM
-
2026-06-03pricedays on market $166,900 Active 27 DOM
-
2026-06-02days on market $186,900 Active 26 DOM
-
2026-06-01days on market $186,900 Active 25 DOM
-
2026-05-31days on market $186,900 Active 24 DOM
-
2026-05-20price $186,900
-
2026-05-15price $189,900
-
2026-05-11price $199,000
-
2026-05-07$209,900 Active
-
2018-08-16soldstatus $55,000 Sold
-
2018-08-16soldstatus $47,275
-
2018-08-03status Pending
-
2018-07-30$55,000 Active
-
2012-05-04soldstatus $36,400 Sold
-
2012-03-13status Pending
-
2012-02-15price $36,400
-
2012-01-14price $41,600
-
2011-12-14price $46,800
-
2011-11-20$52,000 Active
-
2001-11-26soldstatus $69,500
ⓘ Source: listings_history table (triggers on properties + properties_extension) + one-shot
backfill from property_details.listing_events for pre-trigger history.
Tax reassessment forecast WA · Resets to sale price
- Current annual tax
- $1,593 · $133/mo
- Projected year-2 tax
- $1,593 · $133/mo
- Expected delta
- $0/yr ($0/mo · 0.0%)
ⓘ Screening estimate from a state-policy table — verify with the county assessor before closing.
Climate risk First Street
- Flood 1/10 Low FEMA zone X (unshaded) · 0% chance over 30 yrs
- Wildfire 1/10 Low
- Heat 2/10 Low 8 d/yr ≥83°F today · 16 d/yr by 30 yrs out
- Wind 1/10 Low
- Air quality 6/10 Major 6 unhealthy d/yr today · 7 by 30 yrs out
Nearby sold comps map
Loading sold comps map…
Walkable amenities ~0.75 mi
Loading nearby amenities…
Taxation est. · year 1
- Rental income
- $30,000
- − Mortgage interest
- −$8,677
- − Property taxes
- −$1,593
- − Insurance
- −$774
- − Repairs & maintenance
- −$2,400
- − Management
- −$2,400
- − Depreciation
- −$4,506
- Taxable income
- $9,650
- Est. tax owed @ 24.0%
- −$2,316
- After-tax cash flow
- $9,269/yr
For passive investors: Depreciation is non-cash, so a rental often shows a tax loss while cash-flowing — sheltering income. Rental losses are passive: they offset passive income freely, and up to $25,000/yr can offset ordinary (W-2) income if you actively participate and your MAGI is under $100k (phasing out to $0 by $150k); unused losses carry forward. On sale, claimed depreciation is recaptured at up to 25%, and gains may owe capital-gains tax (a 1031 exchange can defer both). Figures are a year-1 estimate at your 24.0% rate — not tax advice; consult a CPA.
Schools (NCES district)
- District
- Raymond School District
- NCES district ID
- 5307140
- Math proficiency
- 30% ▲ 5.00%
- Reading proficiency
- 48% ▲ 2.00%
- Median HH income
- $38,441
- Composite
- 34.99/100
- National rank
- #9951
- State rank
- #231 of 291 in WA
Livability — Raymond
- Score
- 72/100
- State rank
- #212
- US rank
- #6045
Category grades
Schools grade is shown separately in the Schools card above.
Census & demographics
- Census place
- Raymond, WA
- Population (ZIP)
- 7,458
Population outlook (Pacific County) Hauer SSP2
- Today (2025)
- 20,636 people
- By 2030
- 20,137 · -2.4%
- By 2040
- 19,041 · -7.7%
- By 2050
- 18,504 · -10.3%
- By 2075
- 17,403 · -15.7%
- By 2100
- 16,241 · -21.3%
Race, ethnicity, and origin ACS 2023
- Neighborhood character
- Predominantly White (78%)
- Race & ethnicity
- White 78% Hispanic / Latino 11% Two or more races 7% Native American 2% Asian 1%
- Hispanic origin (detail)
- Mexican 11%
- Common ancestry
- Portuguese 5% Scotch-Irish 3% Romanian 3%
- Foreign-born
- 7% · Canada, South Korea
- Languages at home
- 89% English-only · Spanish 8% German/W. Germanic 2%
Political lean MEDSL · Pacific
- 2024 margin
- Toss-up / Even · D 48.1% · R 49.4% · Other 2.4%
- 2008→2024 swing
- -15.4pp toward R · 2008: 14.1pp · 2024: -1.3pp
- All cycles
- 2024: R+1.3 2020: R+1.1 2016: R+6.9 2012: D+11.4 2008: D+14.1
Not yet ingested
- Civics
- —
Market trends
- HPI YoY
- ▼ -7.88%
- Current HPI
- 271.0583
- Rent YoY
- —
- Metro
- —
- State GDP YoY
- ▲ 4.65%
- F500 in state
- 22
Industry mix (Fortune 500 HQ in WA)
| Industry | F500 HQs | Revenue |
|---|---|---|
| Retail | 2 | $269B |
|
||
| Technology / Retail | 1 | $638B |
|
||
| Technology | 1 | $245B |
|
||
| Telecommunications | 1 | $38B |
|
||
| Food / Beverage | 1 | $36B |
|
||
| Automotive / Trucks | 1 | $34B |
|
||
Price history
+168.9% since first listed15 events — show timeline
- 2026-05-20 Price Changed $186,900 RMLS
- 2026-05-15 Price Changed $189,900 RMLS
- 2026-05-11 Price Changed $199,000 RMLS
- 2026-05-07 Listed $209,900 RMLS
- 2018-08-16 Sold (Public Records) $47,275 Public Records
- 2018-08-16 Sold (MLS) $55,000 NWMLS as Distributed by MLS Grid
- 2018-08-03 Pending — NWMLS as Distributed by MLS Grid
- 2018-07-30 Listed $55,000 NWMLS as Distributed by MLS Grid
- 2012-05-04 Sold (MLS) $36,400 NWMLS as Distributed by MLS Grid
- 2012-03-13 Pending — NWMLS as Distributed by MLS Grid
- 2012-02-15 Price Changed $36,400 NWMLS as Distributed by MLS Grid
- 2012-01-14 Price Changed $41,600 NWMLS as Distributed by MLS Grid
- 2011-12-14 Price Changed $46,800 NWMLS as Distributed by MLS Grid
- 2011-11-20 Listed $52,000 NWMLS as Distributed by MLS Grid
- 2001-11-26 Sold (Public Records) $69,500 Public Records
Property tax history
+6.6%/yrLatest (2026): $1,593 · +4.8% YoY. Source: county tax records.
Cash-flow waterfall
monthlySold comps — $/sqft
last 12 mo · ≤1 miLoading sold comps…