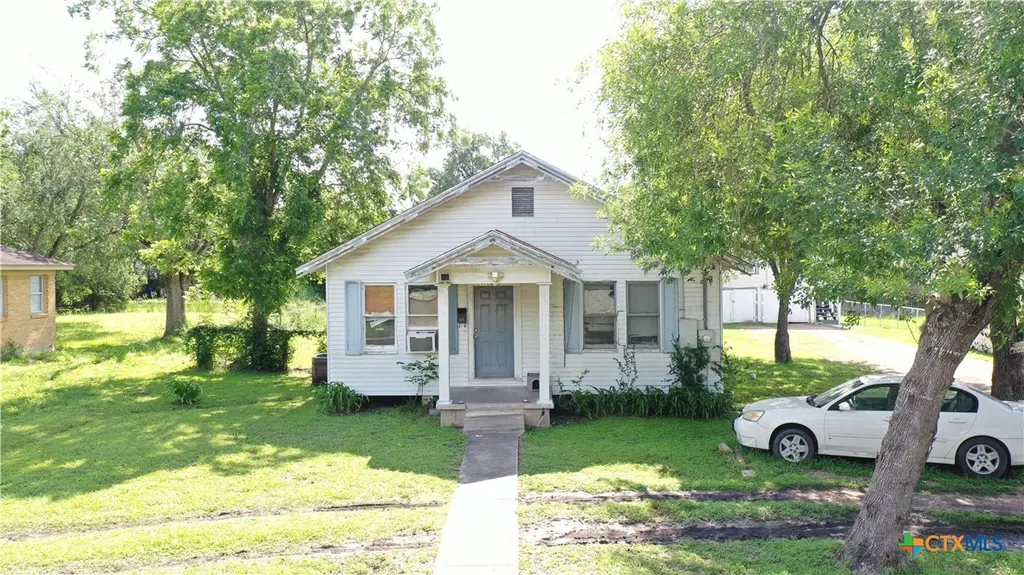
1704 N Goldman St · Victoria, TX
Flood risk 5/10 · Moderate
- FEMA flood zone
- X
- Chance of flooding over 30 yrs
- 0.66%
- Est. flood insurance / yr
- $507 – $1,088
Fire risk 4/10 · Minor
- Est. fire insurance / yr
- $1,222 – $2,270
Heat risk 9/10 · Severe
- Hot days now (above 111°F)
- 7 days/yr
- Hot days in 30 yrs
- 21 days/yr
Wind risk 8/10 · Major
- Chance of severe wind over 30 yrs
- 99.0%
Air-quality risk 1/10 · Minimal
- Unhealthy air days now
- 0 days/yr
- Unhealthy air days in 30 yrs
- 0 days/yr
Risk factors via First Street. Map © Google.
Why this score? — see what drove the F grade
The composite is a weighted blend of 9 inputs, each scored 0–100. Each bar is that input's sub-score; the figure is the points it added to the 100-point composite (weight × sub-score).
- Cash flow +10.2/30.0
- Livability +3.6/5.0
- DSCR +2.9/10.0
- Schools +2.5/10.0
- Condition / age +2.5/5.0
- 1% rule +2.3/10.0
- Rent growth +2.3/5.0
- ARV discount +0.0/15.0
- Appreciation +0.0/10.0
$169,900
🖨 Deal sheet 📄 Offer letter ✓ Due diligence
Listing remarks
Located in the heart of Victoria, this property offers a fantastic investment opportunity with multiple income-producing possibilities. This 3-bedroom, 1.5-bath home is conveniently situated near shopping, schools, and everyday amenities, making it an attractive option for tenants or future homeowners alike. In addition to the main residence, the property includes a separate 1-bedroom, 1-bath garage apartment and an additional spacious shop, providing added flexibility and value. Whether you’re looking to expand your rental portfolio, create a multi-generational living setup, or utilize the extra workspace, this property offers endless potential. The house, garage apartment, and shop
Key facts
- Versatile layout
- Spacious shop
- Central location
Tags
Property features AI
Exterior
- Parking: 2-car garage
- Utilities: Electricity available and on property; Public water; Public sewer
- Home design: Single-story; Resale property
- Construction: Frame construction; Composition/shingle roof; Pillar/post/pier foundation; Year built source: Assessor
- Exterior features: Chain link fencing; Garage apartment; Asphalt road access; City lot, less than quarter acre
Interior
- Kitchen: Electric range; Range; Refrigerator
- Bedrooms: 2 rooms total
- Flooring: Vinyl
- Bathrooms: 1 full bathroom; 1 half bathroom
- Heating & cooling: Heating: Window unit; Cooling: Wall/window unit(s)
- Interior features: Ceiling fan(s); Vinyl flooring
- Laundry & utility: Laundry inside
Neighborhood map
What this means for you Summary
Snapshot
- This is a 3-bed/1.5-bath single-family listed at $170k.
Deal economics
- At list price, monthly cash flow is $-96 ($-1k/yr) — negative.
- To cash-flow at today's rent, offer at most $153k (10.0% below list).
- To meet the 1% rule (rent ≥ 1% of price), the offer needs to be $125k (26.7% below list).
- Recommended offer: $125k (26.7% below list) — sets the bar for 1% rule.
- Cap rate 5.6% vs local median 3.7% in Victoria — top-decile yield for the area; either an underpriced asset or a hidden risk that comps aren't pricing in. Stress-test before assuming the spread holds.
Location & tenants
- Location reads 71/100 on livability (#309 in TX) — a middle-class / working-renter tenant base. Strengths: cost of living A+, housing A+, health & safety A+; Watch: crime D+, schools D, amenities F.
- Victoria ISD (urban): math 24% / reading 33% proficiency, ranked #645 of 826 in TX (top 78%) — low school quality limits family demand, transient renter base, plan for 1-2y turnover.
- Market conditions: Rents soft (-0.8%/yr); 196 active listings in the ZIP; 9 comparable units currently listed for rent nearby; rentals lingering (median 44d on market — plan ~5-8 weeks vacancy on turnover, expect pricing pressure); 100% of comp listings sitting > 30 days — soft ceiling on asking rent; 43 units permitted in Victoria County in 2024 (0 in 5+ unit buildings).
Forward outlook
- Local home prices are declining (-3.0%/yr); year-one equity from $1k of loan paydown is wiped out by about $5k of value loss. Plan a longer hold.
- Victoria County population projected at +34% by 2050 — long-run rental-demand tailwind backs the buy-and-hold thesis.
Negotiation context
- It's been on market 27 days — a 2% lower offer ($167k) is reasonable based on typical stale-listing flexibility.
Risks & watch-outs
- Watch-outs: built in 1950 — expect roof / HVAC / electrical / plumbing capex.
- Climate carrying-cost: moderate flood risk; severe wind risk, 99% chance of damaging wind over 30y; extreme-heat days projected 7→21/yr by 2055 (HVAC capex compounding) — expect insurance premiums to compound above CPI over the hold.
Questions for the listing agent
- What do current leases actually rent for vs. the listed asking? Can we see a recent rent roll and the last 12 months of T-12 income?
- Built in 1950 — when were the roof, HVAC, electrical panel, plumbing, and water heater last replaced?
- Is there a deadline driving the sale (1031 exchange, divorce, estate, relocation)? That informs how much negotiation room exists.
- Schools are D-rated, which usually means shorter tenancies and higher turnover. Who's the typical renter profile here, and what's been the actual vacancy rate?
- Crime grade is D in this area — have there been break-ins, vandalism, or insurance claims at this property in the last 3 years? What carrier currently insures it and at what premium?
- The area grade is low — what's the realistic commute time and amenity access for the typical tenant pool here? Any planned neighborhood developments (good or bad) we should know about?
- What's the average days-on-market for RENTAL listings here right now (not sales)? A rising rental-DOM trend means longer vacancies and softer asking-rent achievability than the comps imply.
- What's the recent tenant-quality profile in this submarket — average credit score on applications, eviction rate, late-payment / NSF rate, and stable-employment percentage? A property-management company in the area should have these aggregated.
- How much new for-sale + rental construction is in the pipeline within 1–3 miles? Heavy new supply typically softens prices + rents 12–24 months out; constrained supply supports both.
Investment metrics
- 1% rule
- 0.73% ✗
- Cap rate
- 5.62%
- Cash-on-cash
- -2.42%
- DSCR
- 0.89
- GRM
- 11.4
CMA / ARV
- ARV (on-the-fly)
- $115,948
- Comps found
- 9
Show comp detail 9 sales within ~0.75 mi
| Address | Dist | Beds/Ba | Sqft | Sold | Price | $/sf | Match |
|---|---|---|---|---|---|---|---|
| 2006 N Jecker St | 0.20mi | 3/1.0 | 1,094 (-5%) | 7mo | $120,000 | $110 | 75 |
| 1002 E Park Ave | 0.32mi | 2/1.0 (-1) | 1,077 (-6%) | 2mo | $77,000 | $71 | 66 |
| 406 E North St | 0.61mi | 2/1.0 (-1) | 1,142 (-0%) | 9mo | $79,900 | $70 | 56 |
| 2005 Navidad St | 0.74mi | 3/2.0 | 1,220 (+6%) | 0mo | $170,000 | $139 | 53 |
| 705 E Hiller | 0.54mi | 3/2.0 | 1,293 (+13%) | 2mo | $92,000 | $71 | 50 |
| 1110 Buena Vista Ave | 0.54mi | 2/2.0 (-1) | 1,288 (+12%) | 4mo | $190,000 | $148 | 44 |
| 2003 E Guadalupe St | 0.74mi | 3/1.0 | 1,250 (+9%) | 7mo | $55,000 | $44 | 43 |
| 1306 N Moody St | 0.74mi | 3/2.0 | 1,044 (-9%) | 8mo | $125,000 | $120 | 42 |
| 1109 Manor Dr | 0.62mi | 2/1.0 (-1) | 988 (-14%) | 2mo | $99,500 | $101 | 39 |
Match score weights: distance 35% · size 25% · config 20% · recency 20%. Top-matched comps best support the ARV.
Projected returns pro-forma
-3.0% appreciation · 0.0% rent growth · sell at horizon
- IRR
- -23.4%
- Equity multiple
- 0.22×
- Total profit
- $-37,319
- Equity at exit
- $25,333
- IRR
- -28.0%
- Equity multiple
- -0.15×
- Total profit
- $-54,614
- Equity at exit
- $14,690
Cash invested: $47,572 (down + closing). Projections, not guarantees.
Landlord ↔ Tenant lean methodology
- Overall (STATE)
- 87 Strongly Landlord-Friendly
- State Texas
- 87 Strongly Landlord-Friendly · R+5
- County
- — inherits STATE
- City
- — inherits STATE
ZIP-level market 77901
- Rents YoY
- -0.8%
- Active inventory
- 196
- Price-to-rent
- 11.4×
Monthly cashflow live
- Estimated rent
- $1,245 high interval (Pro) →
- Mortgage (P&I)
- −$891
- Tax from tax record
- −$118 /mo · $1,414/yr
- Insurance
- −$71
- HOA
- −$0
- Vacancy / Maint / Mgmt
- −$262
- Net cashflow
- $-96
Break-even live
UW: 25.0% down · 7.5% · 30yr · 1.5% tax · 5.0% vac · 8.0% maint · 8.0% mgmt
Financing live
Cash to close
- Down payment
- $42,475
- Closing costs
- $5,097
- Reserves months
- —
- Total cash needed
- —
Loan-product check · same deal, 3 products live
Conventional
25% down · 7.5% · 30yr
- Down + closing
- —
- Monthly P&I
- —
- Monthly cashflow
- —
- DSCR
- —
- Eligible?
- —
Personal DTI + credit; lowest rate.
DSCR
20% down · 8.5% · 30yr
- Down + closing
- —
- Monthly P&I
- —
- Monthly cashflow
- —
- DSCR
- —
- Eligible?
- —
No personal income docs; deal must DSCR.
Hard money
10% down · 12.0% · 12mo
- Down + closing
- —
- Monthly P&I
- —
- Monthly cashflow
- —
- DSCR
- —
- Eligible?
- —
Short-term bridge; refi at stabilization.
Rent comps 9 comps
| Address | Beds | Baths | Sqft | Rent | $/sqft | DOM | Units | Dist |
|---|---|---|---|---|---|---|---|---|
| 305 E Sabine St Unit A Victoria, TX | 2.0 | 1.0 | 1224 | $1,150 | $0.94 | 43d | 1 | 0.39mi |
| 2303 N Louis St Unit 2307 Victoria, TX | 2.0 | 1.0 | 820 | $850 | $1.04 | 43d | 1 | 0.41mi |
| 2303 N Louis St Unit 2303 Victoria, TX | 3.0 | 1.0 | 850 | $950 | $1.12 | 43d | 1 | 0.41mi |
| 1603 E Brazos St Victoria, TX | 1.0–2.0 | 1.0 | 796 | $975 | $1.22 | 43d | 6 | 0.42mi |
| 1709 Navidad St Victoria, TX | 4.0 | 1.0 | 1457 | $1,595 | $1.09 | 43d | 1 | 0.55mi |
| 1810 E Colorado St Victoria, TX | 1.0–3.0 | 1.0–2.0 | 907 | $1,425 | $1.57 | 43d | 8 | 0.58mi |
| 1702 N Moody St Apt C1 Victoria, TX | 2.0 | 1.5 | 945 | $1,050 | $1.11 | 43d | 1 | 0.71mi |
| 3001 Arroyo Dr Victoria, TX | 1.0–2.0 | 1.0–2.0 | 857 | $1,330 | $1.55 | 43d | 4 | 0.80mi |
| 2402 N Ben Wilson St Victoria, TX | 1.0–2.0 | 1.0–2.0 | 987 | $1,580 | $1.60 | 43d | 20 | 1.34mi |
Listing history 17 events
-
2026-06-19days on market $169,900 Active 27 DOM
-
2026-06-18days on market $169,900 Active 26 DOM
-
2026-06-17days on market $169,900 Active 25 DOM
-
2026-06-16days on market $169,900 Active 24 DOM
-
2026-06-15days on market $169,900 Active 23 DOM
-
2026-06-14days on market $169,900 Active 21 DOM
-
2026-06-13days on market $169,900 Active 20 DOM
-
2026-06-10days on market $169,900 Active 18 DOM
-
2026-06-09days on market $169,900 Active 17 DOM
-
2026-06-08days on market $169,900 Active 16 DOM
-
2026-06-07days on market $169,900 Active 15 DOM
-
2026-06-03days on market $169,900 Active 11 DOM
-
2026-06-02days on market $169,900 Active 10 DOM
-
2026-06-01days on market $169,900 Active 9 DOM
-
2026-05-31days on market $169,900 Active 8 DOM
-
2026-05-30days on market $169,900 Active 7 DOM
-
2026-05-23$169,900 Active
ⓘ Source: listings_history table (triggers on properties + properties_extension) + one-shot
backfill from property_details.listing_events for pre-trigger history.
Tax reassessment forecast TX · Resets to sale price
- Current annual tax
- $1,414 · $118/mo
- Projected year-2 tax
- $3,109 · $259/mo
- Expected delta
- +$1,696/yr (+$141/mo · 119.9%)
ⓘ Screening estimate from a state-policy table — verify with the county assessor before closing.
Climate risk First Street
- Flood 5/10 Major FEMA zone X · 66% chance over 30 yrs
- Wildfire 4/10 Moderate
- Heat 9/10 Extreme 7 d/yr ≥111°F today · 21 d/yr by 30 yrs out
- Wind 8/10 Severe 99% chance of damaging wind over 30 yrs
- Air quality 1/10 Low 0 unhealthy d/yr today · 0 by 30 yrs out
Nearby sold comps map
Loading sold comps map…
Walkable amenities ~0.75 mi
Loading nearby amenities…
Taxation est. · year 1
- Rental income
- $14,944
- − Mortgage interest
- −$9,517
- − Property taxes
- −$1,414
- − Insurance
- −$850
- − Repairs & maintenance
- −$1,196
- − Management
- −$1,196
- − Depreciation
- −$4,943
- Taxable loss
- −$4,170
- Est. tax savings @ 24.0%
- +$1,001
- After-tax cash flow
- $-148/yr
For passive investors: Depreciation is non-cash, so a rental often shows a tax loss while cash-flowing — sheltering income. Rental losses are passive: they offset passive income freely, and up to $25,000/yr can offset ordinary (W-2) income if you actively participate and your MAGI is under $100k (phasing out to $0 by $150k); unused losses carry forward. On sale, claimed depreciation is recaptured at up to 25%, and gains may owe capital-gains tax (a 1031 exchange can defer both). Figures are a year-1 estimate at your 24.0% rate — not tax advice; consult a CPA.
Schools (NCES district)
- District
- Victoria ISD
- NCES district ID
- 4844150
- Math proficiency
- 24% ▼ -12.00%
- Reading proficiency
- 33% ▼ -2.00%
- Median HH income
- $50,534
- Composite
- 24.98/100
- National rank
- #7562
- State rank
- #645 of 826 in TX
Livability — Victoria
- Score
- 71/100
- State rank
- #309
- US rank
- #6960
Category grades
Schools grade is shown separately in the Schools card above.
Census & demographics
- Census place
- Victoria, TX
- County
- Victoria County · 69,915 people
- City population
- 69,915
- Metro
- Victoria, TX
- Population (ZIP)
- 39,854
- Household income
- $57,923
- Rent vs Own
- Severe rent burden
- 1802.0
Population outlook (Victoria County) Hauer SSP2
- Today (2025)
- 106,119 people
- By 2030
- 113,161 · +6.6%
- By 2040
- 127,402 · +20.1%
- By 2050
- 141,953 · +33.8%
- By 2075
- 179,410 · +69.1%
- By 2100
- 200,127 · +88.6%
Race, ethnicity, and origin ACS 2023
- Neighborhood character
- Predominantly Hispanic (66%)
- Race & ethnicity
- Hispanic / Latino 66% Two or more races 30% White 24% Black 7% Asian 2%
- Hispanic origin (detail)
- Mexican 60%
- Common ancestry
- Serbian 2% Lithuanian 1% Italian 1%
- Foreign-born
- 10% · Canada, China
- Languages at home
- 64% English-only · Spanish 35% Chinese 1%
Political lean MEDSL · Victoria
- 2024 margin
- Solid R (+42.6) · D 28.4% · R 71.0%
- 2008→2024 swing
- -9.0pp toward R · 2008: -33.6pp · 2024: -42.6pp
- All cycles
- 2024: R+42.6 2020: R+38.0 2016: R+40.0 2012: R+37.8 2008: R+33.6
Not yet ingested
- Civics
- —
Market trends
- HPI YoY
- ▼ -127.62%
- Current HPI
- 138.3569
- Rent YoY
- ▼ -0.79%
- Metro
- Victoria, TX
- State GDP YoY
- ▲ 3.95%
- F500 in state
- 110
Industry mix (Fortune 500 HQ in TX)
| Industry | F500 HQs | Revenue |
|---|---|---|
| Energy | 16 | $1,198B |
|
||
| Technology | 5 | $198B |
|
||
| Engineering / Construction | 4 | $72B |
|
||
| Energy Services | 3 | $60B |
|
||
| Utilities | 3 | $41B |
|
||
| Healthcare | 2 | $330B |
|
||
Price history
1 event — show timeline
- 2026-05-23 Listed $169,900 CTXMLS
Property tax history
-4.9%/yrLatest (2025): $1,414 · -43.6% YoY. Source: county tax records.
Cash-flow waterfall
monthlySold comps — $/sqft
last 12 mo · ≤1 miLoading sold comps…