3505 Hutchins St · Houston, TX
Flood risk 6/10 · Moderate
- FEMA flood zone
- X (unshaded)
- Chance of flooding over 30 yrs
- 0.69%
- Est. flood insurance / yr
- $507 – $1,088
Fire risk 1/10 · Minimal
- Est. fire insurance / yr
- $1,222 – $2,270
Heat risk 9/10 · Severe
- Hot days now (above 109°F)
- 7 days/yr
- Hot days in 30 yrs
- 24 days/yr
Wind risk 9/10 · Severe
- Chance of severe wind over 30 yrs
- 99.0%
Air-quality risk 2/10 · Minimal
- Unhealthy air days now
- 2 days/yr
- Unhealthy air days in 30 yrs
- 2 days/yr
Risk factors via First Street. Map © Google.
Why this score? — see what drove the D grade
The composite is a weighted blend of 9 inputs, each scored 0–100. Each bar is that input's sub-score; the figure is the points it added to the 100-point composite (weight × sub-score).
- ARV discount +13.6/15.0
- Cash flow +9.4/30.0
- Livability +3.7/5.0
- 1% rule +3.5/10.0
- Schools +2.7/10.0
- DSCR +2.6/10.0
- Condition / age +2.5/5.0
- Rent growth +2.4/5.0
- Appreciation +0.0/10.0
$399,000
🖨 Deal sheet (PDF) 📄 Offer letter ✓ Due diligence
Listing remarks MLS
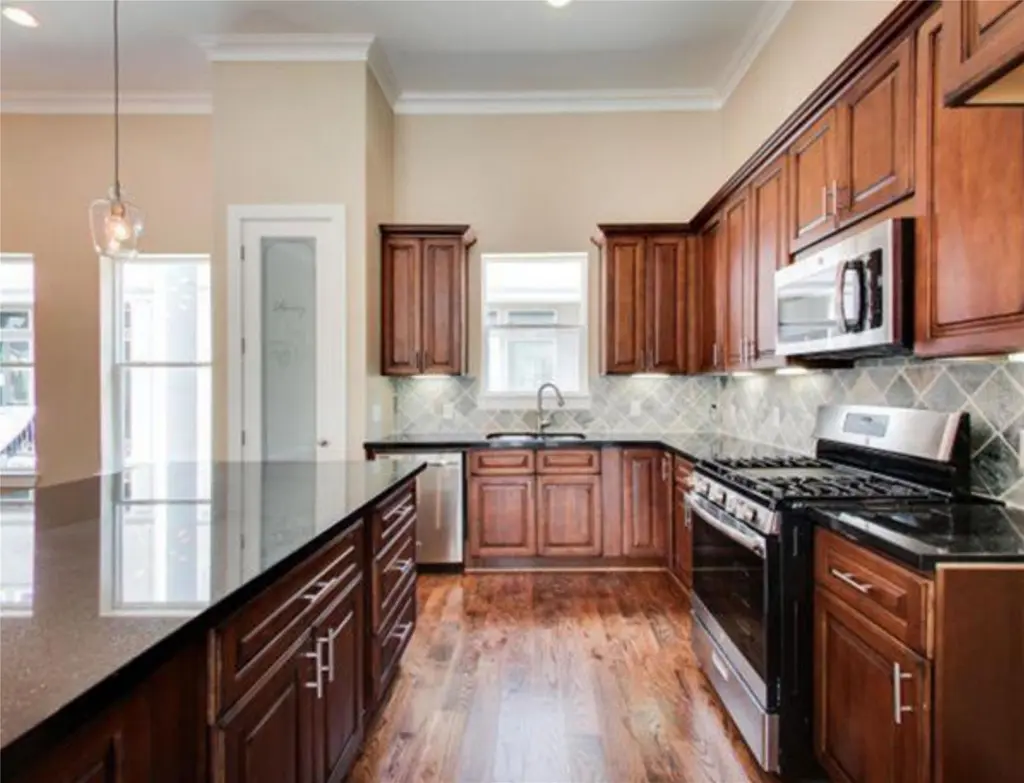
Charming 3-bedroom, 2-bath home located in the heart of Houston’s vibrant Third Ward area. This property offers an open living and dining layout, guest bath is private with its own floor, spacious bedrooms, and ample natural light throughout. NO CARPET, ONLY ENGINEERED WOOD FLOORING THROUGH OUT, Kitchen includes modern cabinetry and plenty of storage. Large Island, stylist granite on all counters and vanities, conveniently situated near Downtown, Midtown, the Museum District, and major freeways for easy commuting.
Key facts
- Plenty of storage
- Modern cabinetry
- Large island
Tags
Neighborhood map
What this means for you Summary
Snapshot
- This is a 3-bed/3.5-bath townhouse listed at $399k.
Deal economics
- At list price, monthly cash flow is $-288 ($-3k/yr) — negative.
- To cash-flow at today's rent, offer at most $348k (12.8% below list).
- To meet the 1% rule (rent ≥ 1% of price), the offer needs to be $337k (15.5% below list).
- Recommended offer: $337k (15.5% below list) — sets the bar for 1% rule.
- Cap rate 5.4% vs local median 3.2% in Houston — top-decile yield for the area; either an underpriced asset or a hidden risk that comps aren't pricing in. Stress-test before assuming the spread holds.
Location & tenants
- Location reads 74/100 on livability (#184 in TX, #4,771 nationally) — a middle-class / working-renter tenant base. Strengths: amenities A+, cost of living A+, housing A+; Watch: crime F.
- Houston ISD (urban): math 27% / reading 35% proficiency, ranked #593 of 826 in TX (top 72%) — families likely to look elsewhere, expect single-tenant / working-renter base with shorter leases; 71% free/reduced lunch — lower-income household profile, screen leases tightly.
- Zoned schools: Blackshear El (math 27% / reading 32%, grade F, #2,525 of 4,322 statewide, top 62%, 308 students, 99% FRL); Cullen Middle (math 6% / reading 14%, grade F, #1,641 of 1,662 statewide, top 99%, 324 students, 100% FRL); Yates H S (math 12% / reading 23%, grade F, #1,451 of 1,632 statewide, top 89%, 851 students, 96% FRL) — zoned schools average 98% FRL vs 71% district-wide (27 pts higher); higher-poverty schools than district average — tighter screening recommended.
- Zoned-school proficiency averages 19% at this address vs 31% district-wide (-12 pts) — the specific schools serving this property underperform the Houston ISD average; the district grade overstates school quality for this exact location.
- Market conditions: Rents soft (-0.3%/yr); 585 active listings in the ZIP; 40 comparable units currently listed for rent nearby; rentals at typical pace (median 19d on market — plan ~3-4 weeks tenant-placement turnaround); 40% of comp listings sitting > 30 days — soft ceiling on asking rent; 29,883 units permitted in Harris County in 2024 (8,621 in 5+ unit buildings).
- At $3,372/mo this rent would consume 57% of the median local household income ($71k/yr) (locally 3072% of renters already pay >50% of income on rent) — very limited rent-growth headroom before tenants either downsize or default.
Forward outlook
- Local home prices are declining (-3.0%/yr); year-one equity from $3k of loan paydown is wiped out by about $12k of value loss. Plan a longer hold.
- Harris County population projected at +47% by 2050 — long-run rental-demand tailwind backs the buy-and-hold thesis.
Negotiation context
- It's been on market 285 days — a 12% lower offer ($351k) is reasonable based on typical stale-listing flexibility.
- 14 sale attempts since 19y ago with the ask held roughly flat each time — persistent listings suggest the price (not the market) is what's stuck; bring a comps-based counter.
- Current owner paid $35k; list at $399k implies a 1054% gain — meaningful room to come down on a strong offer.
Risks & watch-outs
- Climate carrying-cost: major flood risk; severe wind risk, 99% chance of damaging wind over 30y; extreme-heat days projected 7→24/yr by 2055 (HVAC capex compounding) — expect insurance premiums to compound above CPI over the hold.
Questions for the listing agent
- What do current leases actually rent for vs. the listed asking? Can we see a recent rent roll and the last 12 months of T-12 income?
- It's been on market 285 days. Have you received any prior offers? Is the seller open to a 15% concession, seller financing, or rate buy-down credit?
- Why hasn't it sold? Are there any deal-killer items the seller is aware of (foundation, flood, title, zoning, code violations)?
- Is there a deadline driving the sale (1031 exchange, divorce, estate, relocation)? That informs how much negotiation room exists.
- Schools are D-rated, which usually means shorter tenancies and higher turnover. Who's the typical renter profile here, and what's been the actual vacancy rate?
- Crime grade is F in this area — have there been break-ins, vandalism, or insurance claims at this property in the last 3 years? What carrier currently insures it and at what premium?
- The area grade is low — what's the realistic commute time and amenity access for the typical tenant pool here? Any planned neighborhood developments (good or bad) we should know about?
- What's the average days-on-market for RENTAL listings here right now (not sales)? A rising rental-DOM trend means longer vacancies and softer asking-rent achievability than the comps imply.
- What's the recent tenant-quality profile in this submarket — average credit score on applications, eviction rate, late-payment / NSF rate, and stable-employment percentage? A property-management company in the area should have these aggregated.
- How much new for-sale + rental construction is in the pipeline within 1–3 miles? Heavy new supply typically softens prices + rents 12–24 months out; constrained supply supports both.
Investment metrics
- 1% rule
- 0.85% ✗
- Cap rate
- 5.43%
- Cash-on-cash
- -3.10%
- DSCR
- 0.86
- GRM
- 9.9
CMA / ARV
- ARV (median comp)
- $462,015
- List price
- $399,000
- Delta
- -13.64%
- Verdict
- UNDERPRICED
- Comps
- 20 within 1.0 mi
Show comp detail 12 sales within ~0.75 mi
| Address | Dist | Beds/Ba | Sqft | Sold | Price | $/sf | Match |
|---|---|---|---|---|---|---|---|
| 2007 Eagle St | 0.36mi | 3/3.5 | 2,657 (+4%) | 3mo | $440,000 | $166 | 74 |
| 3210 Bastrop Unit C | 0.15mi | 3/3.5 | 2,776 (+9%) | 14mo | $485,000 | $175 | 66 |
| 1814 Rosalie St | 0.30mi | 3/3.5 | 2,246 (-12%) | 10mo | $425,000 | $189 | 58 |
| 2020 Mcgowen St Unit 8E | 0.48mi | 3/3.5 | 2,267 (-11%) | 4mo | $399,900 | $176 | 56 |
| 3004 Chenevert St | 0.38mi | 3/3.5 | 2,276 (-11%) | 12mo | $305,000 | $134 | 55 |
| 3306 Jackson St | 0.35mi | 3/3.5 | 2,221 (-13%) | 11mo | $375,000 | $169 | 53 |
| 2020 Mcgowen St Unit T | 0.48mi | 3/3.5 | 2,267 (-11%) | 11mo | $400,000 | $176 | 50 |
| 2020 Mcgowen St Unit A | 0.48mi | 3/3.5 | 2,267 (-11%) | 12mo | $419,000 | $185 | 49 |
| 2020 Mcgowen St Unit U | 0.48mi | 3/3.5 | 2,267 (-11%) | 14mo | $385,000 | $170 | 47 |
| 2338 Bastrop St | 0.60mi | 3/3.5 | 2,295 (-10%) | 10mo | $385,000 | $168 | 47 |
| 2020 Mcgowen St Unit J | 0.48mi | 3/3.5 | 2,267 (-11%) | 16mo | $385,000 | $170 | 46 |
| 4808 Chenevert St | 0.75mi | 3/3.5 | 2,659 (+4%) | 15mo | $548,999 | $206 | 45 |
Match score weights: distance 35% · size 25% · config 20% · recency 20%. Top-matched comps best support the ARV.
Projected returns pro-forma
-3.0% appreciation · 0.0% rent growth · sell at horizon
- IRR
- -25.1%
- Equity multiple
- 0.17×
- Total profit
- $-92,727
- Equity at exit
- $59,492
- IRR
- -35.3%
- Equity multiple
- -0.27×
- Total profit
- $-141,885
- Equity at exit
- $34,498
Cash invested: $111,720 (down + closing). Projections, not guarantees.
Landlord ↔ Tenant lean methodology
- Overall (STATE)
- 87 Strongly Landlord-Friendly
- State Texas
- 87 Strongly Landlord-Friendly · R+5
- County
- — inherits STATE
- City
- — inherits STATE
ZIP-level market 77004
- Rents YoY
- -0.3%
- Active inventory
- 585
- Price-to-rent
- 9.9×
Monthly cashflow live
- Estimated rent
- $3,372 high interval (Pro) →
- Mortgage (P&I)
- −$2,092
- Tax from tax record
- −$694 /mo · $8,325/yr
- Insurance
- −$166
- HOA
- −$0
- Vacancy / Maint / Mgmt
- −$708
- Net cashflow
- $-288
Break-even live
Sensitivity live
| Price | -10% $-62 | -5% $-175 | +0% $-288 | +5% $-401 | +10% $-514 |
|---|---|---|---|---|---|
| Rent | -10% $-555 | -5% $-421 | +0% $-288 | +5% $-155 | +10% $-22 |
| Rate | -1.0pp $-87 | -0.5pp $-187 | base $-288 | +0.5pp $-392 | +1.0pp $-497 |
UW: 25.0% down · 7.5% · 30yr · 1.5% tax · 5.0% vac · 8.0% maint · 8.0% mgmt
Financing live
Cash to close
- Down payment
- $99,750
- Closing costs
- $11,970
- Reserves months
- —
- Total cash needed
- —
Loan-product check · same deal, 3 products live
Conventional
25% down · 7.5% · 30yr
- Down + closing
- —
- Monthly P&I
- —
- Monthly cashflow
- —
- DSCR
- —
- Eligible?
- —
Personal DTI + credit; lowest rate.
DSCR
20% down · 8.5% · 30yr
- Down + closing
- —
- Monthly P&I
- —
- Monthly cashflow
- —
- DSCR
- —
- Eligible?
- —
No personal income docs; deal must DSCR.
Hard money
10% down · 12.0% · 12mo
- Down + closing
- —
- Monthly P&I
- —
- Monthly cashflow
- —
- DSCR
- —
- Eligible?
- —
Short-term bridge; refi at stabilization.
Rent comps 40 comps
| Address | Beds | Baths | Sqft | Rent | $/sqft | DOM | Units | Dist |
|---|---|---|---|---|---|---|---|---|
| 3405 St Emanuel St Houston, TX | 4.0 | 5.0 | 2388 | $2,900 | $1.21 | 45d | 1 | 0.10mi |
| 2209 Alabama St Unit B Houston, TX | 3.0 | 2.5 | 2074 | $2,350 | $1.13 | 45d | 1 | 0.11mi |
| 3213 Saint Emanuel St Houston, TX | 4.0 | 3.5 | 2100 | $3,300 | $1.57 | 18d | 1 | 0.16mi |
| 2311 Eagle St Houston, TX | 3.0 | 4.0 | 1783 | $2,500 | $1.40 | 45d | 1 | 0.32mi |
| 1915 Cleburne St Houston, TX | 2.0 | 1.0 | 2766 | $1,800 | $0.65 | 45d | 1 | 0.33mi |
| 3010 Chenevert St Unit 3010 Houston, TX | 3.0 | 3.5 | 3203 | $8,000 | $2.50 | 45d | 1 | 0.41mi |
| 3010 Chenevert St Unit 1019638P Houston, TX | 3.0 | 3.5 | 3196 | $7,988 | $2.50 | 9d | 1 | 0.41mi |
| 2105 McGowen St Unit 1244936P Houston, TX | 3.0 | 3.5 | 2497 | $4,371 | $1.75 | 0d | 1 | 0.51mi |
| 2109 McGowen St Unit 1244934P Houston, TX | 3.0 | 3.5 | 2497 | $4,245 | $1.70 | 0d | 1 | 0.52mi |
| 2521 Saint Emanuel St Unit 1047945P Houston, TX | 3.0 | 3.0 | 2292 | $2,727 | $1.19 | 0d | 1 | 0.52mi |
| 2519 Saint Emanuel St Unit 1241246P Houston, TX | 3.0 | 3.0 | 2389 | $2,621 | $1.10 | 0d | 1 | 0.52mi |
| 2107 McGowen St Unit 1244935P Houston, TX | 3.0 | 3.5 | 2497 | $4,711 | $1.89 | 4d | 1 | 0.53mi |
| 2809 Crawford St Houston, TX | 2.0 | 2.0 | 1928 | $2,600 | $1.35 | 45d | 1 | 0.53mi |
| 2103 McGowen St Unit 1244937P Houston, TX | 3.0 | 3.5 | 2292 | $4,732 | $2.06 | 0d | 1 | 0.54mi |
| 2326 St Emanuel St Houston, TX | 3.0 | 3.5 | 2642 | $2,601 | $0.98 | 9d | 1 | 0.60mi |
| 4306 Ennis St Houston, TX | 3.0 | 3.0 | 1989 | $2,500 | $1.26 | 45d | 1 | 0.61mi |
| 1310 Anita St Houston, TX | 2.0 | 2.0 | 1760 | $2,695 | $1.53 | 45d | 1 | 0.63mi |
| 2721 Austin St Houston, TX | 3.0 | 4.0 | 2607 | $3,000 | $1.15 | 26d | 1 | 0.65mi |
| 2703 Blodgett St Unit 1047952P Houston, TX | 1.0–5.0 | 1.5–5.5 | 2497 | $12,804 | $5.13 | 0d | 2 | 0.65mi |
| 2357 Jackson St Houston, TX | 3.0 | 2.5 | 1908 | $2,500 | $1.31 | 23d | 1 | 0.69mi |
| 2403 Arbor St Houston, TX | 3.0 | 2.5 | 2344 | $2,800 | $1.19 | 45d | 1 | 0.71mi |
| 4001 Fannin St Houston, TX | 3.0 | 1.0–3.0 | 1536 | $3,158 | $2.06 | 0d | 18 | 0.73mi |
| 2416 La Branch St Houston, TX | 3.0 | 4.0 | 2540 | $2,900 | $1.14 | 45d | 1 | 0.74mi |
| 4606 Austin St Houston, TX | 3.0 | 3.5 | 2950 | $3,000 | $1.02 | 45d | 1 | 0.80mi |
| 3300 Main St Unit 3333 Houston, TX | 3.0 | 2.0 | 2861 | $7,493 | $2.62 | 12d | 1 | 0.83mi |
| 3300 Main St Unit 3165 Houston, TX | 3.0 | 2.0 | 2861 | $7,453 | $2.61 | 0d | 1 | 0.83mi |
| 3034 Gray St Houston, TX | 3.0 | 3.0 | 2081 | $3,000 | $1.44 | 45d | 1 | 0.88mi |
| 4908 Crawford St Houston, TX | 3.0 | 2.0 | 2526 | $3,250 | $1.29 | 45d | 1 | 0.89mi |
| 3335 Tuam St Houston, TX | 2.0 | 1.0 | 2300 | $995 | $0.43 | 45d | 1 | 0.93mi |
| 1216 Rosedale St Houston, TX | 3.0 | 3.5 | 2584 | $3,250 | $1.26 | 15d | 1 | 1.00mi |
| 1216 Rosedale St Houston, TX | 3.0 | 3.5 | 2584 | $3,250 | $1.26 | 14d | 1 | 1.00mi |
| 1910 Oakdale St Unit A Houston, TX | 3.0 | 3.5 | 2452 | $3,890 | $1.59 | 13d | 1 | 1.02mi |
| 1818 Prospect St Houston, TX | 3.0 | 2.0 | 2923 | $3,400 | $1.16 | 5d | 1 | 1.06mi |
| 3507 Canfield St Houston, TX | 3.0 | 2.5 | 2200 | $2,350 | $1.07 | 26d | 1 | 1.06mi |
| 5350 Crawford St Unit 3165 Houston, TX | 3.0 | 2.0 | 1991 | $4,420 | $2.22 | 0d | 1 | 1.10mi |
| 5350 Crawford St Unit 5383 Houston, TX | 3.0 | 2.0 | 1991 | $4,460 | $2.24 | 12d | 1 | 1.10mi |
| 5280 Caroline St Houston, TX | 1.0–3.0 | 1.0–3.5 | 1880 | $6,216 | $3.31 | 0d | 22 | 1.14mi |
| 5226 Caroline St Houston, TX | 2.0 | 2.0 | 1849 | $3,835 | $2.07 | 45d | 1 | 1.15mi |
| 3518 Dennis St Unit 1387517P Houston, TX | 4.0 | 4.0 | 2271 | $5,657 | $2.49 | 0d | 1 | 1.19mi |
| 420 Hawthorne St Houston, TX | 4.0 | 2.0 | 2230 | $3,373 | $1.51 | 45d | 1 | 1.20mi |
Listing history 49 events
-
2026-06-21days on market $399,000 Active 285 DOM
-
2026-06-18days on market $399,000 Active 282 DOM
-
2026-06-17days on market $399,000 Active 281 DOM
-
2026-06-16days on market $399,000 Active 280 DOM
-
2026-06-15days on market $399,000 Active 279 DOM
-
2026-06-13days on market $399,000 Active 277 DOM
-
2026-06-10days on market $399,000 Active 273 DOM
-
2026-06-08days on market $399,000 Active 272 DOM
-
2026-06-07days on market $399,000 Active 271 DOM
-
2026-06-04days on market $399,000 Active 268 DOM
-
2026-06-01days on market $399,000 Active 265 DOM
-
2026-05-31days on market $399,000 Active 264 DOM
-
2025-10-09price $399,000 525-char remark
Show marketing remark (525 chars)
Charming 3-bedroom, 2-bath home located in the heart of Houston’s vibrant Third Ward area. This property offers an open living and dining layout, guest bath is private with its own floor, spacious bedrooms, and ample natural light throughout. NO CARPET, ONLY ENGINEERED WOOD FLOORING THROUGH OUT, Kitchen includes modern cabinetry and plenty of storage. Large Island, stylist granite on all counters and vanities, conveniently situated near Downtown, Midtown, the Museum District, and major freeways for easy commuting.
-
2025-09-09$419,000 Active 525-char remark
Show marketing remark (525 chars)
Charming 3-bedroom, 2-bath home located in the heart of Houston’s vibrant Third Ward area. This property offers an open living and dining layout, guest bath is private with its own floor, spacious bedrooms, and ample natural light throughout. NO CARPET, ONLY ENGINEERED WOOD FLOORING THROUGH OUT, Kitchen includes modern cabinetry and plenty of storage. Large Island, stylist granite on all counters and vanities, conveniently situated near Downtown, Midtown, the Museum District, and major freeways for easy commuting.
-
2025-09-03historical
-
2025-06-02$449,900 Active
-
2024-10-22historical $2,500
-
2024-05-31$2,500
-
2023-09-10historical
-
2023-04-19price $449,000
-
2023-04-18price $449,900
-
2023-04-18price $100
-
2022-09-10$449,000 Active
-
2019-10-20historical
-
2018-10-22price $399,900
-
2018-10-22status Active
-
2018-10-20historical
-
2017-10-21$424,900 Active
-
2017-10-18historical
-
2017-08-05$425,000 Active
-
2017-07-31historical
-
2016-08-01status Active
-
2016-08-01historical
-
2016-07-10$425,000 Active
-
2014-12-04historical
-
2014-12-01$190,000 Active
-
2013-06-20soldstatus Sold
-
2013-06-14soldstatus
-
2013-01-16$68,500 Active
-
2013-01-02historical
-
2012-12-15price $68,500
-
2011-06-11$69,000 Active
-
2010-09-14historical
-
2010-08-11soldstatus
-
2010-03-10$49,500
-
2010-02-25soldstatus
-
2007-08-15historical
-
2007-02-15$125,000
-
1997-05-09soldstatus $34,580
ⓘ Source: listings_history table (triggers on properties + properties_extension) + one-shot
backfill from property_details.listing_events for pre-trigger history.
Tax reassessment forecast TX · Resets to sale price
- Current annual tax
- $8,325 · $694/mo
- Projected year-2 tax
- $8,325 · $694/mo
- Expected delta
- $0/yr ($0/mo · 0.0%)
ⓘ Screening estimate from a state-policy table — verify with the county assessor before closing.
Climate risk First Street
- Flood 6/10 Major FEMA zone X (unshaded) · 69% chance over 30 yrs
- Wildfire 1/10 Low
- Heat 9/10 Extreme 7 d/yr ≥109°F today · 24 d/yr by 30 yrs out
- Wind 9/10 Extreme 99% chance of damaging wind over 30 yrs
- Air quality 2/10 Low 2 unhealthy d/yr today · 2 by 30 yrs out
Nearby sold comps map
Loading sold comps map…
Walkable amenities ~0.75 mi
Loading nearby amenities…
Taxation est. · year 1
- Rental income
- $40,468
- − Mortgage interest
- −$22,350
- − Property taxes
- −$8,325
- − Insurance
- −$1,995
- − Repairs & maintenance
- −$3,237
- − Management
- −$3,237
- − Depreciation
- −$11,607
- Taxable loss
- −$10,284
- Est. tax savings @ 24.0%
- +$2,468
- After-tax cash flow
- $-991/yr
For passive investors: Depreciation is non-cash, so a rental often shows a tax loss while cash-flowing — sheltering income. Rental losses are passive: they offset passive income freely, and up to $25,000/yr can offset ordinary (W-2) income if you actively participate and your MAGI is under $100k (phasing out to $0 by $150k); unused losses carry forward. On sale, claimed depreciation is recaptured at up to 25%, and gains may owe capital-gains tax (a 1031 exchange can defer both). Figures are a year-1 estimate at your 24.0% rate — not tax advice; consult a CPA.
Schools (NCES district)
- District
- Houston ISD
- NCES district ID
- 4823640
- Math proficiency
- 27% ▼ -18.00%
- Reading proficiency
- 35% ▼ -6.00%
- Median HH income
- $46,054
- Composite
- 26.63/100
- National rank
- #7173
- State rank
- #593 of 826 in TX
Livability — Houston
- Score
- 74/100
- State rank
- #184
- US rank
- #4771
Category grades
Schools grade is shown separately in the Schools card above.
Census & demographics
- Census place
- Houston, TX
- County
- Harris County · 4,702,590 people
- City population
- 3,226,434
- Metro
- Houston-The Woodlands-Sugar Land, TX
- Population (ZIP)
- 35,997
- Household income
- $71,199
- Rent vs Own
- Severe rent burden
- 3072.0
Population outlook (Harris County) Hauer SSP2
- Today (2025)
- 5,571,493 people
- By 2030
- 6,089,821 · +9.3%
- By 2040
- 7,142,806 · +28.2%
- By 2050
- 8,185,864 · +46.9%
- By 2075
- 10,574,329 · +89.8%
- By 2100
- 12,109,958 · +117.4%
Race, ethnicity, and origin ACS 2023
- Neighborhood character
- Diverse neighborhood (Simpson 0.68)
- Race & ethnicity
- Black 48% White 27% Hispanic / Latino 13% Two or more races 11% Asian 8%
- Hispanic origin (detail)
- Mexican 9%
- Common ancestry
- Lithuanian 1% Romanian 1% Italian 1%
- Foreign-born
- 14% · Canada, China, South Korea
- Languages at home
- 82% English-only · Spanish 10% Chinese 2% Other Indo-European 2%
Political lean MEDSL · Harris
- 2024 margin
- Lean D (+5.5) · D 52.0% · R 46.4% · Other 1.6%
- 2008→2024 swing
- +3.9pp toward D · 2008: 1.6pp · 2024: 5.5pp
- All cycles
- 2024: D+5.5 2020: D+13.3 2016: D+12.4 2012: D+0.1 2008: D+1.6
Not yet ingested
- Civics
- —
Market trends
- HPI YoY
- ▼ -139.34%
- Current HPI
- 199.6066
- Rent YoY
- ▼ -0.32%
- Metro
- Houston-The Woodlands-Sugar Land, TX
- State GDP YoY
- ▲ 3.95%
- F500 in state
- 110
Industry mix (Fortune 500 HQ in TX)
| Industry | F500 HQs | Revenue |
|---|---|---|
| Energy | 16 | $1,198B |
|
||
| Technology | 5 | $198B |
|
||
| Engineering / Construction | 4 | $72B |
|
||
| Energy Services | 3 | $60B |
|
||
| Utilities | 3 | $41B |
|
||
| Healthcare | 2 | $330B |
|
||
Price history
+1053.8% since first listed37 events — show timeline
- 2025-10-09 Price Changed $399,000 HARMLS
- 2025-09-09 Listed $419,000 HARMLS
- 2025-09-03 Listing Removed — HARMLS
- 2025-06-02 Listed $449,900 HARMLS
- 2024-10-22 Rental Removed $2,500 HARMLS
- 2024-05-31 Listed for Rent $2,500 HARMLS
- 2023-09-10 Listing Removed — HARMLS
- 2023-04-19 Price Changed $449,000 HARMLS
- 2023-04-18 Price Changed $449,900 HARMLS
- 2023-04-18 Price Changed $100 HARMLS
- 2022-09-10 Listed $449,000 HARMLS
- 2019-10-20 Listing Removed — HARMLS
- 2018-10-22 Price Changed $399,900 HARMLS
- 2018-10-22 Relisted — HARMLS
- 2018-10-20 Listing Removed — HARMLS
- 2017-10-21 Listed $424,900 HARMLS
- 2017-10-18 Listing Removed — HARMLS
- 2017-08-05 Listed $425,000 HARMLS
- 2017-07-31 Listing Removed — HARMLS
- 2016-08-01 Relisted — HARMLS
- 2016-08-01 Listing Removed — HARMLS
- 2016-07-10 Listed $425,000 HARMLS
- 2014-12-04 Listing Removed — HARMLS
- 2014-12-01 Listed $190,000 HARMLS
- 2013-06-20 Sold (MLS) — HARMLS
- 2013-06-14 Sold (Public Records) — Public Records
- 2013-01-16 Listed $68,500 HARMLS
- 2013-01-02 Listing Removed — HARMLS
- 2012-12-15 Price Changed $68,500 HARMLS
- 2011-06-11 Listed $69,000 HARMLS
- 2010-09-14 Listing Removed — HARMLS
- 2010-08-11 Sold (Public Records) — Public Records
- 2010-03-10 Listed $49,500 HARMLS
- 2010-02-25 Sold (Public Records) — Public Records
- 2007-08-15 Listing Removed — HARMLS
- 2007-02-15 Listed $125,000 HARMLS
- 1997-05-09 Sold (Public Records) $34,580 Public Records
Property tax history
+6.3%/yrLatest (2025): $8,325 · -4.6% YoY. Source: county tax records.
Cash-flow waterfall
monthlySold comps — $/sqft
last 12 mo · ≤1 miLoading sold comps…