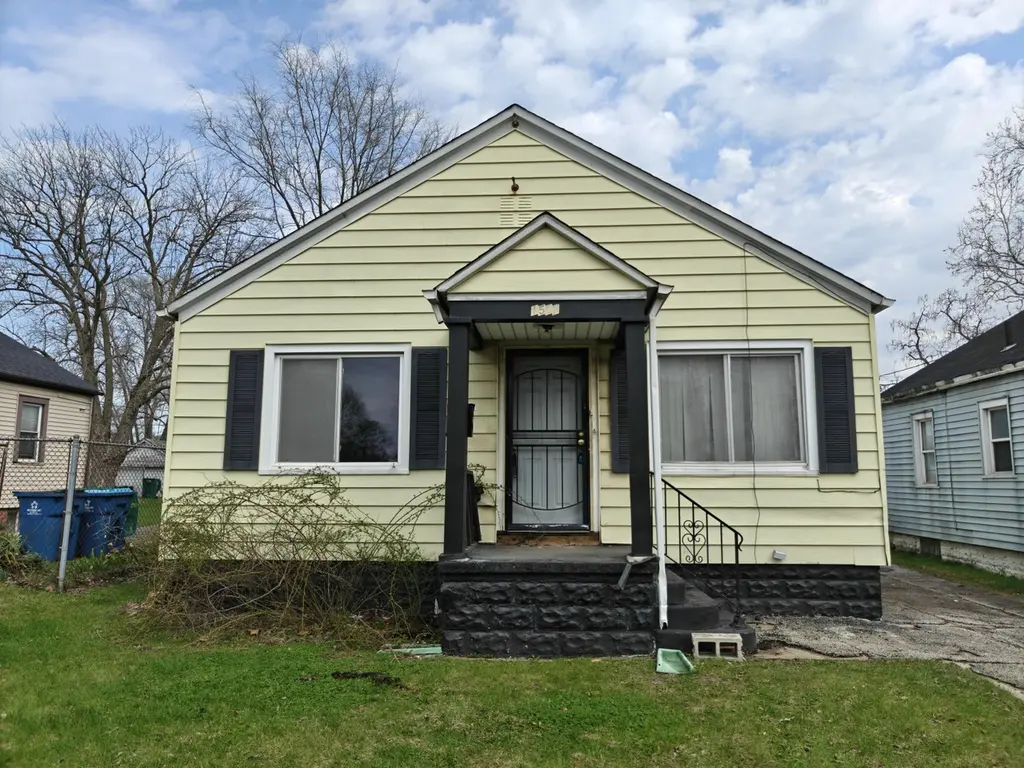
1567 Rutledge St · Gary, IN
Flood risk 1/10 · Minimal
- FEMA flood zone
- X (unshaded)
- Chance of flooding over 30 yrs
- 0.0%
- Est. flood insurance / yr
- $473 – $860
Fire risk 1/10 · Minimal
- Est. fire insurance / yr
- $717 – $1,331
Heat risk 3/10 · Minor
- Hot days now (above 102°F)
- 7 days/yr
- Hot days in 30 yrs
- 15 days/yr
Wind risk 2/10 · Minimal
- Chance of severe wind over 30 yrs
- 1.0%
Air-quality risk 4/10 · Minor
- Unhealthy air days now
- 5 days/yr
- Unhealthy air days in 30 yrs
- 6 days/yr
Risk factors via First Street. Map © Google.
Why this score? — see what drove the C+ grade
The composite is a weighted blend of 9 inputs, each scored 0–100. Each bar is that input's sub-score; the figure is the points it added to the 100-point composite (weight × sub-score).
- Cash flow +25.9/30.0
- DSCR +8.7/10.0
- ARV discount +7.5/15.0
- 1% rule +6.4/10.0
- Rent growth +5.0/5.0
- Livability +3.7/5.0
- Condition / age +2.5/5.0
- Schools +0.5/10.0
- Appreciation +0.0/10.0
$104,900
🖨 Deal sheet (PDF) 📄 Offer letter ✓ Due diligence
Listing remarks MLS
This 2 bedroom, 1 bath home in Gary offers a great opportunity for someone looking to build equity or add to their investment portfolio. With potential to convert to a 3 bedroom, 2 bath and add value through the basement, there is clear upside in the layout and overall footprint. The detached 1 car garage adds to the appeal, and the property is well suited for a handy homeowner, rental hold, or flip. Sold as is.
Key facts
- 5,227 sq ft lot
- Garage
- Built 1939
Neighborhood map
What this means for you Summary
Snapshot
- This is a 2-bed/1.0-bath single-family listed at $105k.
Deal economics
- At list price, monthly cash flow is $258 ($3k/yr) — positive.
- The deal already cash-flows at list — no discount required.
- Meets the 1% rule at list price ($1k rent vs $105k).
- Recommended offer: $99k (6.0% below list) — sets the bar for market timing.
Location & tenants
- Location reads 73/100 on livability (#105 in IN) — a middle-class / working-renter tenant base. Strengths: commute A+, cost of living A+, housing A+; Watch: schools F, crime F, employment F.
- Gary Community School Corporation (urban): math 3% / reading 11% proficiency, ranked #299 of 301 in IN (top 99%) — low school quality limits family demand, transient renter base, plan for 1-2y turnover; 80% free/reduced lunch — lower-income household profile, screen leases tightly.
- Market conditions: Rents rising fast (+11.6%/yr); 69 active listings in the ZIP; 23 comparable units currently listed for rent nearby; rentals leasing fast (median 0d on market — plan ~1-2 weeks tenant-placement turnaround); lower-income renter base — watch delinquency; 1,642 units permitted in Lake County in 2024 (14 in 5+ unit buildings).
- This rent runs 34% of the median local income ($42k/yr) — at the standard rent-burdened threshold; future hikes will face affordability resistance.
Forward outlook
- Local home prices are declining (-3.0%/yr); year-one equity from $725 of loan paydown is wiped out by about $3k of value loss. Plan a longer hold.
- Lake County population projected to shrink 7% by 2050 — rents likely to lag national; underwrite the cash flow, not the appreciation.
- At projected returns (-3.0% appreciation + 8.0% rent growth), your $29k cash investment doubles in ~8 years — after that, you're playing with house money.
Negotiation context
- It's been on market 82 days — a 6% lower offer ($99k) is reasonable based on typical stale-listing flexibility.
Risks & watch-outs
- Watch-outs: built in 1939 — expect roof / HVAC / electrical / plumbing capex.
Questions for the listing agent
- It's been on market 82 days. Have you received any prior offers? Is the seller open to a 6% concession, seller financing, or rate buy-down credit?
- Built in 1939 — when were the roof, HVAC, electrical panel, plumbing, and water heater last replaced?
- Why hasn't it sold? Are there any deal-killer items the seller is aware of (foundation, flood, title, zoning, code violations)?
- Is there a deadline driving the sale (1031 exchange, divorce, estate, relocation)? That informs how much negotiation room exists.
- Schools are F-rated, which usually means shorter tenancies and higher turnover. Who's the typical renter profile here, and what's been the actual vacancy rate?
- Crime grade is F in this area — have there been break-ins, vandalism, or insurance claims at this property in the last 3 years? What carrier currently insures it and at what premium?
- What's the average days-on-market for RENTAL listings here right now (not sales)? A rising rental-DOM trend means longer vacancies and softer asking-rent achievability than the comps imply.
- What's the recent tenant-quality profile in this submarket — average credit score on applications, eviction rate, late-payment / NSF rate, and stable-employment percentage? A property-management company in the area should have these aggregated.
- How much new for-sale + rental construction is in the pipeline within 1–3 miles? Heavy new supply typically softens prices + rents 12–24 months out; constrained supply supports both.
Investment metrics
- 1% rule
- 1.14% ✓
- Cap rate
- 9.24%
- Cash-on-cash
- 10.54%
- DSCR
- 1.47
- GRM
- 7.3
CMA / ARV
- ARV (median comp)
- $55,835
- List price
- $104,900
- Delta
- 87.88%
- Verdict
- OVERPRICED
- Comps
- 20 within 1.0 mi
Show comp detail 12 sales within ~0.75 mi
| Address | Dist | Beds/Ba | Sqft | Sold | Price | $/sf | Match |
|---|---|---|---|---|---|---|---|
| 1717 W Taft St | 0.09mi | 2/1.0 | 780 (-6%) | 3mo | $55,000 | $71 | 83 |
| 1665 W 12th Ave | 0.52mi | 2/1.0 | 842 (+1%) | 3mo | $13,000 | $15 | 71 |
| 2412 W 19th Ave | 0.15mi | 2/1.0 | 743 (-11%) | 6mo | $34,000 | $46 | 70 |
| 2025 Roosevelt Pl | 0.35mi | 3/1.5 (+1) | 802 (-4%) | 1mo | $19,000 | $24 | 70 |
| 2963 W 12th Ave | 0.48mi | 2/1.0 | 861 (+4%) | 3mo | $50,000 | $58 | 69 |
| 1548 Taney St | 0.34mi | 2/1.0 | 916 (+10%) | 2mo | $40,000 | $44 | 66 |
| 2280 Roosevelt Pl | 0.65mi | 3/1.0 (+1) | 864 (+4%) | 1mo | $110,000 | $127 | 58 |
| 2060 Mckinley St | 0.43mi | 3/1.0 (+1) | 912 (+10%) | 2mo | $53,000 | $58 | 57 |
| 2133 Mckinley St | 0.53mi | 3/1.0 (+1) | 864 (+4%) | 11mo | $65,000 | $75 | 55 |
| 1567 Hayes St | 0.50mi | 2/1.0 | 934 (+12%) | 4mo | $29,000 | $31 | 53 |
| 2288 W Taft St | 0.65mi | 3/1.0 (+1) | 864 (+4%) | 7mo | $125,000 | $145 | 52 |
| 785 Taney St | 0.73mi | 3/1.0 (+1) | 936 (+12%) | 6mo | $83,000 | $89 | 34 |
Match score weights: distance 35% · size 25% · config 20% · recency 20%. Top-matched comps best support the ARV.
Projected returns pro-forma
-3.0% appreciation · 8.0% rent growth · sell at horizon
- IRR
- 4.8%
- Equity multiple
- 1.20×
- Total profit
- $5,739
- Equity at exit
- $15,641
- IRR
- 18.3%
- Equity multiple
- 2.87×
- Total profit
- $54,845
- Equity at exit
- $9,070
Cash invested: $29,372 (down + closing). Projections, not guarantees.
Landlord ↔ Tenant lean methodology
- Overall (STATE)
- 90 Strongly Landlord-Friendly
- State Indiana
- 90 Strongly Landlord-Friendly · R+11
- County
- — inherits STATE
- City
- — inherits STATE
ZIP-level market 46404
- Home prices YoY
- -4.8%
- Rents YoY
- 11.6%
- Active inventory
- 69
- Price-to-rent
- 7.3×
Monthly cashflow live
- Estimated rent
- $1,194 high interval (Pro) →
- Mortgage (P&I)
- −$550
- Tax from tax record
- −$91 /mo · $1,094/yr
- Insurance
- −$44
- HOA
- −$0
- Lot rent
- −$0
- Vacancy / Maint / Mgmt
- −$251
- Net cashflow
- $258
Break-even live
Sensitivity live
| Price | -10% $317 | -5% $288 | +0% $258 | +5% $228 | +10% $199 |
|---|---|---|---|---|---|
| Rent | -10% $164 | -5% $211 | +0% $258 | +5% $305 | +10% $352 |
| Rate | -1.0pp $311 | -0.5pp $285 | base $258 | +0.5pp $231 | +1.0pp $203 |
UW: 25.0% down · 7.5% · 30yr · 1.5% tax · 5.0% vac · 8.0% maint · 8.0% mgmt
Financing live
Cash to close
- Down payment
- $26,225
- Closing costs
- $3,147
- Reserves months
- —
- Total cash needed
- —
Loan-product check · same deal, 3 products live
Conventional
25% down · 7.5% · 30yr
- Down + closing
- —
- Monthly P&I
- —
- Monthly cashflow
- —
- DSCR
- —
- Eligible?
- —
Personal DTI + credit; lowest rate.
DSCR
20% down · 8.5% · 30yr
- Down + closing
- —
- Monthly P&I
- —
- Monthly cashflow
- —
- DSCR
- —
- Eligible?
- —
No personal income docs; deal must DSCR.
Hard money
10% down · 12.0% · 12mo
- Down + closing
- —
- Monthly P&I
- —
- Monthly cashflow
- —
- DSCR
- —
- Eligible?
- —
Short-term bridge; refi at stabilization.
Rent comps 23 comps
| Address | Beds | Baths | Sqft | Rent | $/sqft | DOM | Units | Dist |
|---|---|---|---|---|---|---|---|---|
| 1595 Ellsworth St Gary, IN | 2.0 | 1.0 | 868 | $1,100 | $1.27 | 4d | 1 | 0.08mi |
| 1595 Ellsworth St Unit 1 Gary, IN | 2.0 | 1.0 | 868 | $1,100 | $1.27 | 0d | 1 | 0.08mi |
| 1531 Taney Pl Gary, IN | 2.0 | 1.0 | 900 | $1,045 | $1.16 | 3d | 1 | 0.37mi |
| 2939 W 10th Ave Gary, IN | 2.0 | 1.0 | 744 | $1,190 | $1.60 | 0d | 1 | 0.56mi |
| 2264 Taft St Gary, IN | 2.0 | 1.0 | 800 | $1,275 | $1.59 | 0d | 1 | 0.65mi |
| 2280 Roosevelt Pl Gary, IN | 3.0 | 1.0 | 864 | $1,560 | $1.81 | 0d | 1 | 0.68mi |
| 2602 W 6th Ave Gary, IN | 2.0 | 1.0 | 750 | $990 | $1.32 | 0d | 1 | 0.80mi |
| 1521 Pierce St Unit 1 Gary, IN | 2.0 | 1.0 | 800 | $850 | $1.06 | 0d | 1 | 0.81mi |
| 840 W 19th Ave Gary, IN | 2.0 | 1.0 | 1035 | $1,150 | $1.11 | 21d | 1 | 1.02mi |
| 2306 W 5th Ave Apt 3 Gary, IN | 3.0 | 1.0 | 1025 | $1,299 | $1.27 | 0d | 1 | 1.05mi |
| 2306 W 5th Ave Gary, IN | 2.0–3.0 | 1.0 | 937 | $1,199 | $1.28 | 0d | 2 | 1.05mi |
| 4061 W 20th Pl Gary, IN | 3.0 | 1.0 | 925 | $1,450 | $1.57 | 0d | 1 | 1.11mi |
| 2361 Pierce St Unit 2 Gary, IN | 3.0 | 1.0 | 860 | $900 | $1.05 | 0d | 1 | 1.13mi |
| 762 Harrison St Unit SRO Gary, IN | 1.0 | 1.0 | 1075 | $700 | $0.65 | 0d | 1 | 1.22mi |
| 358 Arthur St Unit 2 Gary, IN | 2.0 | 1.0 | 800 | $1,250 | $1.56 | 0d | 1 | 1.23mi |
| 358 Arthur St Unit 2 Gary, IN | 1.0 | 1.0 | 800 | $1,080 | $1.35 | 46d | 1 | 1.23mi |
| 329 Marshall St Unit 1 Gary, IN | 1.0 | 1.0 | 997 | $900 | $0.90 | 0d | 1 | 1.24mi |
| 4134 W 22nd Pl Gary, IN | 3.0 | 1.0 | 825 | $1,395 | $1.69 | 1d | 1 | 1.24mi |
| 317 Garfield St Gary, IN | 3.0 | 1.0 | 936 | $1,495 | $1.60 | 46d | 1 | 1.31mi |
| 4300 W 22nd Pl Gary, IN | 3.0 | 1.0 | 977 | $1,395 | $1.43 | 4d | 1 | 1.37mi |
| 411 Pierce St Gary, IN | 3.0 | 1.0 | 874 | $1,395 | $1.60 | 24d | 1 | 1.38mi |
| 4328 W 22nd Plz Gary, IN | 3.0 | 1.0 | 950 | $1,300 | $1.37 | 5d | 1 | 1.40mi |
| 2378 Jackson St Gary, IN | 2.0 | 1.0 | 672 | $1,050 | $1.56 | 0d | 1 | 1.45mi |
Listing history 21 events
-
2026-06-22days on market $104,900 Active 82 DOM
-
2026-06-21days on market $104,900 Active 81 DOM
-
2026-06-18days on market $104,900 Active 78 DOM
-
2026-06-17days on market $104,900 Active 77 DOM
-
2026-06-16days on market $104,900 Active 76 DOM
-
2026-06-15days on market $104,900 Active 75 DOM
-
2026-06-13days on market $104,900 Active 73 DOM
-
2026-06-13days on market $104,900 Active 72 DOM
-
2026-06-09days on market $104,900 Active 69 DOM
-
2026-06-08days on market $104,900 Active 68 DOM
-
2026-06-07days on market $104,900 Active 67 DOM
-
2026-06-04days on market $104,900 Active 64 DOM
-
2026-06-03days on market $104,900 Active 63 DOM
-
2026-06-02days on market $104,900 Active 62 DOM
-
2026-06-01days on market $104,900 Active 61 DOM
-
2026-05-31days on market $104,900 Active 60 DOM
-
2026-05-12price $104,900 415-char remark
Show marketing remark (415 chars)
This 2 bedroom, 1 bath home in Gary offers a great opportunity for someone looking to build equity or add to their investment portfolio. With potential to convert to a 3 bedroom, 2 bath and add value through the basement, there is clear upside in the layout and overall footprint. The detached 1 car garage adds to the appeal, and the property is well suited for a handy homeowner, rental hold, or flip. Sold as is.
-
2026-04-22price $109,900 415-char remark
Show marketing remark (415 chars)
This 2 bedroom, 1 bath home in Gary offers a great opportunity for someone looking to build equity or add to their investment portfolio. With potential to convert to a 3 bedroom, 2 bath and add value through the basement, there is clear upside in the layout and overall footprint. The detached 1 car garage adds to the appeal, and the property is well suited for a handy homeowner, rental hold, or flip. Sold as is.
-
2026-04-16price $114,900 415-char remark
Show marketing remark (415 chars)
This 2 bedroom, 1 bath home in Gary offers a great opportunity for someone looking to build equity or add to their investment portfolio. With potential to convert to a 3 bedroom, 2 bath and add value through the basement, there is clear upside in the layout and overall footprint. The detached 1 car garage adds to the appeal, and the property is well suited for a handy homeowner, rental hold, or flip. Sold as is.
-
2026-04-10price $118,900 415-char remark
Show marketing remark (415 chars)
This 2 bedroom, 1 bath home in Gary offers a great opportunity for someone looking to build equity or add to their investment portfolio. With potential to convert to a 3 bedroom, 2 bath and add value through the basement, there is clear upside in the layout and overall footprint. The detached 1 car garage adds to the appeal, and the property is well suited for a handy homeowner, rental hold, or flip. Sold as is.
-
2026-04-01$119,900 Active 415-char remark
Show marketing remark (415 chars)
This 2 bedroom, 1 bath home in Gary offers a great opportunity for someone looking to build equity or add to their investment portfolio. With potential to convert to a 3 bedroom, 2 bath and add value through the basement, there is clear upside in the layout and overall footprint. The detached 1 car garage adds to the appeal, and the property is well suited for a handy homeowner, rental hold, or flip. Sold as is.
ⓘ Source: listings_history table (triggers on properties + properties_extension) + one-shot
backfill from property_details.listing_events for pre-trigger history.
Tax reassessment forecast IN · Partial reset (capped growth)
- Current annual tax
- $1,094 · $91/mo
- Projected year-2 tax
- $1,094 · $91/mo
- Expected delta
- $0/yr ($0/mo · 0.0%)
ⓘ Screening estimate from a state-policy table — verify with the county assessor before closing.
Climate risk First Street
- Flood 1/10 Low FEMA zone X (unshaded) · 0% chance over 30 yrs
- Wildfire 1/10 Low
- Heat 3/10 Moderate 7 d/yr ≥102°F today · 15 d/yr by 30 yrs out
- Wind 2/10 Low 100% chance of damaging wind over 30 yrs
- Air quality 4/10 Moderate 5 unhealthy d/yr today · 6 by 30 yrs out
Nearby sold comps map
Loading sold comps map…
Walkable amenities ~0.75 mi
Loading nearby amenities…
Taxation est. · year 1
- Rental income
- $14,324
- − Mortgage interest
- −$5,876
- − Property taxes
- −$1,094
- − Insurance
- −$524
- − Repairs & maintenance
- −$1,146
- − Management
- −$1,146
- − Depreciation
- −$3,052
- Taxable income
- $1,486
- Est. tax owed @ 24.0%
- −$357
- After-tax cash flow
- $2,740/yr
For passive investors: Depreciation is non-cash, so a rental often shows a tax loss while cash-flowing — sheltering income. Rental losses are passive: they offset passive income freely, and up to $25,000/yr can offset ordinary (W-2) income if you actively participate and your MAGI is under $100k (phasing out to $0 by $150k); unused losses carry forward. On sale, claimed depreciation is recaptured at up to 25%, and gains may owe capital-gains tax (a 1031 exchange can defer both). Figures are a year-1 estimate at your 24.0% rate — not tax advice; consult a CPA.
Schools (NCES district)
- District
- Gary Community School Corporation
- NCES district ID
- 1803870
- Math proficiency
- 3% ▼ -10.00%
- Reading proficiency
- 11% ▼ -6.00%
- Median HH income
- $27,739
- Composite
- 4.98/100
- National rank
- #10039
- State rank
- #299 of 301 in IN
Livability — Gary
- Score
- 73/100
- State rank
- #105
- US rank
- #5592
Category grades
Schools grade is shown separately in the Schools card above.
Census & demographics
- Census place
- Gary, IN
- County
- Lake County · 422,878 people
- City population
- 63,701
- Metro
- Chicago-Naperville-Elgin, IL-IN-WI
- Population (ZIP)
- 15,428
- Household income
- $42,256
- Rent vs Own
- Severe rent burden
- 800.0
Population outlook (Lake County) Hauer SSP2
- Today (2025)
- 484,026 people
- By 2030
- 478,091 · -1.2%
- By 2040
- 462,974 · -4.3%
- By 2050
- 449,894 · -7.1%
- By 2075
- 436,169 · -9.9%
- By 2100
- 426,607 · -11.9%
Race, ethnicity, and origin ACS 2023
- Neighborhood character
- Predominantly Black (90%)
- Race & ethnicity
- Black 90% Two or more races 5% Hispanic / Latino 5% White 1%
- Foreign-born
- 1% · Canada
- Languages at home
- 99% English-only · Spanish 1%
Political lean MEDSL · Lake
- 2024 margin
- Lean D (+5.6) · D 52.1% · R 46.5% · Other 1.5%
- 2008→2024 swing
- -28.6pp toward R · 2008: 34.3pp · 2024: 5.6pp
- All cycles
- 2024: D+5.6 2020: D+15.1 2016: D+20.6 2012: D+31.0 2008: D+34.3
Not yet ingested
- Civics
- —
Market trends
- HPI YoY
- ▼ -12.76%
- Current HPI
- 252.6463
- Rent YoY
- ▲ 11.62%
- Metro
- Chicago-Naperville-Elgin, IL-IN-WI
- State GDP YoY
- ▲ 2.90%
- F500 in state
- 18
Industry mix (Fortune 500 HQ in IN)
| Industry | F500 HQs | Revenue |
|---|---|---|
| Industrial Machinery | 2 | $37B |
|
||
| Healthcare | 1 | $177B |
|
||
| Pharmaceuticals | 1 | $45B |
|
||
| Metals / Steel | 1 | $18B |
|
||
| Agriculture | 1 | $17B |
|
||
| Packaging | 1 | $12B |
|
||
Price history
-12.5% since first listed5 events — show timeline
- 2026-05-12 Price Changed $104,900 NIRA MLS as Distributed by MLS Grid
- 2026-04-22 Price Changed $109,900 NIRA MLS as Distributed by MLS Grid
- 2026-04-16 Price Changed $114,900 NIRA MLS as Distributed by MLS Grid
- 2026-04-10 Price Changed $118,900 NIRA MLS as Distributed by MLS Grid
- 2026-04-01 Listed $119,900 NIRA MLS as Distributed by MLS Grid
Property tax history
+43.7%/yrLatest (2024): $1,094 · +3.3% YoY. Source: county tax records.
Cash-flow waterfall
monthlySold comps — $/sqft
last 12 mo · ≤1 miLoading sold comps…