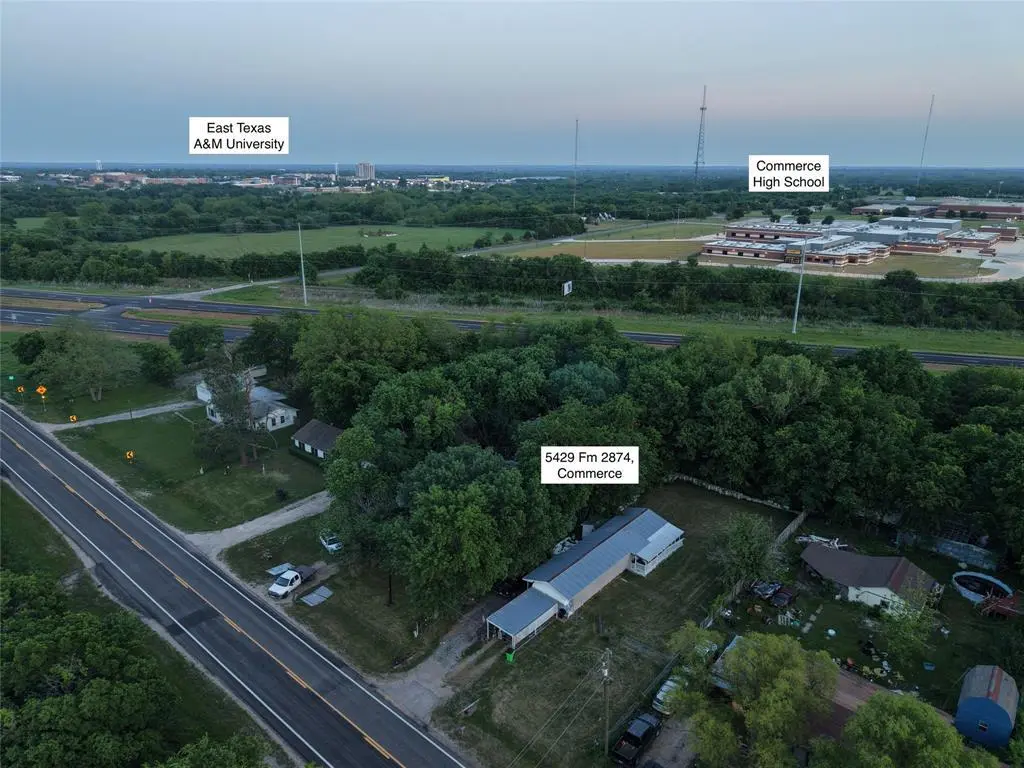
5429 Fm 2874 · Commerce, TX
Flood risk 4/10 · Minor
- FEMA flood zone
- X (unshaded)
- Chance of flooding over 30 yrs
- 0.2%
- Est. flood insurance / yr
- $507 – $1,088
Fire risk 6/10 · Moderate
- Est. fire insurance / yr
- $1,222 – $2,270
Heat risk 7/10 · Major
- Hot days now (above 110°F)
- 7 days/yr
- Hot days in 30 yrs
- 22 days/yr
Wind risk 6/10 · Moderate
- Chance of severe wind over 30 yrs
- 27.0%
Air-quality risk 2/10 · Minimal
- Unhealthy air days now
- 0 days/yr
- Unhealthy air days in 30 yrs
- 1 days/yr
Risk factors via First Street. Map © Google.
Why this score? — see what drove the C- grade
The composite is a weighted blend of 9 inputs, each scored 0–100. Each bar is that input's sub-score; the figure is the points it added to the 100-point composite (weight × sub-score).
- Cash flow +20.3/30.0
- ARV discount +7.5/15.0
- DSCR +6.5/10.0
- 1% rule +5.4/10.0
- Livability +3.2/5.0
- Rent growth +2.5/5.0
- Condition / age +2.5/5.0
- Schools +2.3/10.0
- Appreciation +0.0/10.0
$115,000
🖨 Deal sheet 📄 Offer letter ✓ Due diligence
Listing remarks
Just outside the city limits of Commerce, this well-maintained tenant-occupied single-wide mobile home offers comfort, convenience, and incredible versatility. Move-in ready and only minutes from East Texas A & M University, local shops, restaurants, and everything the city has to offer, this property is ideal for homeowners and investors alike. Featuring 2 bedrooms and 2 bathrooms, the home offers an open-concept layout. Enjoy central heat and air, a one-car carport, a covered front porch, and a large backyard with plenty of room for outdoor entertaining, gardening, or future possibilities. Whether you're looking for a charming personal residence, a strong rental property, or even a sp
Key facts
- Covered front porch
- Central heat and air
- Large backyard
Tags
Property features AI
Finance
- Other: Property type: Residential mobile home; Lot size less than 0.5 acre (approx. 0.33 acre); Subdivision: LINDLEY H C; County: Hunt; Directions provided
- Financial info: Listing accepts Cash, Conventional, and USDA loans; No second mortgage
- HOA & community: No association
Exterior
- Parking: Attached carport; Covered parking (1 space); 1 carport space
- Security: Other security features
- Utilities: Electricity connected; No municipal utility district; No sewer
- Home design: Mobile home (residential); Attached property; Accessible approach with ramp; Metal roof; Built in 1970
- Construction: Metal roof; Preowned
- Exterior features: Covered patio/porch; Back yard with chain link fencing; All-weather road access; No sewer service
Interior
- Kitchen: Electric cooktop
- Bedrooms: Primary bedroom on main level
- Bathrooms: 2 full bathrooms
- Heating & cooling: Central heating; Central air conditioning
- Interior features: Cable TV available; Decorative lighting; Window coverings; One-level layout; Two rooms (living area and dining area)
- Laundry & utility: Laundry area (Other)
Neighborhood map
What this means for you Summary
Snapshot
- This is a 2-bed/2.0-bath manufactured listed at $115k.
Deal economics
- At list price, monthly cash flow is $148 ($2k/yr) — positive.
- The deal already cash-flows at list — no discount required.
- Meets the 1% rule at list price ($1k rent vs $115k).
- Recommended offer: $112k (3.0% below list) — sets the bar for market timing.
- Cap rate 7.8% vs local median 2.1% in Commerce — top-decile yield for the area; either an underpriced asset or a hidden risk that comps aren't pricing in. Stress-test before assuming the spread holds.
Location & tenants
- Location reads 64/100 on livability (#737 in TX) — a middle-class / working-renter tenant base. Strengths: cost of living A+, housing A+, health & safety A-; Watch: crime C-, amenities F, commute F.
- Commerce ISD (rural): math 23% / reading 33% proficiency, ranked #687 of 826 in TX (top 83%) — low school quality limits family demand, transient renter base, plan for 1-2y turnover; 62% free/reduced lunch — lower-income household profile, screen leases tightly.
- Zoned schools: Commerce El (400 students, 78% FRL) — zoned schools average 78% FRL vs 62% district-wide (16 pts higher); higher-poverty schools than district average — tighter screening recommended.
- Market conditions: 207 active listings in the ZIP; 8 comparable units currently listed for rent nearby; rentals at typical pace (median 25d on market — plan ~3-4 weeks tenant-placement turnaround); 1,289 units permitted in Hunt County in 2024 (527 in 5+ unit buildings).
Forward outlook
- Local home prices are declining (-3.0%/yr); year-one equity from $795 of loan paydown is wiped out by about $3k of value loss. Plan a longer hold.
- Hunt County population projected at +15% by 2050 — modest demand growth; plan on rents tracking national, not racing it.
Negotiation context
- It's been on market 55 days — a 3% lower offer ($112k) is reasonable based on typical stale-listing flexibility.
- 3 sale attempts since 2y ago with the ask held roughly flat each time — persistent listings suggest the price (not the market) is what's stuck; bring a comps-based counter.
Risks & watch-outs
- Climate carrying-cost: major wind risk, 27% chance of damaging wind over 30y; major wildfire risk; extreme-heat days projected 7→22/yr by 2055 (HVAC capex compounding) — expect insurance premiums to compound above CPI over the hold.
Questions for the listing agent
- It's been on market 55 days. Have you received any prior offers? Is the seller open to a 3% concession, seller financing, or rate buy-down credit?
- Built in 1970 — when were the roof, HVAC, electrical panel, plumbing, and water heater last replaced?
- Is there a deadline driving the sale (1031 exchange, divorce, estate, relocation)? That informs how much negotiation room exists.
- Schools are F-rated, which usually means shorter tenancies and higher turnover. Who's the typical renter profile here, and what's been the actual vacancy rate?
- What's the average days-on-market for RENTAL listings here right now (not sales)? A rising rental-DOM trend means longer vacancies and softer asking-rent achievability than the comps imply.
- What's the recent tenant-quality profile in this submarket — average credit score on applications, eviction rate, late-payment / NSF rate, and stable-employment percentage? A property-management company in the area should have these aggregated.
- How much new for-sale + rental construction is in the pipeline within 1–3 miles? Heavy new supply typically softens prices + rents 12–24 months out; constrained supply supports both.
Investment metrics
- 1% rule
- 1.04% ✓
- Cap rate
- 7.84%
- Cash-on-cash
- 5.52%
- DSCR
- 1.25
- GRM
- 8.0
CMA / ARV
No comps found within radius.
Projected returns pro-forma
-3.0% appreciation · 3.0% rent growth · sell at horizon
- IRR
- -7.7%
- Equity multiple
- 0.71×
- Total profit
- $-9,185
- Equity at exit
- $17,147
- IRR
- 1.8%
- Equity multiple
- 1.13×
- Total profit
- $4,221
- Equity at exit
- $9,943
Cash invested: $32,200 (down + closing). Projections, not guarantees.
Landlord ↔ Tenant lean methodology
- Overall (STATE)
- 87 Strongly Landlord-Friendly
- State Texas
- 87 Strongly Landlord-Friendly · R+5
- County
- — inherits STATE
- City
- — inherits STATE
ZIP-level market 75428
- Home prices YoY
- -6.5%
- Active inventory
- 207
- Price-to-rent
- 8.0×
Monthly cashflow live
- Estimated rent
- $1,193 high interval (Pro) →
- Mortgage (P&I)
- −$603
- Tax est. 1.5%
- −$144 /mo · $1,725/yr
- Insurance
- −$48
- HOA
- −$0
- Vacancy / Maint / Mgmt
- −$251
- Net cashflow
- $148
Break-even live
UW: 25.0% down · 7.5% · 30yr · 1.5% tax · 5.0% vac · 8.0% maint · 8.0% mgmt
Financing live
Cash to close
- Down payment
- $28,750
- Closing costs
- $3,450
- Reserves months
- —
- Total cash needed
- —
Loan-product check · same deal, 3 products live
Conventional
25% down · 7.5% · 30yr
- Down + closing
- —
- Monthly P&I
- —
- Monthly cashflow
- —
- DSCR
- —
- Eligible?
- —
Personal DTI + credit; lowest rate.
DSCR
20% down · 8.5% · 30yr
- Down + closing
- —
- Monthly P&I
- —
- Monthly cashflow
- —
- DSCR
- —
- Eligible?
- —
No personal income docs; deal must DSCR.
Hard money
10% down · 12.0% · 12mo
- Down + closing
- —
- Monthly P&I
- —
- Monthly cashflow
- —
- DSCR
- —
- Eligible?
- —
Short-term bridge; refi at stabilization.
Rent comps 8 comps
| Address | Beds | Baths | Sqft | Rent | $/sqft | DOM | Units | Dist |
|---|---|---|---|---|---|---|---|---|
| 1814 Hunt St Unit 1805 6 Commerce, TX | 2.0 | 1.5 | 872 | $995 | $1.14 | 24d | 1 | 1.07mi |
| 1814 Hunt St Commerce, TX | 1.0–2.0 | 1.0–2.0 | 715 | $1,050 | $1.47 | 1d | 7 | 1.07mi |
| 1814 Hunt St Unit 1809 Commerce, TX | 2.0 | 1.5 | 872 | $995 | $1.14 | 44d | 1 | 1.07mi |
| 1814 Hunt St Unit 1303 Commerce, TX | 2.0 | 1.0 | 700 | $925 | $1.32 | 44d | 1 | 1.07mi |
| 1618 Bois D'Arc St Unit 102 Commerce, TX | 2.0 | 2.0 | 1000 | $895 | $0.90 | 22d | 1 | 1.17mi |
| 1313 Hunt St Commerce, TX | 3.0 | 2.0 | 1100 | $2,400 | $2.18 | 44d | 1 | 1.43mi |
| 1315 Oneal St Commerce, TX | 3.0 | 2.0 | 1007 | $1,600 | $1.59 | 1d | 1 | 1.46mi |
| 1315 Oneal St Unit B Commerce, TX | 3.0 | 2.0 | 1007 | $1,275 | $1.27 | 2d | 1 | 1.46mi |
Listing history 19 events
-
2026-06-18days on market $115,000 Active 55 DOM
-
2026-06-17days on market $115,000 Active 54 DOM
-
2026-06-16days on market $115,000 Active 53 DOM
-
2026-06-15days on market $115,000 Active 52 DOM
-
2026-06-13days on market $115,000 Active 50 DOM
-
2026-06-13days on market $115,000 Active 49 DOM
-
2026-06-09days on market $115,000 Active 46 DOM
-
2026-06-08days on market $115,000 Active 45 DOM
-
2026-06-07days on market $115,000 Active 44 DOM
-
2026-06-04days on market $115,000 Active 41 DOM
-
2026-06-03days on market $115,000 Active 40 DOM
-
2026-06-02days on market $115,000 Active 39 DOM
-
2026-06-01days on market $115,000 Active 38 DOM
-
2026-05-31days on market $115,000 Active 37 DOM
-
2026-04-24$115,000 Active 1043-char remark
-
2025-07-03historical
-
2025-03-03$150,000 Active
-
2025-02-15historical
-
2024-08-26$150,000 Active
ⓘ Source: listings_history table (triggers on properties + properties_extension) + one-shot
backfill from property_details.listing_events for pre-trigger history.
Climate risk First Street
- Flood 4/10 Moderate FEMA zone X (unshaded) · 20% chance over 30 yrs
- Wildfire 6/10 Major
- Heat 7/10 Severe 7 d/yr ≥110°F today · 22 d/yr by 30 yrs out
- Wind 6/10 Major 27% chance of damaging wind over 30 yrs
- Air quality 2/10 Low 0 unhealthy d/yr today · 1 by 30 yrs out
Nearby sold comps map
Loading sold comps map…
Walkable amenities ~0.75 mi
Loading nearby amenities…
Taxation est. · year 1
- Rental income
- $14,322
- − Mortgage interest
- −$6,442
- − Property taxes
- −$1,725
- − Insurance
- −$575
- − Repairs & maintenance
- −$1,146
- − Management
- −$1,146
- − Depreciation
- −$3,345
- Taxable loss
- −$57
- Est. tax savings @ 24.0%
- +$14
- After-tax cash flow
- $1,791/yr
For passive investors: Depreciation is non-cash, so a rental often shows a tax loss while cash-flowing — sheltering income. Rental losses are passive: they offset passive income freely, and up to $25,000/yr can offset ordinary (W-2) income if you actively participate and your MAGI is under $100k (phasing out to $0 by $150k); unused losses carry forward. On sale, claimed depreciation is recaptured at up to 25%, and gains may owe capital-gains tax (a 1031 exchange can defer both). Figures are a year-1 estimate at your 24.0% rate — not tax advice; consult a CPA.
Schools (NCES district)
- District
- Commerce ISD
- NCES district ID
- 4814820
- Math proficiency
- 23% ▼ -10.00%
- Reading proficiency
- 33% ▬ 0.00%
- Median HH income
- $34,295
- Composite
- 23.01/100
- National rank
- #7977
- State rank
- #687 of 826 in TX
Livability — Commerce
- Score
- 64/100
- State rank
- #737
- US rank
- #13696
Category grades
Schools grade is shown separately in the Schools card above.
Census & demographics
- County
- Hunt County · 71,969 people
- City population
- 11,531
- Metro
- Dallas-Fort Worth-Arlington, TX
- Population (ZIP)
- 11,531
- Household income
- $51,424
- Rent vs Own
- Severe rent burden
- 546.0
Population outlook (Hunt County) Hauer SSP2
- Today (2025)
- 97,090 people
- By 2030
- 100,452 · +3.5%
- By 2040
- 106,544 · +9.7%
- By 2050
- 111,218 · +14.6%
- By 2075
- 121,695 · +25.3%
- By 2100
- 123,683 · +27.4%
Race, ethnicity, and origin ACS 2023
- Neighborhood character
- Diverse neighborhood (Simpson 0.63)
- Race & ethnicity
- White 55% Hispanic / Latino 23% Black 14% Two or more races 9% Asian 2% Native American 1%
- Hispanic origin (detail)
- Mexican 19%
- Common ancestry
- Slovak 2% Romanian 2% Lithuanian 2%
- Foreign-born
- 9% · Canada, China
- Languages at home
- 79% English-only · Spanish 16% Other Indo-European 1% German/W. Germanic 1%
Political lean MEDSL · Hunt
- 2024 margin
- Solid R (+55.5) · D 21.9% · R 77.4%
- 2008→2024 swing
- -14.9pp toward R · 2008: -40.6pp · 2024: -55.5pp
- All cycles
- 2024: R+55.5 2020: R+52.5 2016: R+56.3 2012: R+51.2 2008: R+40.6
Not yet ingested
- Civics
- —
Market trends
- HPI YoY
- ▼ -20.08%
- Current HPI
- 289.0436
- Rent YoY
- —
- Metro
- Dallas-Fort Worth-Arlington, TX
- State GDP YoY
- ▲ 3.95%
- F500 in state
- 110
Industry mix (Fortune 500 HQ in TX)
| Industry | F500 HQs | Revenue |
|---|---|---|
| Energy | 16 | $1,198B |
|
||
| Technology | 5 | $198B |
|
||
| Engineering / Construction | 4 | $72B |
|
||
| Energy Services | 3 | $60B |
|
||
| Utilities | 3 | $41B |
|
||
| Healthcare | 2 | $330B |
|
||
Price history
-23.3% since first listed5 events — show timeline
- 2026-04-24 Listed $115,000 NTREIS
- 2025-07-03 Listing Removed — NTREIS
- 2025-03-03 Listed $150,000 NTREIS
- 2025-02-15 Listing Removed — NTREIS
- 2024-08-26 Listed $150,000 NTREIS
Property tax history
+4.9%/yrLatest (2025): $220 · +1.4% YoY. Source: county tax records.
Cash-flow waterfall
monthlySold comps — $/sqft
last 12 mo · ≤1 miLoading sold comps…