948 Prestonwood Ln · Keene, TX
Flood risk No data
- FEMA flood zone
- —
- Chance of flooding over 30 yrs
- —
- Est. flood insurance / yr
- —
Fire risk No data
- Est. fire insurance / yr
- —
Heat risk No data
- Hot days now (above threshold)
- —
- Hot days in 30 yrs
- —
Wind risk No data
- Chance of severe wind over 30 yrs
- —
Air-quality risk No data
- Unhealthy air days now
- —
- Unhealthy air days in 30 yrs
- —
Risk factors via First Street. Map © Google.
Why this score? — see what drove the D grade
The composite is a weighted blend of 9 inputs, each scored 0–100. Each bar is that input's sub-score; the figure is the points it added to the 100-point composite (weight × sub-score).
- Cash flow +11.8/30.0
- ARV discount +10.8/15.0
- Condition / age +4.0/5.0
- Livability +3.6/5.0
- DSCR +3.5/10.0
- 1% rule +3.4/10.0
- Schools +2.9/10.0
- Rent growth +2.5/5.0
- Appreciation +0.0/10.0
$249,999
🖨 Deal sheet 📄 Offer letter ✓ Due diligence
Listing remarks
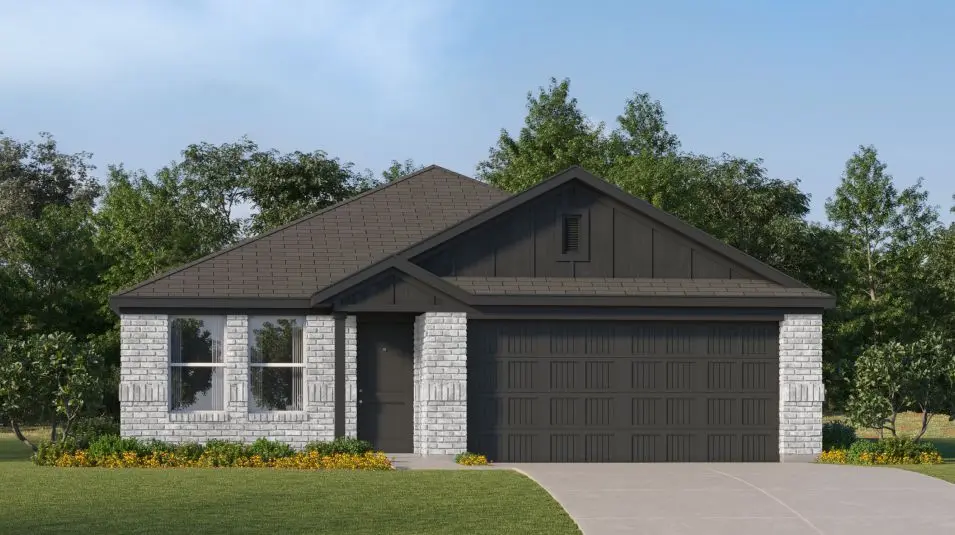
This new single-story design makes smart use of the space available. At the front are all three secondary bedrooms arranged near a convenient full-sized bathroom. Down the foyer is a modern layout connecting a peninsula-style kitchen made for inspired meals, an intimate dining area and a family room ideal for gatherings. Tucked in a quiet corner is the owner's suite with an attached bathroom and walk-in closet.
Key facts
- Intimate dining area
- Walk-in closet
- Single-story design
Tags
Property features AI
Finance
- Other: Address: 948 Prestonwood Ln, Cleburne TX 76031
- Financial info: List price $252,999
Exterior
- Parking: 2 garage spaces (2 total parking spaces)
- Home design: Single-family home (Ramsey plan); Spec new construction
- Exterior features: Living area approximately 1,720
Interior
- Bedrooms: 4 bedrooms
- Bathrooms: 2 full bathrooms
- Interior features: Open living area
Neighborhood map
What this means for you Summary
Snapshot
- This is a 4-bed/2.0-bath single-family listed at $250k. Condition is rated good.
Deal economics
- At list price, monthly cash flow is $-68 ($-812/yr) — negative.
- To cash-flow at today's rent, offer at most $240k (3.9% below list).
- To meet the 1% rule (rent ≥ 1% of price), the offer needs to be $210k (15.9% below list).
- Recommended offer: $210k (15.9% below list) — sets the bar for 1% rule.
- Cap rate 6.0% vs local median 3.2% in Keene — top-decile yield for the area; either an underpriced asset or a hidden risk that comps aren't pricing in. Stress-test before assuming the spread holds.
Location & tenants
- Location reads 72/100 on livability (#249 in TX) — a middle-class / working-renter tenant base. Strengths: crime A+, cost of living A+, housing A+; Watch: schools D+, employment D+, amenities F.
- Cleburne ISD (town): math 34% / reading 33% proficiency, ranked #537 of 826 in TX (top 65%) — families likely to look elsewhere, expect single-tenant / working-renter base with shorter leases.
- Market conditions: 335 active listings in the ZIP; 4 comparable units currently listed for rent nearby; rentals lingering (median 44d on market — plan ~5-8 weeks vacancy on turnover, expect pricing pressure); 50% of comp listings sitting > 30 days — soft ceiling on asking rent; 2,152 units permitted in Johnson County in 2024 (76 in 5+ unit buildings).
Forward outlook
- Local home prices are declining (-3.0%/yr); year-one equity from $2k of loan paydown is wiped out by about $8k of value loss. Plan a longer hold.
- Johnson County population projected at +24% by 2050 — long-run rental-demand tailwind backs the buy-and-hold thesis.
Negotiation context
- It's been on market 20 days — a 2% lower offer ($246k) is reasonable based on typical stale-listing flexibility.
Questions for the listing agent
- What do current leases actually rent for vs. the listed asking? Can we see a recent rent roll and the last 12 months of T-12 income?
- Is there a deadline driving the sale (1031 exchange, divorce, estate, relocation)? That informs how much negotiation room exists.
- Schools are D-rated, which usually means shorter tenancies and higher turnover. Who's the typical renter profile here, and what's been the actual vacancy rate?
- The area grade is low — what's the realistic commute time and amenity access for the typical tenant pool here? Any planned neighborhood developments (good or bad) we should know about?
- What's the average days-on-market for RENTAL listings here right now (not sales)? A rising rental-DOM trend means longer vacancies and softer asking-rent achievability than the comps imply.
- What's the recent tenant-quality profile in this submarket — average credit score on applications, eviction rate, late-payment / NSF rate, and stable-employment percentage? A property-management company in the area should have these aggregated.
- How much new for-sale + rental construction is in the pipeline within 1–3 miles? Heavy new supply typically softens prices + rents 12–24 months out; constrained supply supports both.
Investment metrics
- 1% rule
- 0.84% ✗
- Cap rate
- 5.97%
- Cash-on-cash
- -1.16%
- DSCR
- 0.95
- GRM
- 9.9
CMA / ARV
- ARV (on-the-fly)
- $270,040
- Comps found
- 12
Show comp detail 12 sales within ~0.75 mi
| Address | Dist | Beds/Ba | Sqft | Sold | Price | $/sf | Match |
|---|---|---|---|---|---|---|---|
| 965 Prestonwood Ln | 0.04mi | 4/2.0 | 1,720 (0%) | 3mo | $259,399 | $151 | 95 |
| 961 Prestonwood Ln | 0.03mi | 4/2.0 | 1,760 (+2%) | 3mo | $261,999 | $149 | 92 |
| 989 Prestonwood Ln | 0.07mi | 4/2.0 | 1,720 (0%) | 7mo | $242,499 | $141 | 91 |
| 1945 Autumn Ln | 0.23mi | 4/2.0 | 1,720 (0%) | 3mo | $253,399 | $147 | 87 |
| 1948 Autumn Ln | 0.22mi | 4/2.0 | 1,720 (0%) | 7mo | $243,849 | $142 | 84 |
| 1941 Autumn Ln | 0.23mi | 4/2.0 | 1,760 (+2%) | 4mo | $255,849 | $145 | 82 |
| 988 Prestonwood Ln | 0.05mi | 3/2.0 (-1) | 1,522 (-12%) | 7mo | $244,849 | $161 | 68 |
| 985 Prestonwood Ln | 0.06mi | 3/2.0 (-1) | 1,522 (-12%) | 6mo | $238,599 | $157 | 68 |
| 1002 W 4th St | 0.48mi | 4/2.0 | 1,782 (+4%) | 7mo | $310,000 | $174 | 66 |
| 1949 Autumn Ln | 0.24mi | 3/2.0 (-1) | 1,522 (-12%) | 3mo | $243,499 | $160 | 62 |
| 1937 Autumn Ln | 0.22mi | 3/2.0 (-1) | 1,522 (-12%) | 6mo | $245,849 | $162 | 60 |
| 1204 Honeysuckle Dr | 0.44mi | 3/2.0 (-1) | 1,499 (-13%) | 5mo | $319,900 | $213 | 49 |
Match score weights: distance 35% · size 25% · config 20% · recency 20%. Top-matched comps best support the ARV.
Projected returns pro-forma
-3.0% appreciation · 3.0% rent growth · sell at horizon
- IRR
- -18.2%
- Equity multiple
- 0.36×
- Total profit
- $-44,790
- Equity at exit
- $37,276
- IRR
- -10.4%
- Equity multiple
- 0.37×
- Total profit
- $-44,425
- Equity at exit
- $21,615
Cash invested: $70,000 (down + closing). Projections, not guarantees.
Landlord ↔ Tenant lean methodology
- Overall (STATE)
- 87 Strongly Landlord-Friendly
- State Texas
- 87 Strongly Landlord-Friendly · R+5
- County
- — inherits STATE
- City
- — inherits STATE
ZIP-level market 76031
- Home prices YoY
- -17.6%
- Active inventory
- 335
- Price-to-rent
- 9.9×
Monthly cashflow live
- Estimated rent
- $2,101 medium interval (Pro) →
- Mortgage (P&I)
- −$1,311
- Tax est. 1.5%
- −$312 /mo · $3,750/yr
- Insurance
- −$104
- HOA
- −$0
- Vacancy / Maint / Mgmt
- −$441
- Net cashflow
- $-68
Break-even live
UW: 25.0% down · 7.5% · 30yr · 1.5% tax · 5.0% vac · 8.0% maint · 8.0% mgmt
Financing live
Cash to close
- Down payment
- $62,500
- Closing costs
- $7,500
- Reserves months
- —
- Total cash needed
- —
Loan-product check · same deal, 3 products live
Conventional
25% down · 7.5% · 30yr
- Down + closing
- —
- Monthly P&I
- —
- Monthly cashflow
- —
- DSCR
- —
- Eligible?
- —
Personal DTI + credit; lowest rate.
DSCR
20% down · 8.5% · 30yr
- Down + closing
- —
- Monthly P&I
- —
- Monthly cashflow
- —
- DSCR
- —
- Eligible?
- —
No personal income docs; deal must DSCR.
Hard money
10% down · 12.0% · 12mo
- Down + closing
- —
- Monthly P&I
- —
- Monthly cashflow
- —
- DSCR
- —
- Eligible?
- —
Short-term bridge; refi at stabilization.
Rent comps 4 comps
| Address | Beds | Baths | Sqft | Rent | $/sqft | DOM | Units | Dist |
|---|---|---|---|---|---|---|---|---|
| 961 Prestonwood Ln Cleburne, TX | 4.0 | 2.0 | 1760 | $2,245 | $1.28 | 44d | 1 | 0.02mi |
| 27 Blue Star Dr #27 Keene, TX | 3.0 | 2.0 | 1064 | $925 | $0.87 | 44d | 1 | 0.94mi |
| 204 Woodlawn Dr Keene, TX | 4.0 | 3.0 | 1960 | $1,950 | $0.99 | 1d | 1 | 1.00mi |
| 804 Alaska St Keene, TX | 3.0 | 2.0 | 1204 | $1,288 | $1.07 | 1d | 4 | 1.14mi |
Listing history 14 events
-
2026-06-18days on market $249,999 Active 20 DOM
-
2026-06-17days on market $249,999 Active 19 DOM
-
2026-06-16days on market $249,999 Active 18 DOM
-
2026-06-15days on market $249,999 Active 17 DOM
-
2026-06-13days on market $249,999 Active 15 DOM
-
2026-06-09days on market $249,999 Active 11 DOM
-
2026-06-08days on market $249,999 Active 10 DOM
-
2026-06-08price $249,999 Active 9 DOM
-
2026-06-07days on market $252,999 Active 9 DOM
-
2026-06-04days on market $252,999 Active 6 DOM
-
2026-06-03days on market $252,999 Active 5 DOM
-
2026-06-02days on market $252,999 Active 4 DOM
-
2026-06-01days on market $252,999 Active 3 DOM
-
2026-05-31days on market $252,999 Active 2 DOM
ⓘ Source: listings_history table (triggers on properties + properties_extension) + one-shot
backfill from property_details.listing_events for pre-trigger history.
Nearby sold comps map
Loading sold comps map…
Walkable amenities ~0.75 mi
Loading nearby amenities…
Taxation est. · year 1
- Rental income
- $25,215
- − Mortgage interest
- −$14,004
- − Property taxes
- −$3,750
- − Insurance
- −$1,250
- − Repairs & maintenance
- −$2,017
- − Management
- −$2,017
- − Depreciation
- −$7,273
- Taxable loss
- −$5,096
- Est. tax savings @ 24.0%
- +$1,223
- After-tax cash flow
- $411/yr
For passive investors: Depreciation is non-cash, so a rental often shows a tax loss while cash-flowing — sheltering income. Rental losses are passive: they offset passive income freely, and up to $25,000/yr can offset ordinary (W-2) income if you actively participate and your MAGI is under $100k (phasing out to $0 by $150k); unused losses carry forward. On sale, claimed depreciation is recaptured at up to 25%, and gains may owe capital-gains tax (a 1031 exchange can defer both). Figures are a year-1 estimate at your 24.0% rate — not tax advice; consult a CPA.
Condition & rehab AI · 12 photos
This single-story home is in good condition with a modern design and well-maintained exterior. It offers a good balance of functionality and style, making it an attractive option for both buyers and renters.
Value-add opportunities
- Both Painting the exterior and interior walls — Fresh paint can enhance curb appeal and interior aesthetics.
- Both Landscaping improvements — Enhanced landscaping can increase curb appeal and property value.
- Both Adding smart home features — Smart home features can increase property value and attract tech-savvy buyers/tenants.
- Both Upgrading the kitchen appliances — Modern appliances can make the kitchen more functional and appealing to potential buyers/tenants.
Renovation cost estimate screening
Value-add ROI direction
- Both Painting the exterior and interior walls — Fresh paint can enhance curb appeal and interior aesthetics. ↑
- Both Landscaping improvements — Enhanced landscaping can increase curb appeal and property value. ↑
- Both Adding smart home features — Smart home features can increase property value and attract tech-savvy buyers/tenants. ↑
- Both Upgrading the kitchen appliances — Modern appliances can make the kitchen more functional and appealing to potential buyers/tenants. ↑
ⓘ Cost ranges are severity-bucket heuristics (US national rule-of-thumb). Get contractor quotes + a written scope before underwriting a rehab budget.
Schools (NCES district)
- District
- Cleburne ISD
- NCES district ID
- 4814310
- Math proficiency
- 34% ▼ -2.00%
- Reading proficiency
- 33% ▼ -2.00%
- Median HH income
- $48,788
- Composite
- 29.0/100
- National rank
- #6618
- State rank
- #537 of 826 in TX
Livability — Keene
- Score
- 72/100
- State rank
- #249
- US rank
- #5923
Category grades
Schools grade is shown separately in the Schools card above.
Census & demographics
- Census place
- Keene, TX
- City population
- 29,538
- Population (ZIP)
- 18,697
Population outlook (Johnson County) Hauer SSP2
- Today (2025)
- 179,678 people
- By 2030
- 189,208 · +5.3%
- By 2040
- 207,261 · +15.4%
- By 2050
- 223,064 · +24.1%
- By 2075
- 259,979 · +44.7%
- By 2100
- 275,395 · +53.3%
Race, ethnicity, and origin ACS 2023
- Neighborhood character
- Predominantly White (66%)
- Race & ethnicity
- White 66% Hispanic / Latino 28% Two or more races 12% Black 3%
- Hispanic origin (detail)
- Mexican 23% Puerto Rican 3%
- Common ancestry
- Italian 1% Lithuanian 1% Slovak 1%
- Foreign-born
- 5% · Canada, Vietnam
- Languages at home
- 77% English-only · Spanish 22% Vietnamese 0%
Political lean MEDSL · Johnson
- 2024 margin
- Solid R (+51.4) · D 23.9% · R 75.3%
- 2008→2024 swing
- -3.9pp toward R · 2008: -47.5pp · 2024: -51.4pp
- All cycles
- 2024: R+51.4 2020: R+53.0 2016: R+58.3 2012: R+55.6 2008: R+47.5
Not yet ingested
- Civics
- —
Market trends
- HPI YoY
- ▼ -59.43%
- Current HPI
- 277.598
- Rent YoY
- —
- Metro
- —
- State GDP YoY
- ▲ 3.95%
- F500 in state
- 110
Industry mix (Fortune 500 HQ in TX)
| Industry | F500 HQs | Revenue |
|---|---|---|
| Energy | 16 | $1,198B |
|
||
| Technology | 5 | $198B |
|
||
| Engineering / Construction | 4 | $72B |
|
||
| Energy Services | 3 | $60B |
|
||
| Utilities | 3 | $41B |
|
||
| Healthcare | 2 | $330B |
|
||
Cash-flow waterfall
monthlySold comps — $/sqft
last 12 mo · ≤1 miLoading sold comps…