114- 116 1/2 W Fox St · Rome, NY
Flood risk 1/10 · Minimal
- FEMA flood zone
- X (unshaded)
- Chance of flooding over 30 yrs
- 0.0%
- Est. flood insurance / yr
- $473 – $860
Fire risk 2/10 · Minimal
- Est. fire insurance / yr
- $691 – $1,283
Heat risk 3/10 · Minor
- Hot days now (above 94°F)
- 7 days/yr
- Hot days in 30 yrs
- 17 days/yr
Wind risk 1/10 · Minimal
- Chance of severe wind over 30 yrs
- —
Air-quality risk 2/10 · Minimal
- Unhealthy air days now
- 0 days/yr
- Unhealthy air days in 30 yrs
- 1 days/yr
Risk factors via First Street. Map © Google.
Why this score? — see what drove the B- grade
The composite is a weighted blend of 9 inputs, each scored 0–100. Each bar is that input's sub-score; the figure is the points it added to the 100-point composite (weight × sub-score).
- Cash flow +30.0/30.0
- 1% rule +10.0/10.0
- DSCR +10.0/10.0
- ARV discount +7.5/15.0
- Schools +3.5/10.0
- Livability +3.2/5.0
- Rent growth +2.5/5.0
- Condition / age +1.0/5.0
- Appreciation +0.0/10.0
$65,000
🖨 Deal sheet (PDF) 📄 Offer letter ✓ Due diligence
Listing remarks MLS
Charming Two-Story Home in Rome. This 3 bedroom, 2-baths house offers generous living space with 2,614 sq. ft. spread across two levels. The enclosed porch adds a cozy spot of morning coffee or evening relaxation. Located on a 0.06-acre lot, this low-maintains property is perfect for those looking for space without the hassle or large outdoor upkeep. Close to schools, parks, and all the convenience Rome has to offer. A wonderful opportunity for families.
Key facts
- 2,614 sq ft lot
- Built 1880
- Listed 1079 days
Neighborhood map
What this means for you Summary
Snapshot
- This is a 4-bed/1.0-bath single-family listed at $65k. Condition is rated poor.
Deal economics
- At list price, monthly cash flow is $969 ($12k/yr) — positive.
- The deal already cash-flows at list — no discount required.
- Meets the 1% rule at list price ($2k rent vs $65k).
- Recommended offer: $57k (12.0% below list) — sets the bar for market timing.
- Cap rate 24.2% vs local median 5.7% in Rome — top-decile yield for the area; either an underpriced asset or a hidden risk that comps aren't pricing in. Stress-test before assuming the spread holds.
Location & tenants
- Location reads 64/100 on livability (#722 in NY) — a middle-class / working-renter tenant base. Strengths: cost of living A+, housing A+; Watch: health & safety C-, schools F, amenities F.
- Rome City School District (town): math 35% / reading 46% proficiency, ranked #516 of 590 in NY (top 88%) — families likely to look elsewhere, expect single-tenant / working-renter base with shorter leases.
- Market conditions: 278 active listings in the ZIP; 204 units permitted in Oneida County in 2024 (68 in 5+ unit buildings).
Forward outlook
- Local home prices are declining (-3.0%/yr); year-one equity from $449 of loan paydown is wiped out by about $2k of value loss. Plan a longer hold.
- Oneida County population projected at -12% by 2050 — secular population decline; favor cash flow + early exit over multi-decade hold.
- At projected returns (-3.0% appreciation + 3.0% rent growth), your $18k cash investment doubles in ~2 years — after that, you're playing with house money.
Negotiation context
- It's been on market 1079 days — a 12% lower offer ($57k) is reasonable based on typical stale-listing flexibility.
Risks & watch-outs
- Watch-outs: built in 1880 — expect roof / HVAC / electrical / plumbing capex.
Questions for the listing agent
- It's been on market 1079 days. Have you received any prior offers? Is the seller open to a 12% concession, seller financing, or rate buy-down credit?
- Have any recent inspections been done? Can we get a copy of the seller's disclosures and any deferred-maintenance estimates?
- Built in 1880 — when were the roof, HVAC, electrical panel, plumbing, and water heater last replaced?
- Why hasn't it sold? Are there any deal-killer items the seller is aware of (foundation, flood, title, zoning, code violations)?
- Is there a deadline driving the sale (1031 exchange, divorce, estate, relocation)? That informs how much negotiation room exists.
- Schools are F-rated, which usually means shorter tenancies and higher turnover. Who's the typical renter profile here, and what's been the actual vacancy rate?
- What's the average days-on-market for RENTAL listings here right now (not sales)? A rising rental-DOM trend means longer vacancies and softer asking-rent achievability than the comps imply.
- What's the recent tenant-quality profile in this submarket — average credit score on applications, eviction rate, late-payment / NSF rate, and stable-employment percentage? A property-management company in the area should have these aggregated.
- How much new for-sale + rental construction is in the pipeline within 1–3 miles? Heavy new supply typically softens prices + rents 12–24 months out; constrained supply supports both.
Investment metrics
- 1% rule
- 2.76% ✓
- Cap rate
- 24.18%
- Cash-on-cash
- 63.90%
- DSCR
- 3.84
- GRM
- 3.0
CMA / ARV
- ARV (median comp)
- $153,590
- List price
- $65,000
- Delta
- -57.68%
- Verdict
- UNDERPRICED
- Comps
- 20 within 1.0 mi
Show comp detail 8 sales within ~0.75 mi
| Address | Dist | Beds/Ba | Sqft | Sold | Price | $/sf | Match |
|---|---|---|---|---|---|---|---|
| 105 W Garden St | 0.37mi | 4/2.0 | 2,368 (-9%) | 5mo | $235,000 | $99 | 59 |
| 217 & 219 N Washington St | 0.21mi | 4/1.5 | 2,855 (+9%) | 17mo | $105,000 | $37 | 59 |
| 902 Franklyn St | 0.50mi | 4/1.5 | 2,590 (-1%) | 20mo | $169,000 | $65 | 57 |
| 100 Maple St | 0.50mi | 5/2.5 (+1) | 2,772 (+6%) | 2mo | $282,500 | $102 | 54 |
| 702 N Madison St | 0.43mi | 5/2.5 (+1) | 2,502 (-4%) | 11mo | $212,000 | $85 | 53 |
| 201 Maple St | 0.47mi | 4/3.0 | 2,870 (+10%) | 9mo | $125,000 | $44 | 46 |
| 605 W Liberty St | 0.70mi | 5/2.0 (+1) | 2,445 (-6%) | 7mo | $90,000 | $37 | 42 |
| 115 W Locust St | 0.66mi | 3/2.5 (-1) | 2,728 (+4%) | 22mo | $360,000 | $132 | 32 |
Match score weights: distance 35% · size 25% · config 20% · recency 20%. Top-matched comps best support the ARV.
Projected returns pro-forma
-3.0% appreciation · 3.0% rent growth · sell at horizon
- IRR
- 63.0%
- Equity multiple
- 3.81×
- Total profit
- $51,216
- Equity at exit
- $9,692
- IRR
- 67.5%
- Equity multiple
- 7.82×
- Total profit
- $124,186
- Equity at exit
- $5,620
Cash invested: $18,200 (down + closing). Projections, not guarantees.
Landlord ↔ Tenant lean methodology
- Overall (STATE)
- 15 Strongly Tenant-Friendly
- State New York
- 15 Strongly Tenant-Friendly · D+10
- County
- — inherits STATE
- City
- — inherits STATE
ZIP-level market 13440
- Home prices YoY
- -8.0%
- Active inventory
- 278
- Price-to-rent
- 3.0×
Monthly cashflow live
- Estimated rent
- $1,795 medium interval (Pro) →
- Mortgage (P&I)
- −$341
- Tax est. 1.5%
- −$81 /mo · $975/yr
- Insurance
- −$27
- HOA
- −$0
- Vacancy / Maint / Mgmt
- −$377
- Net cashflow
- $969
Break-even live
Sensitivity live
| Price | -10% $1,014 | -5% $992 | +0% $969 | +5% $947 | +10% $924 |
|---|---|---|---|---|---|
| Rent | -10% $827 | -5% $898 | +0% $969 | +5% $1,040 | +10% $1,111 |
| Rate | -1.0pp $1,002 | -0.5pp $986 | base $969 | +0.5pp $952 | +1.0pp $935 |
UW: 25.0% down · 7.5% · 30yr · 1.5% tax · 5.0% vac · 8.0% maint · 8.0% mgmt
Financing live
Cash to close
- Down payment
- $16,250
- Closing costs
- $1,950
- Reserves months
- —
- Total cash needed
- —
Loan-product check · same deal, 3 products live
Conventional
25% down · 7.5% · 30yr
- Down + closing
- —
- Monthly P&I
- —
- Monthly cashflow
- —
- DSCR
- —
- Eligible?
- —
Personal DTI + credit; lowest rate.
DSCR
20% down · 8.5% · 30yr
- Down + closing
- —
- Monthly P&I
- —
- Monthly cashflow
- —
- DSCR
- —
- Eligible?
- —
No personal income docs; deal must DSCR.
Hard money
10% down · 12.0% · 12mo
- Down + closing
- —
- Monthly P&I
- —
- Monthly cashflow
- —
- DSCR
- —
- Eligible?
- —
Short-term bridge; refi at stabilization.
Listing history 16 events
-
2026-06-21days on market $65,000 Active 1079 DOM
-
2026-06-18days on market $65,000 Active 1077 DOM
-
2026-06-17days on market $65,000 Active 1076 DOM
-
2026-06-16days on market $65,000 Active 1075 DOM
-
2026-06-15days on market $65,000 Active 1074 DOM
-
2026-06-13days on market $65,000 Active 1072 DOM
-
2026-06-12days on market $65,000 Active 1071 DOM
-
2026-06-09days on market $65,000 Active 1068 DOM
-
2026-06-08days on market $65,000 Active 1067 DOM
-
2026-06-07days on market $65,000 Active 1066 DOM
-
2026-06-07days on market $65,000 Active 1065 DOM
-
2026-06-04days on market $65,000 Active 1062 DOM
-
2026-06-02days on market $65,000 Active 1061 DOM
-
2026-06-01days on market $65,000 Active 1060 DOM
-
2026-05-31days on market $65,000 Active 1059 DOM
-
2023-07-07$65,000 Active 460-char remark
Show marketing remark (460 chars)
Charming Two-Story Home in Rome. This 3 bedroom, 2-baths house offers generous living space with 2,614 sq. ft. spread across two levels. The enclosed porch adds a cozy spot of morning coffee or evening relaxation. Located on a 0.06-acre lot, this low-maintains property is perfect for those looking for space without the hassle or large outdoor upkeep. Close to schools, parks, and all the convenience Rome has to offer. A wonderful opportunity for families.
ⓘ Source: listings_history table (triggers on properties + properties_extension) + one-shot
backfill from property_details.listing_events for pre-trigger history.
Climate risk First Street
- Flood 1/10 Low FEMA zone X (unshaded) · 0% chance over 30 yrs
- Wildfire 2/10 Low
- Heat 3/10 Moderate 7 d/yr ≥94°F today · 17 d/yr by 30 yrs out
- Wind 1/10 Low
- Air quality 2/10 Low 0 unhealthy d/yr today · 1 by 30 yrs out
Nearby sold comps map
Loading sold comps map…
Walkable amenities ~0.75 mi
Loading nearby amenities…
Taxation est. · year 1
- Rental income
- $21,544
- − Mortgage interest
- −$3,641
- − Property taxes
- −$975
- − Insurance
- −$325
- − Repairs & maintenance
- −$1,723
- − Management
- −$1,723
- − Depreciation
- −$1,891
- Taxable income
- $11,265
- Est. tax owed @ 24.0%
- −$2,704
- After-tax cash flow
- $8,926/yr
For passive investors: Depreciation is non-cash, so a rental often shows a tax loss while cash-flowing — sheltering income. Rental losses are passive: they offset passive income freely, and up to $25,000/yr can offset ordinary (W-2) income if you actively participate and your MAGI is under $100k (phasing out to $0 by $150k); unused losses carry forward. On sale, claimed depreciation is recaptured at up to 25%, and gains may owe capital-gains tax (a 1031 exchange can defer both). Figures are a year-1 estimate at your 24.0% rate — not tax advice; consult a CPA.
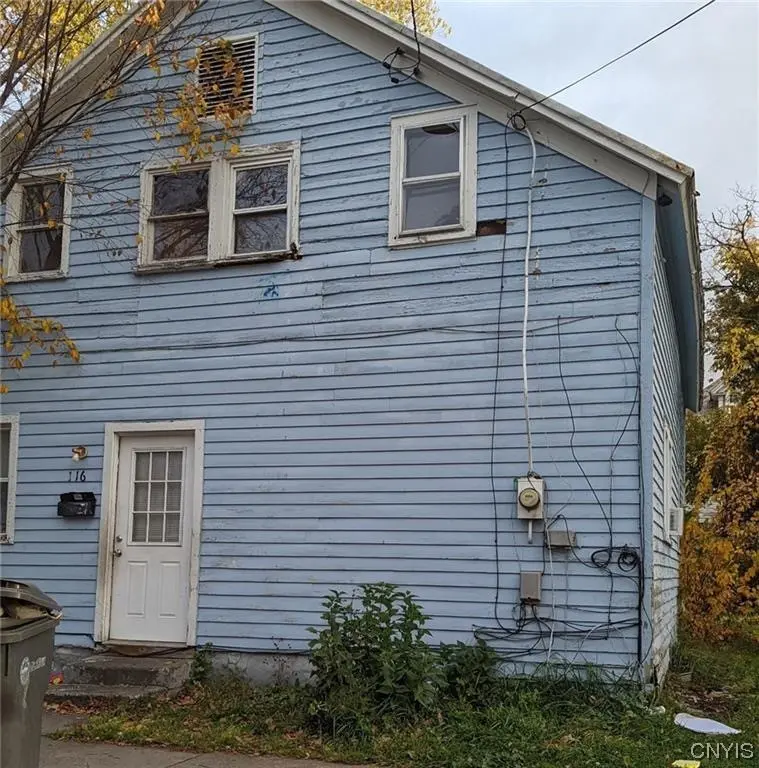
Condition & rehab AI · 1 photo
This two-story home requires extensive repairs and updates to its exterior, interior, HVAC, and landscaping to become move-in ready and increase its value.
Repairs flagged
- Major siding — Severe weathering and peeling
- Major paint — Peeling paint on the exterior
- Major roof — General condition suggests potential issues
- Major HVAC/mechanicals — No visible condition, but overall condition suggests potential issues
- Major landscaping — Overgrown vegetation
Value-add opportunities
- Both repair and paint exterior — Improves curb appeal and overall condition
- Both repair and paint interior — Improves living space and overall condition
- Both replace HVAC/mechanicals — Improves comfort and energy efficiency
- Both landscaping and curb appeal — Improves overall appearance and curb appeal
Renovation cost estimate screening
| Repair item | Severity | Est. cost |
|---|---|---|
| siding · Severe weathering and peeling | Major | $15,000–50,000 |
| paint · Peeling paint on the exterior | Major | $15,000–50,000 |
| roof · General condition suggests potential issues | Major | $15,000–50,000 |
| HVAC/mechanicals · No visible condition, but overall condition suggests potential issues | Major | $15,000–50,000 |
| landscaping · Overgrown vegetation | Major | $15,000–50,000 |
| Total estimated repair cost · 5 items | $75,000–250,000 |
Value-add ROI direction
- Both repair and paint exterior — Improves curb appeal and overall condition ↑
- Both repair and paint interior — Improves living space and overall condition ↑
- Both replace HVAC/mechanicals — Improves comfort and energy efficiency ↑
- Both landscaping and curb appeal — Improves overall appearance and curb appeal ↑
ⓘ Cost ranges are severity-bucket heuristics (US national rule-of-thumb). Get contractor quotes + a written scope before underwriting a rehab budget.
Schools (NCES district)
- District
- Rome City School District
- NCES district ID
- 3624900
- Math proficiency
- 35% ▼ -4.00%
- Reading proficiency
- 46% ▲ 10.00%
- Median HH income
- $46,406
- Composite
- 34.52/100
- National rank
- #5178
- State rank
- #516 of 590 in NY
Livability — Rome
- Score
- 64/100
- State rank
- #722
- US rank
- #13676
Category grades
Schools grade is shown separately in the Schools card above.
Census & demographics
- Census place
- Rome, NY
- City population
- 41,418
- Population (ZIP)
- 41,273
Population outlook (Oneida County) Hauer SSP2
- Today (2025)
- 225,223 people
- By 2030
- 220,384 · -2.1%
- By 2040
- 209,071 · -7.2%
- By 2050
- 197,920 · -12.1%
- By 2075
- 175,541 · -22.1%
- By 2100
- 148,491 · -34.1%
Race, ethnicity, and origin ACS 2023
- Neighborhood character
- Predominantly White (82%)
- Race & ethnicity
- White 82% Hispanic / Latino 7% Two or more races 6% Black 4% Asian 1%
- Hispanic origin (detail)
- Mexican 1% Puerto Rican 4%
- Common ancestry
- Romanian 9% Lithuanian 4% Slovak 1%
- Foreign-born
- 3% · Canada, China
- Languages at home
- 94% English-only · Spanish 3% Other Indo-European 1%
Political lean MEDSL · Oneida
- 2024 margin
- Strong R (+21.3) · D 39.4% · R 60.6%
- 2008→2024 swing
- -15.2pp toward R · 2008: -6.1pp · 2024: -21.3pp
- All cycles
- 2024: R+21.3 2020: R+15.5 2016: R+21.1 2012: R+5.3 2008: R+6.1
Not yet ingested
- Civics
- —
Market trends
- HPI YoY
- ▼ -29.58%
- Current HPI
- 339.3589
- Rent YoY
- —
- Metro
- —
- State GDP YoY
- ▲ 2.60%
- F500 in state
- 92
Industry mix (Fortune 500 HQ in NY)
| Industry | F500 HQs | Revenue |
|---|---|---|
| Financial Services | 10 | $950B |
|
||
| Consumer Goods | 9 | $162B |
|
||
| Insurance | 4 | $225B |
|
||
| Telecommunications | 2 | $144B |
|
||
| Pharmaceuticals | 2 | $112B |
|
||
| Media / Entertainment | 2 | $69B |
|
||
Price history
1 event — show timeline
- 2023-07-07 Listed $65,000 CNYIS
Cash-flow waterfall
monthlySold comps — $/sqft
last 12 mo · ≤1 miLoading sold comps…