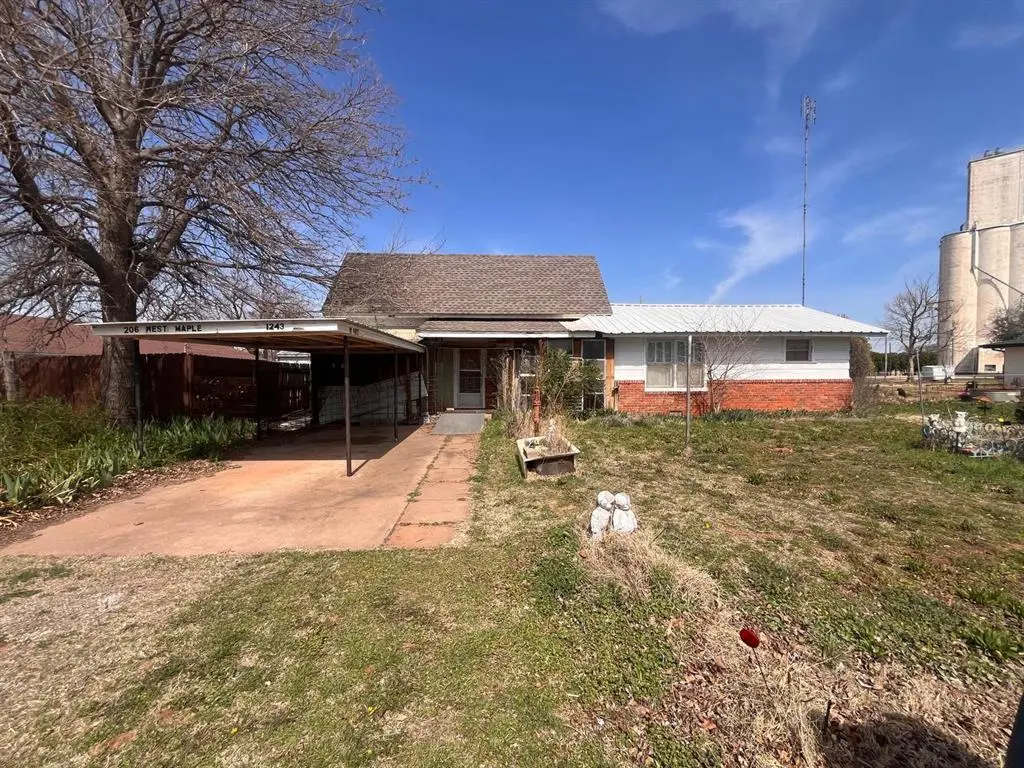
1243 Maple St · Nash, OK
Flood risk 1/10 · Minimal
- FEMA flood zone
- X
- Chance of flooding over 30 yrs
- 0.0%
- Est. flood insurance / yr
- $507 – $1,088
Fire risk 1/10 · Minimal
- Est. fire insurance / yr
- $2,463 – $4,575
Heat risk 6/10 · Moderate
- Hot days now (above 109°F)
- 7 days/yr
- Hot days in 30 yrs
- 18 days/yr
Wind risk 2/10 · Minimal
- Chance of severe wind over 30 yrs
- 2.0%
Air-quality risk 1/10 · Minimal
- Unhealthy air days now
- 0 days/yr
- Unhealthy air days in 30 yrs
- 0 days/yr
Risk factors via First Street. Map © Google.
Why this score? — see what drove the C- grade
The composite is a weighted blend of 9 inputs, each scored 0–100. Each bar is that input's sub-score; the figure is the points it added to the 100-point composite (weight × sub-score).
- Cash flow +15.0/30.0
- Appreciation +7.6/10.0
- ARV discount +7.5/15.0
- 1% rule +5.0/10.0
- DSCR +5.0/10.0
- Livability +3.7/5.0
- Schools +3.5/10.0
- Rent growth +2.5/5.0
- Condition / age +2.5/5.0
$15,000
🖨 Deal sheet (PDF) 📄 Offer letter ✓ Due diligence
Listing remarks
Back on the market through no fault of the seller. AS-IS sale. Property sold in current condition with no repairs, warranties, or representations by the seller. Cash buyers only. 2 bedroom, 1 bath single-family home built in 1930. 1,337 sq ft MOL, composition shingle gable roof, and carport. Located on 10,500 sq ft MOL lot (0.241 acres MOL) in Nash, OK. Please note that utilities to the property are currently turned off. The buyer will be responsible for having all utilities turned on for inspections and any other purposes at the buyer’s sole cost and expense.
Key facts
- 0.24 acre lot
- Built 1930
- Listed 86 days
Property features AI
Finance
- Other: Homestead exempt; Vacant and currently not occupied
- Financial info: Listing offered as-is; cash only; Loan qualification possible; Not assumable
- HOA & community: No mandatory association dues
Exterior
- Parking: Additional parking; Gravel parking; RV parking
- Utilities: Electricity available; Natural gas available; Cable available; High‑speed internet available; Public utilities
- Home design: Single family residence; One level; Property faces south
- Construction: Frame and vinyl siding with other exterior materials; Composition roof; Combination foundation; Built status: existing
- Exterior features: Storage, outbuildings, and workshop; Interior lot
Interior
- Kitchen: Free‑standing electric range/oven
- Bedrooms: 2 bedrooms
- Flooring: Combination of concrete and tile
- Bathrooms: 1 full bathroom
- Heating & cooling: Floor furnace heating; Window air conditioning units
- Interior features: Water heater; Workshop; Outbuildings and storage
- Laundry & utility: No separate laundry listed
Neighborhood map
What this means for you Summary
Snapshot
- This is a 2-bed/1.0-bath single-family listed at $15k.
Deal economics
- At list price, monthly cash flow is $779 ($9k/yr) — positive.
- The deal already cash-flows at list — no discount required.
- Meets the 1% rule at list price ($1k rent vs $15k).
- Recommended offer: $14k (6.0% below list) — sets the bar for market timing.
Location & tenants
- Location reads 73/100 on livability (#16 in OK) — a middle-class / working-renter tenant base. Strengths: crime A+, cost of living A+, housing A+; Watch: amenities F, commute F, health & safety F.
- Timberlake (rural): math 45% / reading 30% proficiency, ranked #130 of 513 in OK (top 25%) — families likely to look elsewhere, expect single-tenant / working-renter base with shorter leases.
- Zoned schools: Timberlake Es (math 37% / reading 27%, grade F, #213 of 845 statewide, top 28%, 208 students, 0% FRL); Timberlake Hs (math 50% / reading 30%, grade F, #25 of 447 statewide, top 8%, 68 students, 0% FRL) — zoned schools average 0% FRL vs 47% district-wide (47 pts lower); this property's tenant base skews higher-income than the district average.
- Market conditions: 7 active listings in the ZIP.
Forward outlook
- In year one you build about $876 of equity ($104 loan paydown + $772 appreciation (5.1% local appreciation)).
- Grant County population projected at +4% by 2050 — modest demand growth; plan on rents tracking national, not racing it.
- At projected returns (5.1% appreciation + 3.0% rent growth), your $4k cash investment doubles in ~1 year — after that, you're playing with house money.
Negotiation context
- It's been on market 87 days — a 6% lower offer ($14k) is reasonable based on typical stale-listing flexibility.
Risks & watch-outs
- Watch-outs: built in 1930 — expect roof / HVAC / electrical / plumbing capex.
- Climate carrying-cost: extreme-heat days projected 7→18/yr by 2055 (HVAC capex compounding) — expect insurance premiums to compound above CPI over the hold.
Questions for the listing agent
- It's been on market 87 days. Have you received any prior offers? Is the seller open to a 6% concession, seller financing, or rate buy-down credit?
- Built in 1930 — when were the roof, HVAC, electrical panel, plumbing, and water heater last replaced?
- Why hasn't it sold? Are there any deal-killer items the seller is aware of (foundation, flood, title, zoning, code violations)?
- Is there a deadline driving the sale (1031 exchange, divorce, estate, relocation)? That informs how much negotiation room exists.
- What's the average days-on-market for RENTAL listings here right now (not sales)? A rising rental-DOM trend means longer vacancies and softer asking-rent achievability than the comps imply.
- What's the recent tenant-quality profile in this submarket — average credit score on applications, eviction rate, late-payment / NSF rate, and stable-employment percentage? A property-management company in the area should have these aggregated.
- How much new for-sale + rental construction is in the pipeline within 1–3 miles? Heavy new supply typically softens prices + rents 12–24 months out; constrained supply supports both.
Investment metrics
- 1% rule
- 7.45% ✓
- Cap rate
- 68.60%
- Cash-on-cash
- 222.52%
- DSCR
- 10.90
- GRM
- 1.1
CMA / ARV
- ARV (on-the-fly)
- $78,883
- Comps found
- 2
Show comp detail 2 sales within ~0.75 mi
| Address | Dist | Beds/Ba | Sqft | Sold | Price | $/sf | Match |
|---|---|---|---|---|---|---|---|
| 1277 Elm St | 0.08mi | 2/1.0 | 1,289 (-4%) | 10mo | $62,500 | $48 | 82 |
| 1224 Elm St | 0.11mi | 3/1.0 (+1) | 1,360 (+2%) | 13mo | $79,900 | $59 | 76 |
Match score weights: distance 35% · size 25% · config 20% · recency 20%. Top-matched comps best support the ARV.
Projected returns pro-forma
5.14% appreciation · 3.0% rent growth · sell at horizon
- IRR
- —
- Equity multiple
- 13.67×
- Total profit
- $53,202
- Equity at exit
- $8,632
- IRR
- —
- Equity multiple
- 29.08×
- Total profit
- $117,922
- Equity at exit
- $15,007
Cash invested: $4,200 (down + closing). Projections, not guarantees.
Landlord ↔ Tenant lean methodology
- Overall (STATE)
- 83 Strongly Landlord-Friendly
- State Oklahoma
- 83 Strongly Landlord-Friendly · R+20
- County
- — inherits STATE
- City
- — inherits STATE
ZIP-level market 73761
- Home prices YoY
- 3.9%
- Active inventory
- 7
- Price-to-rent
- 1.1×
Monthly cashflow live
- Estimated rent
- $1,117 medium interval (Pro) →
- Mortgage (P&I)
- −$79
- Tax est. 1.5%
- −$19 /mo · $225/yr
- Insurance
- −$6
- HOA
- −$0
- Vacancy / Maint / Mgmt
- −$235
- Net cashflow
- $779
Break-even live
Sensitivity live
| Price | -10% $789 | -5% $784 | +0% $779 | +5% $774 | +10% $768 |
|---|---|---|---|---|---|
| Rent | -10% $691 | -5% $735 | +0% $779 | +5% $823 | +10% $867 |
| Rate | -1.0pp $786 | -0.5pp $783 | base $779 | +0.5pp $775 | +1.0pp $771 |
UW: 25.0% down · 7.5% · 30yr · 1.5% tax · 5.0% vac · 8.0% maint · 8.0% mgmt
Financing live
Cash to close
- Down payment
- $3,750
- Closing costs
- $450
- Reserves months
- —
- Total cash needed
- —
Loan-product check · same deal, 3 products live
Conventional
25% down · 7.5% · 30yr
- Down + closing
- —
- Monthly P&I
- —
- Monthly cashflow
- —
- DSCR
- —
- Eligible?
- —
Personal DTI + credit; lowest rate.
DSCR
20% down · 8.5% · 30yr
- Down + closing
- —
- Monthly P&I
- —
- Monthly cashflow
- —
- DSCR
- —
- Eligible?
- —
No personal income docs; deal must DSCR.
Hard money
10% down · 12.0% · 12mo
- Down + closing
- —
- Monthly P&I
- —
- Monthly cashflow
- —
- DSCR
- —
- Eligible?
- —
Short-term bridge; refi at stabilization.
Listing history 23 events
-
2026-06-19days on market $15,000 Active 87 DOM
-
2026-06-18days on market $15,000 Active 86 DOM
-
2026-06-17days on market $15,000 Active 85 DOM
-
2026-06-16days on market $15,000 Active 84 DOM
-
2026-06-15days on market $15,000 Active 83 DOM
-
2026-06-14days on market $15,000 Active 81 DOM
-
2026-06-12days on market $15,000 Active 80 DOM
-
2026-06-09days on market $15,000 Active 77 DOM
-
2026-06-08days on market $15,000 Active 76 DOM
-
2026-06-07pricedays on market $15,000 Active 75 DOM
-
2026-06-03days on market $20,000 Active 71 DOM
-
2026-06-02days on market $20,000 Active 70 DOM
-
2026-06-01days on market $20,000 Active 69 DOM
-
2026-05-31days on market $20,000 Active 68 DOM
-
2026-05-30days on market $20,000 Active 67 DOM
-
2026-05-22status Pending
-
2026-05-09price $23,000
-
2026-04-23price $30,000
-
2026-04-09price $35,000
-
2026-04-07price $40,000
-
2026-03-25price $49,000
-
2026-03-18price $55,000
-
2026-03-18$40,000 Active
ⓘ Source: listings_history table (triggers on properties + properties_extension) + one-shot
backfill from property_details.listing_events for pre-trigger history.
Climate risk First Street
- Flood 1/10 Low FEMA zone X · 0% chance over 30 yrs
- Wildfire 1/10 Low
- Heat 6/10 Major 7 d/yr ≥109°F today · 18 d/yr by 30 yrs out
- Wind 2/10 Low 2% chance of damaging wind over 30 yrs
- Air quality 1/10 Low 0 unhealthy d/yr today · 0 by 30 yrs out
Nearby sold comps map
Loading sold comps map…
Walkable amenities ~0.75 mi
Loading nearby amenities…
Taxation est. · year 1
- Rental income
- $13,405
- − Mortgage interest
- −$840
- − Property taxes
- −$225
- − Insurance
- −$75
- − Repairs & maintenance
- −$1,072
- − Management
- −$1,072
- − Depreciation
- −$436
- Taxable income
- $9,684
- Est. tax owed @ 24.0%
- −$2,324
- After-tax cash flow
- $7,022/yr
For passive investors: Depreciation is non-cash, so a rental often shows a tax loss while cash-flowing — sheltering income. Rental losses are passive: they offset passive income freely, and up to $25,000/yr can offset ordinary (W-2) income if you actively participate and your MAGI is under $100k (phasing out to $0 by $150k); unused losses carry forward. On sale, claimed depreciation is recaptured at up to 25%, and gains may owe capital-gains tax (a 1031 exchange can defer both). Figures are a year-1 estimate at your 24.0% rate — not tax advice; consult a CPA.
Schools (NCES district)
- District
- Timberlake
- NCES district ID
- 4000013
- Math proficiency
- 45% ▬ 0.00%
- Reading proficiency
- 30% ▼ -10.00%
- Median HH income
- $46,887
- Composite
- 34.68/100
- National rank
- #10064
- State rank
- #130 of 513 in OK
Livability — Nash
- Score
- 73/100
- State rank
- #16
- US rank
- #5070
Category grades
Schools grade is shown separately in the Schools card above.
Census & demographics
- Census place
- Nash, OK
- Population (ZIP)
- 302
Population outlook (Grant County) Hauer SSP2
- Today (2025)
- 4,375 people
- By 2030
- 4,328 · -1.1%
- By 2040
- 4,348 · -0.6%
- By 2050
- 4,536 · +3.7%
- By 2075
- 5,336 · +22.0%
- By 2100
- 5,501 · +25.7%
Race, ethnicity, and origin ACS 2023
- Neighborhood character
- Predominantly White (90%)
- Race & ethnicity
- White 90% Two or more races 4% Native American 4% Hispanic / Latino 2%
- Common ancestry
- Iranian 1% European 1%
- Foreign-born
- 1% · Canada
- Languages at home
- 98% English-only · Spanish 1% German/W. Germanic 1%
Political lean MEDSL · Grant
- 2024 margin
- Solid R (+70.5) · D 13.9% · R 84.4% · Other 1.7%
- 2008→2024 swing
- -14.3pp toward R · 2008: -56.3pp · 2024: -70.5pp
- All cycles
- 2024: R+70.5 2020: R+73.5 2016: R+70.0 2012: R+62.0 2008: R+56.3
Not yet ingested
- Civics
- —
Market trends
- HPI YoY
- ▲ 5.14%
- Current HPI
- 135.633
- Rent YoY
- —
- Metro
- —
- State GDP YoY
- ▲ 1.55%
- F500 in state
- 6
Industry mix (Fortune 500 HQ in OK)
| Industry | F500 HQs | Revenue |
|---|---|---|
| Energy | 3 | $48B |
|
||
Price history
-42.5% since first listed8 events — show timeline
- 2026-05-22 Pending — MLSOK
- 2026-05-09 Price Changed $23,000 MLSOK
- 2026-04-23 Price Changed $30,000 MLSOK
- 2026-04-09 Price Changed $35,000 MLSOK
- 2026-04-07 Price Changed $40,000 MLSOK
- 2026-03-25 Price Changed $49,000 MLSOK
- 2026-03-18 Price Changed $55,000 MLSOK
- 2026-03-18 Listed $40,000 MLSOK
Property tax history
-21.8%/yrLatest (2025): $1 · -99.3% YoY. Source: county tax records.
Cash-flow waterfall
monthlySold comps — $/sqft
last 12 mo · ≤1 miLoading sold comps…