 Multi-family
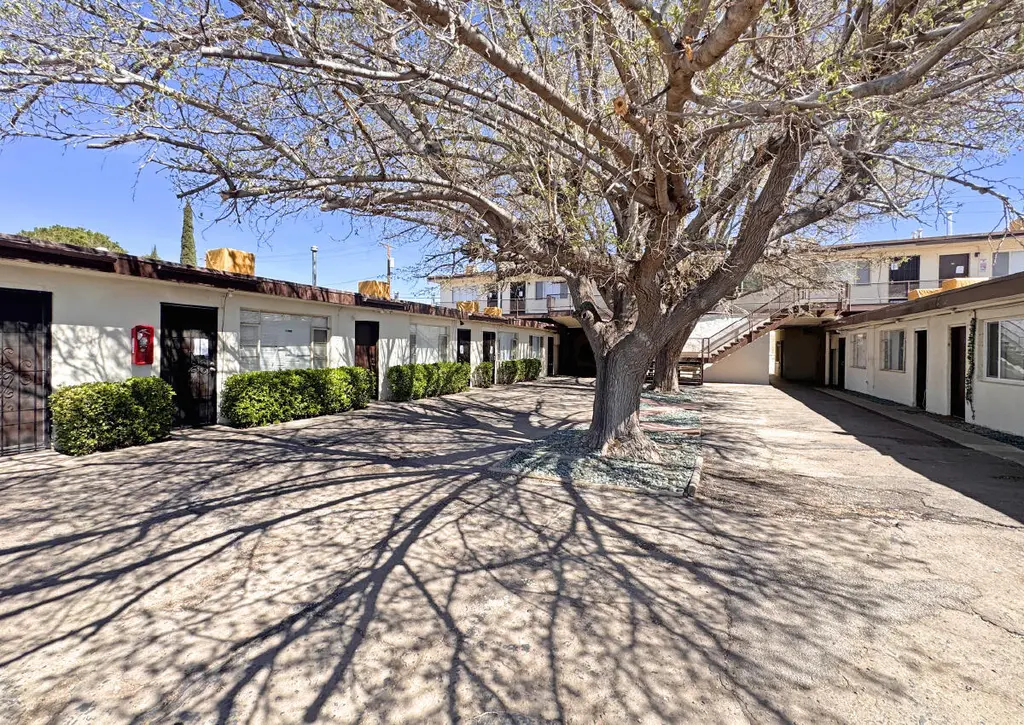
1024 Alvarado Dr SE Apt 6 · Albuquerque, NM
Flood risk 1/10 · Minimal
- FEMA flood zone
- X (unshaded)
- Chance of flooding over 30 yrs
- 0.0%
- Est. flood insurance / yr
- $507 – $1,088
Fire risk 3/10 · Minor
- Est. fire insurance / yr
- $706 – $1,312
Heat risk 4/10 · Minor
- Hot days now (above 94°F)
- 7 days/yr
- Hot days in 30 yrs
- 18 days/yr
Wind risk 1/10 · Minimal
- Chance of severe wind over 30 yrs
- —
Air-quality risk 2/10 · Minimal
- Unhealthy air days now
- 1 days/yr
- Unhealthy air days in 30 yrs
- 3 days/yr
Risk factors via First Street. Map © Google.
Why this score? — see what drove the B grade
The composite is a weighted blend of 9 inputs, each scored 0–100. Each bar is that input's sub-score; the figure is the points it added to the 100-point composite (weight × sub-score).
- Cash flow +30.0/30.0
- 1% rule +10.0/10.0
- DSCR +10.0/10.0
- ARV discount +7.5/15.0
- Schools +5.3/10.0
- Condition / age +3.8/5.0
- Livability +3.6/5.0
- Rent growth +3.1/5.0
- Appreciation +0.0/10.0
$1,660,470
🖨 Deal sheet (PDF) 📄 Offer letter ✓ Due diligence
Multi-family units
County records classify this as Multi-Family (5+ Unit). Listing-text estimate: 1 unit. estimate disagrees with records
5+ unit building — per-unit beds/baths from public records are typically unavailable; the breakdown below (if shown) is an estimate from the listing text.
Listing remarks
* Property is being sold as a package with 1008 Alvarado Dr. SE * Offered at $3,400,000 ($79,070/unit), this 43-unit multifamily investment presents a compelling value-add opportunity with a 5.89% acquisition cap rate and a projected 6.42% pro forma cap rate. The property was 100% occupied as of March 2026 and features in-place rents estimated to be approximately 14% below market, providing meaningful revenue upside. Recent interior renovations have been completed throughout the majority of units, reducing near-term capital needs. Located within Albuquerque's established Southeast submarket, the property benefits from proximity to Kirtland Air Force Base, major employment centers, and conv
Key facts
- 0.31 acre lot
- Built 1955
- Listed 25 days
Property features AI
Finance
- Financial info: Total actual rent: $14,629 monthly; Unit rents range around $667–$761 (examples: $725, $761, $667); Owner pays water, sewer, and trash collection; tenants pay electricity and gas
Exterior
- Utilities: Electricity connected; Natural gas connected; Water connected; Sewer connected
- Home design: Two-story building; Resale condition
- Construction: Single building (1); 21 units total
- Exterior features: 0.31-acre lot; Zoned R-MH*
Interior
- Kitchen: Dishwasher; Free-standing gas range; Refrigerator
- Bedrooms: Multiple 1-bedroom units (21 total units)
- Flooring: Vinyl
- Bathrooms: Each unit includes 1 bathroom
- Heating & cooling: Wall furnace heating; Evaporative cooling
- Interior features: Vinyl flooring
- Laundry & utility: On-site laundry facilities
Neighborhood map
What this means for you Summary
Snapshot
- This is a 3-bed/3.0-bath multifamily listed at $1.66M. Condition is rated good.
Deal economics
- At list price, monthly cash flow is $26k ($317k/yr) — positive.
- The deal already cash-flows at list — no discount required.
- Meets the 1% rule at list price ($48k rent vs $1.66M).
- Recommended offer: $1.64M (1.5% below list) — sets the bar for market timing.
- Cap rate 25.4% vs local median 3.7% in Albuquerque — top-decile yield for the area; either an underpriced asset or a hidden risk that comps aren't pricing in. Stress-test before assuming the spread holds.
Location & tenants
- Location reads 72/100 on livability (#13 in NM) — a middle-class / working-renter tenant base. Strengths: amenities A+, commute A+, cost of living A+; Watch: schools D-, crime F.
- Albuquerque Public Schools (urban): math 51% / reading 75% proficiency, ranked #3 of 29 in NM (top 10%) — acceptable for families but not a draw, mixed tenant base, ~2y average lease; 60% free/reduced lunch — lower-income household profile, screen leases tightly.
- Market conditions: Rents rising (+2.5%/yr); 164 active listings in the ZIP; lower-income renter base — watch delinquency; 1,316 units permitted in Bernalillo County in 2024 (546 in 5+ unit buildings).
- At $47,986/mo this rent would consume 1348% of the median local household income ($43k/yr) (locally 3480% of renters already pay >50% of income on rent) — very limited rent-growth headroom before tenants either downsize or default.
Forward outlook
- Local home prices are declining (-3.0%/yr); year-one equity from $11k of loan paydown is wiped out by about $50k of value loss. Plan a longer hold.
- At projected returns (-3.0% appreciation + 2.5% rent growth), your $465k cash investment doubles in ~2 years — after that, you're playing with house money.
Negotiation context
- It's been on market 25 days — a 2% lower offer ($1.64M) is reasonable based on typical stale-listing flexibility.
Risks & watch-outs
- Watch-outs: built in 1955 — expect roof / HVAC / electrical / plumbing capex.
Questions for the listing agent
- Built in 1955 — when were the roof, HVAC, electrical panel, plumbing, and water heater last replaced?
- Is there a deadline driving the sale (1031 exchange, divorce, estate, relocation)? That informs how much negotiation room exists.
- Schools are D-rated, which usually means shorter tenancies and higher turnover. Who's the typical renter profile here, and what's been the actual vacancy rate?
- Crime grade is F in this area — have there been break-ins, vandalism, or insurance claims at this property in the last 3 years? What carrier currently insures it and at what premium?
- What's the average days-on-market for RENTAL listings here right now (not sales)? A rising rental-DOM trend means longer vacancies and softer asking-rent achievability than the comps imply.
- What's the recent tenant-quality profile in this submarket — average credit score on applications, eviction rate, late-payment / NSF rate, and stable-employment percentage? A property-management company in the area should have these aggregated.
- How much new apartment / multifamily construction is in the pipeline within 1–3 miles? Heavy new supply (>2% of stock underway) typically softens rents 12–24 months out; light construction supports rent growth.
Investment metrics
- 1% rule
- 2.89% ✓
- Cap rate
- 25.40%
- Cash-on-cash
- 68.23%
- DSCR
- 4.04
- GRM
- 2.9
CMA / ARV
No comps found within radius.
Projected returns pro-forma
-3.0% appreciation · 2.54% rent growth · sell at horizon
- IRR
- 67.1%
- Equity multiple
- 4.00×
- Total profit
- $1,393,130
- Equity at exit
- $247,581
- IRR
- 71.2%
- Equity multiple
- 8.09×
- Total profit
- $3,294,052
- Equity at exit
- $143,567
Cash invested: $464,932 (down + closing). Projections, not guarantees.
Landlord ↔ Tenant lean methodology
- Overall (STATE)
- 55 Moderately Landlord-Leaning
- State New Mexico
- 55 Moderately Landlord-Leaning · D+3
- County
- — inherits STATE
- City
- — inherits STATE
ZIP-level market 87108
- Rents YoY
- 2.5%
- Active inventory
- 164
- Price-to-rent
- 124.0×
Monthly cashflow live
- Estimated rent
- $47,986 high interval (Pro) →
- Mortgage (P&I)
- −$8,708
- Tax est. 1.5%
- −$2,076 /mo · $24,907/yr
- Insurance
- −$692
- HOA
- −$0
- Vacancy / Maint / Mgmt
- −$10,077
- Net cashflow
- $26,434
Break-even live
Sensitivity live
| Price | -10% $27,581 | -5% $27,008 | +0% $26,434 | +5% $25,860 | +10% $25,286 |
|---|---|---|---|---|---|
| Rent | -10% $22,643 | -5% $24,538 | +0% $26,434 | +5% $28,329 | +10% $30,225 |
| Rate | -1.0pp $27,270 | -0.5pp $26,856 | base $26,434 | +0.5pp $26,004 | +1.0pp $25,566 |
43-unit breakdown (identical units grouped — click to expand)
| Units | Beds | Baths | Est. rent |
|---|---|---|---|
| 43× units | 3 | 3 | $47,988 |
| #1 | 3 | 3 | $1,116 |
| #2 | 3 | 3 | $1,116 |
| #3 | 3 | 3 | $1,116 |
| #4 | 3 | 3 | $1,116 |
| #5 | 3 | 3 | $1,116 |
| #6 | 3 | 3 | $1,116 |
| #7 | 3 | 3 | $1,116 |
| #8 | 3 | 3 | $1,116 |
| #9 | 3 | 3 | $1,116 |
| #10 | 3 | 3 | $1,116 |
| #11 | 3 | 3 | $1,116 |
| #12 | 3 | 3 | $1,116 |
| #13 | 3 | 3 | $1,116 |
| #14 | 3 | 3 | $1,116 |
| #15 | 3 | 3 | $1,116 |
| #16 | 3 | 3 | $1,116 |
| #17 | 3 | 3 | $1,116 |
| #18 | 3 | 3 | $1,116 |
| #19 | 3 | 3 | $1,116 |
| #20 | 3 | 3 | $1,116 |
| #21 | 3 | 3 | $1,116 |
| #22 | 3 | 3 | $1,116 |
| #23 | 3 | 3 | $1,116 |
| #24 | 3 | 3 | $1,116 |
| #25 | 3 | 3 | $1,116 |
| #26 | 3 | 3 | $1,116 |
| #27 | 3 | 3 | $1,116 |
| #28 | 3 | 3 | $1,116 |
| #29 | 3 | 3 | $1,116 |
| #30 | 3 | 3 | $1,116 |
| #31 | 3 | 3 | $1,116 |
| #32 | 3 | 3 | $1,116 |
| #33 | 3 | 3 | $1,116 |
| #34 | 3 | 3 | $1,116 |
| #35 | 3 | 3 | $1,116 |
| #36 | 3 | 3 | $1,116 |
| #37 | 3 | 3 | $1,116 |
| #38 | 3 | 3 | $1,116 |
| #39 | 3 | 3 | $1,116 |
| #40 | 3 | 3 | $1,116 |
| #41 | 3 | 3 | $1,116 |
| #42 | 3 | 3 | $1,116 |
| #43 | 3 | 3 | $1,116 |
| Total (43 units) | $47,986 | ||
UW: 25.0% down · 7.5% · 30yr · 1.5% tax · 5.0% vac · 8.0% maint · 8.0% mgmt
Financing live
Cash to close
- Down payment
- $415,118
- Closing costs
- $49,814
- Reserves months
- —
- Total cash needed
- —
Loan-product check · same deal, 3 products live
Conventional
25% down · 7.5% · 30yr
- Down + closing
- —
- Monthly P&I
- —
- Monthly cashflow
- —
- DSCR
- —
- Eligible?
- —
Personal DTI + credit; lowest rate.
DSCR
20% down · 8.5% · 30yr
- Down + closing
- —
- Monthly P&I
- —
- Monthly cashflow
- —
- DSCR
- —
- Eligible?
- —
No personal income docs; deal must DSCR.
Hard money
10% down · 12.0% · 12mo
- Down + closing
- —
- Monthly P&I
- —
- Monthly cashflow
- —
- DSCR
- —
- Eligible?
- —
Short-term bridge; refi at stabilization.
Listing history 15 events
-
2026-06-18days on market $1,660,470 Active 25 DOM
-
2026-06-17days on market $1,660,470 Active 24 DOM
-
2026-06-16days on market $1,660,470 Active 23 DOM
-
2026-06-15days on market $1,660,470 Active 22 DOM
-
2026-06-13statusdays on market $1,660,470 Active 20 DOM
-
2026-06-10status $1,660,470 Pending 19 DOM
-
2026-06-09days on market $1,660,470 Active 19 DOM
-
2026-06-08days on market $1,660,470 Active 18 DOM
-
2026-06-07days on market $1,660,470 Active 17 DOM
-
2026-06-05days on market $1,660,470 Active 14 DOM
-
2026-06-03days on market $1,660,470 Active 13 DOM
-
2026-06-02days on market $1,660,470 Active 12 DOM
-
2026-06-01days on market $1,660,470 Active 11 DOM
-
2026-05-31days on market $1,660,470 Active 10 DOM
-
2026-03-09$1,660,470 Active
ⓘ Source: listings_history table (triggers on properties + properties_extension) + one-shot
backfill from property_details.listing_events for pre-trigger history.
Climate risk First Street
- Flood 1/10 Low FEMA zone X (unshaded) · 0% chance over 30 yrs
- Wildfire 3/10 Moderate
- Heat 4/10 Moderate 7 d/yr ≥94°F today · 18 d/yr by 30 yrs out
- Wind 1/10 Low
- Air quality 2/10 Low 1 unhealthy d/yr today · 3 by 30 yrs out
Nearby sold comps map
Loading sold comps map…
Walkable amenities ~0.75 mi
Loading nearby amenities…
Taxation est. · year 1
- Rental income
- $575,832
- − Mortgage interest
- −$93,012
- − Property taxes
- −$24,907
- − Insurance
- −$8,302
- − Repairs & maintenance
- −$46,067
- − Management
- −$46,067
- − Depreciation
- −$48,305
- Taxable income
- $309,173
- Est. tax owed @ 24.0%
- −$74,201
- After-tax cash flow
- $243,004/yr
For passive investors: Depreciation is non-cash, so a rental often shows a tax loss while cash-flowing — sheltering income. Rental losses are passive: they offset passive income freely, and up to $25,000/yr can offset ordinary (W-2) income if you actively participate and your MAGI is under $100k (phasing out to $0 by $150k); unused losses carry forward. On sale, claimed depreciation is recaptured at up to 25%, and gains may owe capital-gains tax (a 1031 exchange can defer both). Figures are a year-1 estimate at your 24.0% rate — not tax advice; consult a CPA.
Condition & rehab AI · 7 photos
This multifamily property is in good condition with recent cosmetic renovations, offering a compelling value-add opportunity in a desirable location.
Value-add opportunities
- Both Paint exterior siding — Enhances curb appeal and value
- Both Replace window screens — Improves energy efficiency and aesthetics
- Both Upgrade HVAC units — Enhances comfort and energy efficiency
Renovation cost estimate screening
Value-add ROI direction
- Both Paint exterior siding — Enhances curb appeal and value ↑
- Both Replace window screens — Improves energy efficiency and aesthetics ↑
- Both Upgrade HVAC units — Enhances comfort and energy efficiency ↑
ⓘ Cost ranges are severity-bucket heuristics (US national rule-of-thumb). Get contractor quotes + a written scope before underwriting a rehab budget.
Schools (NCES district)
- District
- Albuquerque Public Schools
- NCES district ID
- 3500060
- Math proficiency
- 51% ▲ 30.00%
- Reading proficiency
- 75% ▲ 45.00%
- Median HH income
- $48,151
- Composite
- 53.29/100
- National rank
- #1487
- State rank
- #3 of 29 in NM
Livability — Albuquerque
- Score
- 72/100
- State rank
- #13
- US rank
- #6219
Category grades
Schools grade is shown separately in the Schools card above.
Census & demographics
- Census place
- Albuquerque, NM
- County
- Bernalillo County · 647,165 people
- City population
- 647,165
- Metro
- Albuquerque, NM
- Population (ZIP)
- 36,331
- Household income
- $42,724
- Rent vs Own
- Severe rent burden
- 3480.0
Population outlook (Bernalillo County) Hauer SSP2
- Today (2025)
- 704,528 people
- By 2030
- 711,723 · +1.0%
- By 2040
- 714,522 · +1.4%
- By 2050
- 709,274 · +0.7%
- By 2075
- 680,015 · -3.5%
- By 2100
- 619,879 · -12.0%
Race, ethnicity, and origin ACS 2023
- Neighborhood character
- Diverse neighborhood (Simpson 0.64)
- Race & ethnicity
- Hispanic / Latino 49% White 34% Two or more races 21% Native American 6% Black 5% Asian 3%
- Hispanic origin (detail)
- Mexican 31% Cuban 3%
- Common ancestry
- Lithuanian 2% Slovak 1% Romanian 1%
- Foreign-born
- 18% · Canada, Vietnam
- Languages at home
- 67% English-only · Spanish 26% Other Indo-European 2% Tagalog/Filipino 1%
Political lean MEDSL · Bernalillo
- 2024 margin
- Strong D (+21.0) · D 59.2% · R 38.2% · Other 2.6%
- 2008→2024 swing
- -0.3pp no change · 2008: 21.4pp · 2024: 21.0pp
- All cycles
- 2024: D+21.0 2020: D+24.4 2016: D+17.8 2012: D+16.2 2008: D+21.4
Not yet ingested
- Civics
- —
Market trends
- HPI YoY
- ▼ -228.14%
- Current HPI
- 238.53
- Rent YoY
- ▲ 2.54%
- Metro
- Albuquerque, NM
- State GDP YoY
- —
- F500 in state
- 0
Price history
1 event — show timeline
- 2026-03-09 Listed $1,660,470 Southwest MLS
Cash-flow waterfall
monthlySold comps — $/sqft
last 12 mo · ≤1 miLoading sold comps…