 🏗️ New Construction
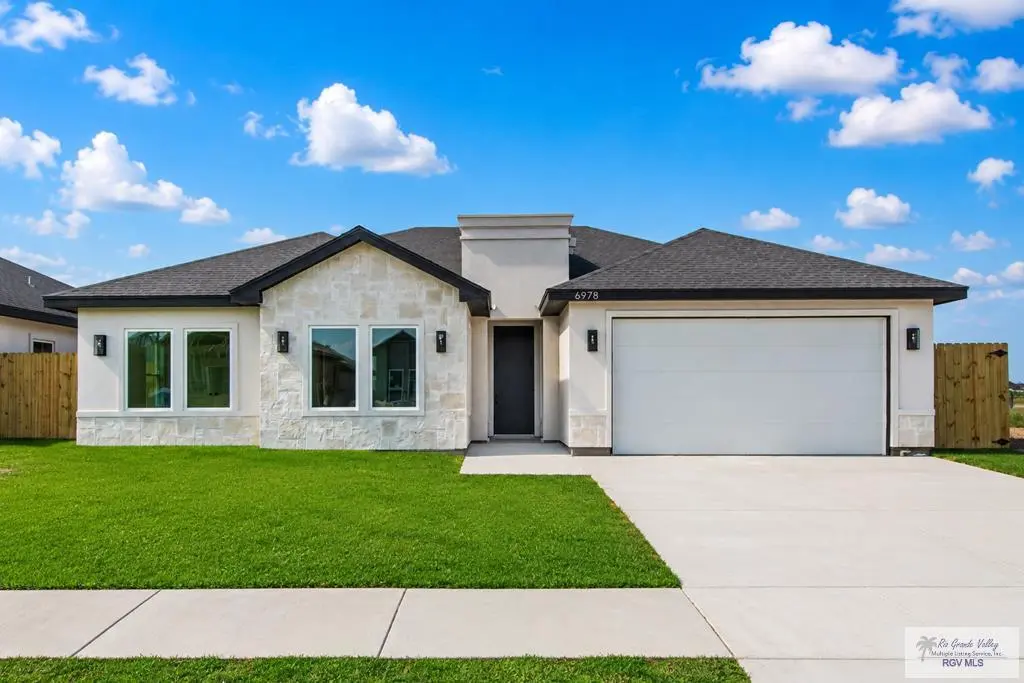
6978 Lake Almanor · Brownsville, TX
Flood risk No data
- FEMA flood zone
- —
- Chance of flooding over 30 yrs
- —
- Est. flood insurance / yr
- —
Fire risk No data
- Est. fire insurance / yr
- —
Heat risk No data
- Hot days now (above threshold)
- —
- Hot days in 30 yrs
- —
Wind risk No data
- Chance of severe wind over 30 yrs
- —
Air-quality risk No data
- Unhealthy air days now
- —
- Unhealthy air days in 30 yrs
- —
Risk factors via First Street. Map © Google.
Why this score? — see what drove the D+ grade
The composite is a weighted blend of 9 inputs, each scored 0–100. Each bar is that input's sub-score; the figure is the points it added to the 100-point composite (weight × sub-score).
- Cash flow +14.7/30.0
- ARV discount +7.5/15.0
- DSCR +4.5/10.0
- Condition / age +4.2/5.0
- 1% rule +4.1/10.0
- Livability +4.0/5.0
- Schools +3.3/10.0
- Rent growth +2.5/5.0
- Appreciation +2.3/10.0
$332,500
🖨 Deal sheet (PDF) 📄 Offer letter ✓ Due diligence
Listing remarks
Beautiful newly built home located in the fast-growing Summer Lakes subdivision in Olmito, TX, surrounded by modern newer construction and excellent access to the north side of town. This 4-bedroom, 3.5-bath residence features a contemporary design with high-end finishes throughout, including wood-look porcelain tile flooring, quartz countertops in the kitchen and bathrooms, stylish LED lighting, and spray foam insulation for outstanding energy efficiency, even in the garage area. The home also offers double pane windows, a fully fenced backyard, and newly installed landscaping with fresh grass in both the front and backyard. Conveniently positioned near Expressway 77/83 with easy access to
Key facts
- Newly built home
- Quartz countertops
- Led lighting
Tags
Property features AI
Exterior
- Parking: Attached 2-car garage
- Security: Smoke detectors
- Utilities: Public water service; Public sewer service
- Home design: Single-family residence; House; One story; New construction; Home warranty included
- Construction: Stucco construction; Slab foundation
- Exterior features: Public water; Public sewer; Composition roof
Interior
- Flooring: Tile flooring
- Bathrooms: Three full bathrooms; One half bathroom
- Heating & cooling: Central heating (electric); Central air conditioning; Ceiling fans
- Interior features: Smoke detectors; Electric water heater
Neighborhood map
What this means for you Summary
Snapshot
- This is a 4-bed/3.5-bath single-family listed at $332k. Condition is rated good.
Deal economics
- At list price, monthly cash flow is $77 ($929/yr) — positive.
- To cash-flow at today's rent, offer at most $312k (6.0% below list).
- To meet the 1% rule (rent ≥ 1% of price), the offer needs to be $273k (17.8% below list).
- Recommended offer: $273k (17.8% below list) — sets the bar for 1% rule.
- Cap rate 6.6% vs local median 5.0% in Brownsville — top-decile yield for the area; either an underpriced asset or a hidden risk that comps aren't pricing in. Stress-test before assuming the spread holds.
Location & tenants
- Location reads 79/100 on livability (#62 in TX, #2,311 nationally) — a middle-class / working-renter tenant base. Strengths: commute A+, cost of living A+, housing A+; Watch: amenities D, crime D-, employment F.
- Los Fresnos CISD (suburban): math 34% / reading 44% proficiency, ranked #444 of 826 in TX (top 54%) — families likely to look elsewhere, expect single-tenant / working-renter base with shorter leases.
- Zoned schools: Villareal El (math 27% / reading 37%, grade F, #2,268 of 4,322 statewide, top 55%, 465 students, 78% FRL); Resaca Middle (math 29% / reading 44%, grade F, #786 of 1,662 statewide, top 48%, 857 students, 77% FRL); Los Fresnos H S (math 41% / reading 55%, grade D, #571 of 1,632 statewide, top 36%, 3,272 students, 82% FRL) — zoned schools average 79% FRL vs 43% district-wide (36 pts higher); higher-poverty schools than district average — tighter screening recommended.
- Market conditions: 75 active listings in the ZIP; 6 comparable units currently listed for rent nearby; rentals at typical pace (median 23d on market — plan ~3-4 weeks tenant-placement turnaround); 2,326 units permitted in Cameron County in 2024 (503 in 5+ unit buildings).
Forward outlook
- Local home prices are declining (-3.0%/yr); year-one equity from $2k of loan paydown is wiped out by about $9k of value loss. Plan a longer hold.
- Cameron County population projected at +3% by 2050 — modest demand growth; plan on rents tracking national, not racing it.
Negotiation context
- Only 7 days on market — expect competitive offers; lowballing is unlikely to land.
Questions for the listing agent
- Is there a deadline driving the sale (1031 exchange, divorce, estate, relocation)? That informs how much negotiation room exists.
- Crime grade is D in this area — have there been break-ins, vandalism, or insurance claims at this property in the last 3 years? What carrier currently insures it and at what premium?
- The area grade is low — what's the realistic commute time and amenity access for the typical tenant pool here? Any planned neighborhood developments (good or bad) we should know about?
- What's the average days-on-market for RENTAL listings here right now (not sales)? A rising rental-DOM trend means longer vacancies and softer asking-rent achievability than the comps imply.
- What's the recent tenant-quality profile in this submarket — average credit score on applications, eviction rate, late-payment / NSF rate, and stable-employment percentage? A property-management company in the area should have these aggregated.
- How much new for-sale + rental construction is in the pipeline within 1–3 miles? Heavy new supply typically softens prices + rents 12–24 months out; constrained supply supports both.
Investment metrics
- 1% rule
- 0.91% ✗
- Cap rate
- 6.60%
- Cash-on-cash
- 1.10%
- DSCR
- 1.05
- GRM
- 9.2
CMA / ARV
- ARV (on-the-fly)
- $301,224
- Comps found
- 12
Show comp detail 12 sales within ~0.75 mi
| Address | Dist | Beds/Ba | Sqft | Sold | Price | $/sf | Match |
|---|---|---|---|---|---|---|---|
| 8830 Wentz Lk | 0.31mi | 3/2.5 (-1) | 1,847 (-0%) | 0mo | $305,000 | $165 | 76 |
| 7121 Lake Tahoe | 0.06mi | 4/2.5 | 1,927 (+4%) | 20mo | $316,000 | $164 | 70 |
| 8723 Ashford | 0.29mi | 3/2.5 (-1) | 1,815 (-2%) | 8mo | $289,000 | $159 | 68 |
| 7122 Lake Tahoe | 0.07mi | 3/2.5 (-1) | 1,750 (-5%) | 13mo | $289,000 | $165 | 68 |
| 7026 Lake Almanor Dr | 0.07mi | 3/2.5 (-1) | 1,757 (-5%) | 15mo | $305,900 | $174 | 67 |
| 8879 Wentz Lk | 0.37mi | 3/2.5 (-1) | 1,917 (+4%) | 6mo | $309,000 | $161 | 62 |
| 8648 Verbena Ln | 0.20mi | 3/2.5 (-1) | 1,796 (-3%) | 18mo | $275,000 | $153 | 62 |
| 7246 Lake Shasta | 0.16mi | 4/3.5 | 2,027 (+10%) | 18mo | $329,000 | $162 | 62 |
| 7417 Lake Havasu | 0.17mi | 4/3.5 | 2,090 (+13%) | 13mo | $329,900 | $158 | 60 |
| 7208 Dominica Dr | 0.61mi | 4/2.5 | 1,781 (-4%) | 5mo | $280,000 | $157 | 57 |
| 8867 Wentz Lk | 0.39mi | 3/2.5 (-1) | 1,835 (-1%) | 18mo | $320,000 | $174 | 56 |
| 8827 Wentz Lk | 0.31mi | 3/2.5 (-1) | 2,066 (+12%) | 9mo | $336,000 | $163 | 50 |
Match score weights: distance 35% · size 25% · config 20% · recency 20%. Top-matched comps best support the ARV.
Projected returns pro-forma
-3.0% appreciation · 3.0% rent growth · sell at horizon
- IRR
- -14.5%
- Equity multiple
- 0.48×
- Total profit
- $-43,839
- Equity at exit
- $44,913
- IRR
- -5.8%
- Equity multiple
- 0.62×
- Total profit
- $-31,657
- Equity at exit
- $26,044
Cash invested: $84,343 (down + closing). Projections, not guarantees.
Landlord ↔ Tenant lean methodology
- Overall (STATE)
- 87 Strongly Landlord-Friendly
- State Texas
- 87 Strongly Landlord-Friendly · R+5
- County
- — inherits STATE
- City
- — inherits STATE
ZIP-level market 78575
- Home prices YoY
- -2.2%
- Active inventory
- 75
- Price-to-rent
- 10.1×
Monthly cashflow live
- Estimated rent
- $2,733 high interval (Pro) →
- Mortgage (P&I)
- −$1,580
- Tax est. 1.5%
- −$377 /mo · $4,518/yr
- Insurance
- −$126
- HOA
- −$0
- Vacancy / Maint / Mgmt
- −$574
- Net cashflow
- $77
Break-even live
Sensitivity live
| Price | -10% $286 | -5% $182 | +0% $77 | +5% $-27 | +10% $-131 |
|---|---|---|---|---|---|
| Rent | -10% $-138 | -5% $-31 | +0% $77 | +5% $185 | +10% $293 |
| Rate | -1.0pp $229 | -0.5pp $154 | base $77 | +0.5pp $-1 | +1.0pp $-80 |
UW: 25.0% down · 7.5% · 30yr · 1.5% tax · 5.0% vac · 8.0% maint · 8.0% mgmt
Financing live
Cash to close
- Down payment
- $75,306
- Closing costs
- $9,037
- Reserves months
- —
- Total cash needed
- —
Loan-product check · same deal, 3 products live
Conventional
25% down · 7.5% · 30yr
- Down + closing
- —
- Monthly P&I
- —
- Monthly cashflow
- —
- DSCR
- —
- Eligible?
- —
Personal DTI + credit; lowest rate.
DSCR
20% down · 8.5% · 30yr
- Down + closing
- —
- Monthly P&I
- —
- Monthly cashflow
- —
- DSCR
- —
- Eligible?
- —
No personal income docs; deal must DSCR.
Hard money
10% down · 12.0% · 12mo
- Down + closing
- —
- Monthly P&I
- —
- Monthly cashflow
- —
- DSCR
- —
- Eligible?
- —
Short-term bridge; refi at stabilization.
Rent comps 6 comps
| Address | Beds | Baths | Sqft | Rent | $/sqft | DOM | Units | Dist |
|---|---|---|---|---|---|---|---|---|
| 7425 Lake Havasu Brownsville, TX | 3.0 | 2.0 | 1786 | $2,700 | $1.51 | 23d | 1 | 0.10mi |
| 7425 Lake Havasu Brownsville, TX | 3.0 | 2.0 | 1786 | $2,700 | $1.51 | 15d | 1 | 0.10mi |
| 7072 Lago Vista Blvd Brownsville, TX | 3.0 | 3.0 | 2473 | $3,200 | $1.29 | 23d | 1 | 0.47mi |
| 7180 Dominica Dr Brownsville, TX | 4.0 | 4.0 | 2287 | $3,400 | $1.49 | 23d | 1 | 0.62mi |
| 6654 Pino Azul Brownsville, TX | 3.0 | 2.0 | 1433 | $1,900 | $1.33 | 45d | 1 | 1.41mi |
| 6919 Blue Spruce St Brownsville, TX | 3.0 | 2.0 | 1451 | $1,750 | $1.21 | 45d | 1 | 1.46mi |
Listing history 17 events
-
2026-06-18days on market $332,500 Active 7 DOM
-
2026-06-17days on market $332,500 Active 6 DOM
-
2026-06-16days on market $332,500 Active 5 DOM
-
2026-06-15days on market $332,500 Active 4 DOM
-
2026-06-14days on market $332,500 Active 2 DOM
-
2026-06-13days on market $332,500 Active 1 DOM
-
2026-06-10days on market $332,500 Active 23 DOM
-
2026-06-09days on market $332,500 Active 22 DOM
-
2026-06-08days on market $332,500 Active 21 DOM
-
2026-06-07days on market $332,500 Active 20 DOM
-
2026-06-05days on market $332,500 Active 17 DOM
-
2026-06-03days on market $332,500 Active 16 DOM
-
2026-06-02days on market $332,500 Active 15 DOM
-
2026-06-01days on market $332,500 Active 14 DOM
-
2026-05-31days on market $332,500 Active 13 DOM
-
2026-05-30days on market $332,500 Active 12 DOM
-
2026-05-18$332,500 Active
ⓘ Source: listings_history table (triggers on properties + properties_extension) + one-shot
backfill from property_details.listing_events for pre-trigger history.
Nearby sold comps map
Loading sold comps map…
Walkable amenities ~0.75 mi
Loading nearby amenities…
Taxation est. · year 1
- Rental income
- $32,797
- − Mortgage interest
- −$16,873
- − Property taxes
- −$4,518
- − Insurance
- −$1,506
- − Repairs & maintenance
- −$2,624
- − Management
- −$2,624
- − Depreciation
- −$8,763
- Taxable loss
- −$4,111
- Est. tax savings @ 24.0%
- +$987
- After-tax cash flow
- $1,916/yr
For passive investors: Depreciation is non-cash, so a rental often shows a tax loss while cash-flowing — sheltering income. Rental losses are passive: they offset passive income freely, and up to $25,000/yr can offset ordinary (W-2) income if you actively participate and your MAGI is under $100k (phasing out to $0 by $150k); unused losses carry forward. On sale, claimed depreciation is recaptured at up to 25%, and gains may owe capital-gains tax (a 1031 exchange can defer both). Figures are a year-1 estimate at your 24.0% rate — not tax advice; consult a CPA.
Condition & rehab AI · 30 photos
This newly built home in Summer Lakes subdivision is in excellent condition with modern finishes and a well-maintained exterior. It offers a great investment opportunity with minimal repairs and maintenance needed.
Value-add opportunities
- Both Painting the exterior and interior walls — Enhances curb appeal and interior aesthetics.
- Both Landscaping improvements — Enhances curb appeal and adds value to the property.
- Both Adding smart home features — Improves convenience and adds modern appeal.
- Both Upgrading the kitchen appliances — Enhances functionality and adds value to the property.
Renovation cost estimate screening
Value-add ROI direction
- Both Painting the exterior and interior walls — Enhances curb appeal and interior aesthetics. ↑
- Both Landscaping improvements — Enhances curb appeal and adds value to the property. ↑
- Both Adding smart home features — Improves convenience and adds modern appeal. ↑
- Both Upgrading the kitchen appliances — Enhances functionality and adds value to the property. ↑
ⓘ Cost ranges are severity-bucket heuristics (US national rule-of-thumb). Get contractor quotes + a written scope before underwriting a rehab budget.
Schools (NCES district)
- District
- Los Fresnos CISD
- NCES district ID
- 4828290
- Math proficiency
- 34% ▼ -30.00%
- Reading proficiency
- 44% ▼ -10.00%
- Median HH income
- $42,586
- Composite
- 32.92/100
- National rank
- #5601
- State rank
- #444 of 826 in TX
Livability — Brownsville
- Score
- 79/100
- State rank
- #62
- US rank
- #2311
Category grades
Schools grade is shown separately in the Schools card above.
Census & demographics
- City population
- 212,132
- Population (ZIP)
- 4,728
Population outlook (Cameron County) Hauer SSP2
- Today (2025)
- 441,603 people
- By 2030
- 448,113 · +1.5%
- By 2040
- 456,385 · +3.3%
- By 2050
- 456,294 · +3.3%
- By 2075
- 423,851 · -4.0%
- By 2100
- 342,787 · -22.4%
Race, ethnicity, and origin ACS 2023
- Neighborhood character
- Predominantly Hispanic (78%)
- Race & ethnicity
- Hispanic / Latino 78% Two or more races 36% White 19% Asian 3%
- Hispanic origin (detail)
- Mexican 75%
- Common ancestry
- Lithuanian 2% Slovak 1% Italian 1%
- Foreign-born
- 28% · Canada, China, Dominican Republic
- Languages at home
- 27% English-only · Spanish 70% Chinese 1% Other Indo-European 1%
Political lean MEDSL · Cameron
- 2024 margin
- Lean R (+5.8) · D 46.7% · R 52.5%
- 2008→2024 swing
- -34.6pp toward R · 2008: 28.8pp · 2024: -5.8pp
- All cycles
- 2024: R+5.8 2020: D+13.2 2016: D+32.5 2012: D+32.4 2008: D+28.8
Not yet ingested
- Civics
- —
Market trends
- HPI YoY
- ▼ -5.34%
- Current HPI
- 240.4582
- Rent YoY
- —
- Metro
- —
- State GDP YoY
- ▲ 3.95%
- F500 in state
- 110
Industry mix (Fortune 500 HQ in TX)
| Industry | F500 HQs | Revenue |
|---|---|---|
| Energy | 16 | $1,198B |
|
||
| Technology | 5 | $198B |
|
||
| Engineering / Construction | 4 | $72B |
|
||
| Energy Services | 3 | $60B |
|
||
| Utilities | 3 | $41B |
|
||
| Healthcare | 2 | $330B |
|
||
Price history
1 event — show timeline
- 2026-05-18 Listed $332,500 RGVMLS
Cash-flow waterfall
monthlySold comps — $/sqft
last 12 mo · ≤1 miLoading sold comps…