340 Horse Creek Dr #207 · Naples Park, FL
Flood risk 7/10 · Major
- FEMA flood zone
- X (shaded)
- Chance of flooding over 30 yrs
- 0.95%
- Est. flood insurance / yr
- $507 – $1,088
Fire risk 3/10 · Minor
- Est. fire insurance / yr
- $947 – $1,759
Heat risk 10/10 · Severe
- Hot days now (above 107°F)
- 7 days/yr
- Hot days in 30 yrs
- 31 days/yr
Wind risk 10/10 · Severe
- Chance of severe wind over 30 yrs
- 99.0%
Air-quality risk 2/10 · Minimal
- Unhealthy air days now
- 1 days/yr
- Unhealthy air days in 30 yrs
- 1 days/yr
Risk factors via First Street. Map © Google.
Why this score? — see what drove the B grade
The composite is a weighted blend of 9 inputs, each scored 0–100. Each bar is that input's sub-score; the figure is the points it added to the 100-point composite (weight × sub-score).
- Cash flow +30.0/30.0
- 1% rule +10.0/10.0
- DSCR +10.0/10.0
- ARV discount +7.5/15.0
- Schools +5.0/10.0
- Livability +3.2/5.0
- Condition / age +2.5/5.0
- Rent growth +2.2/5.0
- Appreciation +0.0/10.0
$275,000
🖨 Deal sheet (PDF) 📄 Offer letter ✓ Due diligence
Listing remarks
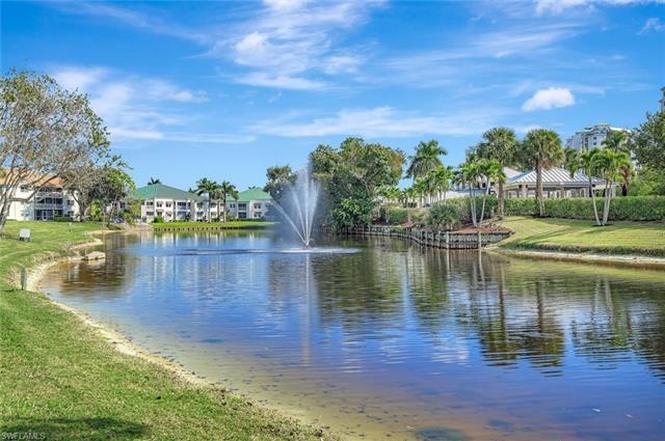
One or more photo(s) has been virtually staged, AI generated or rendered. Welcome to Princeton Place at Wiggins Bay in one of the most desirable areas in North Naples, ideally positioned west of US-41 with convenient access to Gulf beaches, world-class dining, shopping, and coastal recreation. This 2-bedroom, 2-bath property spans 1,356 sq. ft. of light-filled living space. A split-bedroom layout ensures privacy for guests, while the spacious open great room with dining and living combination flows naturally to a screened lanai where peaceful lake, landscaped views set the tone for relaxed Florida living. The kitchen features a stylish breakfast bar perfect for casual mornings, plus plenty
Key facts
- Split-bedroom layout
- Great-room design
- Community pool
Tags
Property features AI
Finance
- Other: Part of Wiggins Bay development (Princeton Place sub-condo); View offerings include bay, canal, lake, landscaped area, partial bay, pond, and pool/club; Canal width listed as 200+
- HOA & community: Mandatory HOA; Monthly condo fee of $800; Annual master HOA fee of $1,915; Professional management; HOA maintenance covers cable, internet/WiFi, irrigation water, lawn/land maintenance, manager, security, sewer, trash removal and water; Community amenities include pool, community room, exercise room, tennis court, streetlights, and vehicle wash area; Community type: boating and gated; Total annual recurring fees reported as $11,515
Exterior
- Parking: Vehicle wash area available in community
- Security: Gated community with guard at gate
- Utilities: Central water; Central sewer; Cable available
- Home design: Residential mid-rise (4-7 stories), traditional design; Built in 1990; Concrete block construction; Rear exposure to the south; Unit 207; Gulf access with no bridges
- Construction: Concrete block construction; Stucco finish; Built-up or flat roof; Built in 1990
- Exterior features: Patio; Sliding windows; Stucco exterior; Built-up or flat roof; Zero lot line; Paved road access; Reclaimed irrigation
Interior
- Kitchen: Electric cooktop; Range; Self-cleaning oven; Microwave; Dishwasher; Garbage disposal; Refrigerator/ice maker; Breakfast bar; Eat-in kitchen; Dining (living) area
- Bedrooms: 2 bedrooms (split bedroom floor plan)
- Flooring: Vinyl flooring
- Bathrooms: 2 full bathrooms; Master bathroom with dual sinks and shower
- Heating & cooling: Central electric heat; Central electric air conditioning; Ceiling fans
- Interior features: High-speed internet available; Smoke detectors; Walk-in closet; Common elevator; Screened balcony/lanai/porch; Laundry in residence
- Laundry & utility: Washer and dryer included; Washer/dryer hookup
Neighborhood map
What this means for you Summary
Snapshot
- This is a 2-bed/2.0-bath condo listed at $275k.
Deal economics
- At list price, monthly cash flow is $999 ($12k/yr) — positive.
- The deal already cash-flows at list — no discount required.
- Meets the 1% rule at list price ($5k rent vs $275k).
- Recommended offer: $242k (12.0% below list) — sets the bar for market timing.
Location & tenants
- Location reads 64/100 on livability (#696 in FL) — a middle-class / working-renter tenant base. Strengths: crime A+, housing A-, employment B+; Watch: health & safety D, schools F, amenities F.
- Collier (suburban): math 60% / reading 56% proficiency, ranked #16 of 73 in FL (top 22%) — acceptable for families but not a draw, mixed tenant base, ~2y average lease.
- Market conditions: Rents soft (-1.1%/yr); 595 active listings in the ZIP; 40 comparable units currently listed for rent nearby; rentals at typical pace (median 24d on market — plan ~3-4 weeks tenant-placement turnaround); solid renter incomes; 3,520 units permitted in Collier County in 2024 (959 in 5+ unit buildings).
- At $4,886/mo this rent would consume 60% of the median local household income ($98k/yr) (locally 1006% of renters already pay >50% of income on rent) — very limited rent-growth headroom before tenants either downsize or default.
Forward outlook
- Local home prices are declining (-3.0%/yr); year-one equity from $2k of loan paydown is wiped out by about $8k of value loss. Plan a longer hold.
- Collier County population projected at +30% by 2050 — long-run rental-demand tailwind backs the buy-and-hold thesis.
Negotiation context
- It's been on market 194 days — a 12% lower offer ($242k) is reasonable based on typical stale-listing flexibility.
- 2 sale attempts since 10y ago; this cycle's ask has dropped $50k (15%) from the opening price — seller is motivated, your offer sets the floor, not the list.
Risks & watch-outs
- Watch-outs: flood insurance adds $66/mo.
- Climate carrying-cost: major flood risk; severe wind risk, 99% chance of damaging wind over 30y; extreme-heat days projected 7→31/yr by 2055 (HVAC capex compounding) — expect insurance premiums to compound above CPI over the hold.
Questions for the listing agent
- It's been on market 194 days. Have you received any prior offers? Is the seller open to a 12% concession, seller financing, or rate buy-down credit?
- What's the actual annual flood-insurance premium (NFIP or private), and is the property in a SFHA with mandatory coverage?
- What does the HOA fee cover, when was the last increase, and are there any pending special assessments or reserve-fund shortfalls?
- Any open or pending special assessments — roof, HVAC, plumbing, elevator, façade? What's the per-unit balance and payoff schedule, and is the seller paying it off at close or rolling it to the buyer?
- Why hasn't it sold? Are there any deal-killer items the seller is aware of (foundation, flood, title, zoning, code violations)?
- Is there a deadline driving the sale (1031 exchange, divorce, estate, relocation)? That informs how much negotiation room exists.
- Schools are F-rated, which usually means shorter tenancies and higher turnover. Who's the typical renter profile here, and what's been the actual vacancy rate?
- What's the average days-on-market for RENTAL listings here right now (not sales)? A rising rental-DOM trend means longer vacancies and softer asking-rent achievability than the comps imply.
- What's the recent tenant-quality profile in this submarket — average credit score on applications, eviction rate, late-payment / NSF rate, and stable-employment percentage? A property-management company in the area should have these aggregated.
- How much new apartment / multifamily construction is in the pipeline within 1–3 miles? Heavy new supply (>2% of stock underway) typically softens rents 12–24 months out; light construction supports rent growth.
Investment metrics
- 1% rule
- 1.78% ✓
- Cap rate
- 10.94%
- Cash-on-cash
- 16.61%
- DSCR
- 1.74
- GRM
- 4.7
CMA / ARV
No comps found within radius.
Projected returns pro-forma
-3.0% appreciation · 0.0% rent growth · sell at horizon
- IRR
- 1.9%
- Equity multiple
- 1.07×
- Total profit
- $5,426
- Equity at exit
- $41,003
- IRR
- 7.2%
- Equity multiple
- 1.44×
- Total profit
- $34,032
- Equity at exit
- $23,777
Cash invested: $77,000 (down + closing). Projections, not guarantees.
Landlord ↔ Tenant lean methodology
- Overall (STATE)
- 87 Strongly Landlord-Friendly
- State Florida
- 87 Strongly Landlord-Friendly · R+3
- County
- — inherits STATE
- City
- — inherits STATE
ZIP-level market 34110
- Rents YoY
- -1.1%
- Active inventory
- 595
- Price-to-rent
- 4.7×
Monthly cashflow live
- Estimated rent
- $4,886 high interval (Pro) →
- Mortgage (P&I)
- −$1,442
- Tax from tax record
- −$279 /mo · $3,347/yr
- Insurance
- −$115
- Flood insurance flood zone
- −$66 /mo · $798/yr
- HOA
- −$959
- Vacancy / Maint / Mgmt
- −$1,026
- Net cashflow
- $999
Break-even live
Sensitivity live
| Price | -10% $1,155 | -5% $1,077 | +0% $999 | +5% $921 | +10% $844 |
|---|---|---|---|---|---|
| Rent | -10% $613 | -5% $806 | +0% $999 | +5% $1,192 | +10% $1,385 |
| Rate | -1.0pp $1,138 | -0.5pp $1,069 | base $999 | +0.5pp $928 | +1.0pp $856 |
UW: 25.0% down · 7.5% · 30yr · 1.5% tax · 5.0% vac · 8.0% maint · 8.0% mgmt
Financing live
Cash to close
- Down payment
- $68,750
- Closing costs
- $8,250
- Reserves months
- —
- Total cash needed
- —
Loan-product check · same deal, 3 products live
Conventional
25% down · 7.5% · 30yr
- Down + closing
- —
- Monthly P&I
- —
- Monthly cashflow
- —
- DSCR
- —
- Eligible?
- —
Personal DTI + credit; lowest rate.
DSCR
20% down · 8.5% · 30yr
- Down + closing
- —
- Monthly P&I
- —
- Monthly cashflow
- —
- DSCR
- —
- Eligible?
- —
No personal income docs; deal must DSCR.
Hard money
10% down · 12.0% · 12mo
- Down + closing
- —
- Monthly P&I
- —
- Monthly cashflow
- —
- DSCR
- —
- Eligible?
- —
Short-term bridge; refi at stabilization.
Rent comps 40 comps
| Address | Beds | Baths | Sqft | Rent | $/sqft | DOM | Units | Dist |
|---|---|---|---|---|---|---|---|---|
| 340 Horse Creek Dr #304 Naples, FL | 2.0 | 2.0 | 1326 | $2,950 | $2.22 | 24d | 1 | 0.02mi |
| 360 Horse Creek Dr Naples, FL | 2.0 | 2.0 | 1589 | $5,250 | $3.30 | 14d | 4 | 0.05mi |
| 320 Horse Creek Dr #105 Naples, FL | 2.0 | 2.0 | 1326 | $5,600 | $4.22 | 24d | 1 | 0.05mi |
| 300 Horse Creek Dr #408 Naples, FL | 2.0 | 2.0 | 1434 | $5,500 | $3.84 | 24d | 1 | 0.10mi |
| 480 Bermuda Cove Way Unit 1-104 Naples, FL | 2.0 | 2.0 | 1372 | $4,250 | $3.10 | 24d | 1 | 0.16mi |
| 430 Cove Tower Dr #1202 Naples, FL | 3.0 | 2.0 | 1519 | $7,800 | $5.13 | 24d | 1 | 0.19mi |
| 430 Cove Tower Dr #302 Naples, FL | 3.0 | 2.0 | 1623 | $6,500 | $4.00 | 24d | 1 | 0.19mi |
| 420 Cove Tower Dr #802 Naples, FL | 3.0 | 2.0 | 1621 | $4,750 | $2.93 | 24d | 1 | 0.19mi |
| 425 Cove Tower Dr #902 Naples, FL | 2.0 | 2.0 | 1854 | $9,400 | $5.07 | 24d | 1 | 0.23mi |
| 13105 Vanderbilt Dr Naples, FL | 2.0 | 2.0 | 1390 | $5,450 | $3.92 | 24d | 2 | 0.32mi |
| 13105 Vanderbilt Dr #808 Naples, FL | 2.0 | 2.0 | 1390 | $5,500 | $3.96 | 21d | 1 | 0.32mi |
| 13105 Vanderbilt Dr #808 Naples, FL | 2.0 | 2.0 | 1390 | $5,500 | $3.96 | 14d | 1 | 0.32mi |
| 12945 Vanderbilt Dr Naples, FL | 2.0 | 2.0 | 1301 | $5,250 | $4.04 | 24d | 2 | 0.37mi |
| 651 Wiggins Lake Dr #102 Naples, FL | 2.0 | 2.0 | 1487 | $6,500 | $4.37 | 24d | 1 | 0.37mi |
| 774 Wiggins Lake Dr #106 Naples, FL | 3.0 | 2.0 | 1374 | $6,500 | $4.73 | 24d | 1 | 0.41mi |
| 437 Wiggins Lake Ct #201 Naples, FL | 2.0 | 2.0 | 1283 | $4,500 | $3.51 | 24d | 1 | 0.44mi |
| 760 Wiggins Lake Dr #205 Naples, FL | 2.0 | 2.0 | 1179 | $5,500 | $4.66 | 24d | 1 | 0.51mi |
| 757 Wiggins Lake Dr #106 Naples, FL | 3.0 | 2.0 | 1374 | $6,000 | $4.37 | 24d | 1 | 0.53mi |
| 757 Wiggins Lake Dr #106 Naples, FL | 3.0 | 2.0 | 1374 | $6,000 | $4.37 | 14d | 1 | 0.53mi |
| 752 Wiggins Lake Dr #102 Naples, FL | 2.0 | 2.0 | 1402 | $2,375 | $1.69 | 21d | 1 | 0.54mi |
| 1282 Belaire Ct Naples, FL | 3.0 | 3.5 | 1495 | $9,500 | $6.35 | 24d | 1 | 0.60mi |
| 817 Carrick Bend Cir #101 Naples, FL | 3.0 | 2.0 | 1660 | $5,995 | $3.61 | 14d | 1 | 0.62mi |
| 1284 Rainbow Ct Naples, FL | 2.0 | 2.0 | 1572 | $4,200 | $2.67 | 21d | 1 | 0.64mi |
| 1296 Grand Canal Dr Naples, FL | 3.0 | 2.0 | 1614 | $8,000 | $4.96 | 24d | 1 | 0.67mi |
| 784 Carrick Bend Cir #101 Naples, FL | 3.0 | 2.0 | 1515 | $3,500 | $2.31 | 24d | 1 | 0.67mi |
| 1337 Center Ln Naples, FL | 3.0 | 2.0 | 1500 | $4,300 | $2.87 | 24d | 1 | 0.69mi |
| 513 Lake Louise Cir #202 Naples, FL | 2.0 | 2.0 | 1444 | $5,300 | $3.67 | 24d | 1 | 0.74mi |
| 505 Lake Louise Cir #101 Naples, FL | 2.0 | 2.0 | 1444 | $5,500 | $3.81 | 24d | 1 | 0.80mi |
| 1001 Arbor Lake Dr Naples, FL | 2.0–3.0 | 2.0–2.5 | 1755 | $3,800 | $2.16 | 24d | 2 | 0.80mi |
| 526 Lake Louise Cir Unit 4-403 Naples, FL | 3.0 | 2.0 | 1740 | $6,500 | $3.74 | 24d | 1 | 0.81mi |
| 975 Tarpon Cove Dr #204 Naples, FL | 3.0 | 2.0 | 1340 | $5,500 | $4.10 | 14d | 1 | 0.86mi |
| 1025 Tarpon Cove Dr #203 Naples, FL | 2.0 | 2.0 | 1225 | $5,500 | $4.49 | 14d | 1 | 0.89mi |
| 298 Emerald Bay Cir Unit K6 Naples, FL | 2.0 | 2.0 | 1202 | $4,750 | $3.95 | 24d | 1 | 0.90mi |
| 306 Emerald Bay Cir Unit J8 Naples, FL | 2.0 | 2.0 | 1350 | $4,000 | $2.96 | 24d | 1 | 0.91mi |
| 306 Emerald Bay Cir Unit J5 Naples, FL | 3.0 | 2.0 | 1490 | $5,900 | $3.96 | 24d | 1 | 0.91mi |
| 341 Emerald Bay Cir Unit T5 Naples, FL | 3.0 | 2.0 | 1611 | $4,500 | $2.79 | 24d | 1 | 0.99mi |
| 386 Emerald Bay Cir Unit G4 Naples, FL | 3.0 | 2.0 | 1490 | $2,500 | $1.68 | 24d | 1 | 1.00mi |
| 509 Roma Ct Naples, FL | 3.0 | 2.0 | 1322 | $3,850 | $2.91 | 24d | 3 | 1.07mi |
| 519 Roma Ct Naples, FL | 3.0 | 2.0 | 1260 | $4,450 | $3.53 | 14d | 6 | 1.07mi |
| 15161 Cedarwood Ln Naples, FL | 2.0 | 2.0 | 1267 | $4,000 | $3.16 | 24d | 3 | 1.10mi |
HOA detail condo
- Monthly dues
- $959 · $11,508/yr
- Assessments
- None detected in remarks — confirm with the listing agent.
Listing history 32 events
-
2026-06-18days on market $275,000 Active 194 DOM
-
2026-06-17days on market $275,000 Active 193 DOM
-
2026-06-16days on market $275,000 Active 192 DOM
-
2026-06-15days on market $275,000 Active 191 DOM
-
2026-06-10days on market $275,000 Active 186 DOM
-
2026-06-09days on market $275,000 Active 185 DOM
-
2026-06-08days on market $275,000 Active 184 DOM
-
2026-06-07statusdays on market $275,000 Active 183 DOM
-
2026-06-03status $275,000 Pending With Contingencies 181 DOM
-
2026-06-02days on market $275,000 Active 181 DOM
-
2026-06-01days on market $275,000 Active 180 DOM
-
2026-05-31days on market $275,000 Active 179 DOM
-
2026-05-30days on market $275,000 Active 178 DOM
-
2026-04-01price $300,000
-
2026-02-09price $320,000
-
2025-12-03$325,000 Active
-
2018-09-07soldstatus $290,000
-
2018-05-30price $297,500
-
2018-03-13price $299,000
-
2018-03-06price $320,000
-
2017-10-04price $340,000
-
2016-12-30price $212,500
-
2016-12-29soldstatus $212,500
-
2016-12-20soldstatus $212,500 Sold
-
2016-12-20price $275,000
-
2016-12-15status Pending
-
2016-10-27price $275,000
-
2016-08-15$289,000 Active
-
2003-05-14soldstatus $201,500
-
1999-09-13soldstatus $118,000
-
1994-11-01soldstatus $110,000
-
1991-12-01soldstatus $109,900
ⓘ Source: listings_history table (triggers on properties + properties_extension) + one-shot
backfill from property_details.listing_events for pre-trigger history.
Tax reassessment forecast FL · Resets to sale price
- Current annual tax
- $3,347 · $279/mo
- Projected year-2 tax
- $3,347 · $279/mo
- Expected delta
- $0/yr ($0/mo · 0.0%)
ⓘ Screening estimate from a state-policy table — verify with the county assessor before closing.
Climate risk First Street
- Flood 7/10 Severe FEMA zone X (shaded) · 95% chance over 30 yrs
- Wildfire 3/10 Moderate
- Heat 10/10 Extreme 7 d/yr ≥107°F today · 31 d/yr by 30 yrs out
- Wind 10/10 Extreme 99% chance of damaging wind over 30 yrs
- Air quality 2/10 Low 1 unhealthy d/yr today · 1 by 30 yrs out
Nearby sold comps map
Loading sold comps map…
Walkable amenities ~0.75 mi
Loading nearby amenities…
Taxation est. · year 1
- Rental income
- $58,638
- − Mortgage interest
- −$15,404
- − Property taxes
- −$3,347
- − Insurance
- −$2,172
- − Repairs & maintenance
- −$4,691
- − Management
- −$4,691
- − HOA
- −$11,508
- − Depreciation
- −$8,000
- Taxable income
- $8,824
- Est. tax owed @ 24.0%
- −$2,118
- After-tax cash flow
- $9,873/yr
For passive investors: Depreciation is non-cash, so a rental often shows a tax loss while cash-flowing — sheltering income. Rental losses are passive: they offset passive income freely, and up to $25,000/yr can offset ordinary (W-2) income if you actively participate and your MAGI is under $100k (phasing out to $0 by $150k); unused losses carry forward. On sale, claimed depreciation is recaptured at up to 25%, and gains may owe capital-gains tax (a 1031 exchange can defer both). Figures are a year-1 estimate at your 24.0% rate — not tax advice; consult a CPA.
Schools (NCES district)
- District
- Collier
- NCES district ID
- 1200330
- Math proficiency
- 60% ▼ -4.00%
- Reading proficiency
- 56% ▼ -2.00%
- Median HH income
- $58,275
- Composite
- 50.23/100
- National rank
- #1892
- State rank
- #16 of 73 in FL
Livability — Naples Park
- Score
- 64/100
- State rank
- #696
- US rank
- #14564
Category grades
Schools grade is shown separately in the Schools card above.
Census & demographics
- County
- Collier County · 396,295 people
- Metro
- Naples-Marco Island, FL
- Population (ZIP)
- 25,630
- Household income
- $97,564
- Rent vs Own
- Severe rent burden
- 1006.0
Population outlook (Collier County) Hauer SSP2
- Today (2025)
- 420,858 people
- By 2030
- 450,054 · +6.9%
- By 2040
- 502,232 · +19.3%
- By 2050
- 544,932 · +29.5%
- By 2075
- 627,203 · +49.0%
- By 2100
- 659,015 · +56.6%
Race, ethnicity, and origin ACS 2023
- Neighborhood character
- Predominantly White (84%)
- Race & ethnicity
- White 84% Hispanic / Latino 10% Two or more races 9% Asian 2% Black 1%
- Hispanic origin (detail)
- Mexican 2% Puerto Rican 1% Cuban 3%
- Common ancestry
- Romanian 4% Lithuanian 3% Slovak 2%
- Foreign-born
- 11% · Canada, South Korea
- Languages at home
- 87% English-only · Spanish 7% Other Indo-European 3% French/Haitian/Cajun 1%
Political lean MEDSL · Collier
- 2024 margin
- Solid R (+33.1) · D 33.1% · R 66.2%
- 2008→2024 swing
- -10.6pp toward R · 2008: -22.5pp · 2024: -33.1pp
- All cycles
- 2024: R+33.1 2020: R+24.7 2016: R+26.0 2012: R+30.1 2008: R+22.5
Not yet ingested
- Civics
- —
Market trends
- HPI YoY
- ▼ -172.68%
- Current HPI
- 267.4644
- Rent YoY
- ▼ -1.06%
- Metro
- Naples-Marco Island, FL
- State GDP YoY
- ▲ 3.28%
- F500 in state
- 36
Industry mix (Fortune 500 HQ in FL)
| Industry | F500 HQs | Revenue |
|---|---|---|
| Industrial Technology | 2 | $29B |
|
||
| Insurance | 2 | $17B |
|
||
| Retail | 1 | $60B |
|
||
| Technology Distribution | 1 | $58B |
|
||
| Homebuilding | 1 | $35B |
|
||
| Technology Manufacturing | 1 | $35B |
|
||
Price history
+173.0% since first listed19 events — show timeline
- 2026-04-01 Price Changed $300,000 NAPLESMLS
- 2026-02-09 Price Changed $320,000 NAPLESMLS
- 2025-12-03 Listed $325,000 NAPLESMLS
- 2018-09-07 Sold (Public Records) $290,000 Public Records
- 2018-05-30 Price Changed $297,500 BEARMLS
- 2018-03-13 Price Changed $299,000 BEARMLS
- 2018-03-06 Price Changed $320,000 BEARMLS
- 2017-10-04 Price Changed $340,000 BEARMLS
- 2016-12-30 Price Changed $212,500 NAPLESMLS
- 2016-12-29 Sold (Public Records) $212,500 Public Records
- 2016-12-20 Price Changed $275,000 NAPLESMLS
- 2016-12-20 Sold (MLS) $212,500 NAPLESMLS
- 2016-12-15 Pending — NAPLESMLS
- 2016-10-27 Price Changed $275,000 NAPLESMLS
- 2016-08-15 Listed $289,000 NAPLESMLS
- 2003-05-14 Sold (Public Records) $201,500 Public Records
- 1999-09-13 Sold (Public Records) $118,000 Public Records
- 1994-11-01 Sold (Public Records) $110,000 Public Records
- 1991-12-01 Sold (Public Records) $109,900 Public Records
Property tax history
+7.8%/yrLatest (2025): $3,347 · +3.9% YoY. Source: county tax records.
Cash-flow waterfall
monthlySold comps — $/sqft
last 12 mo · ≤1 miLoading sold comps…