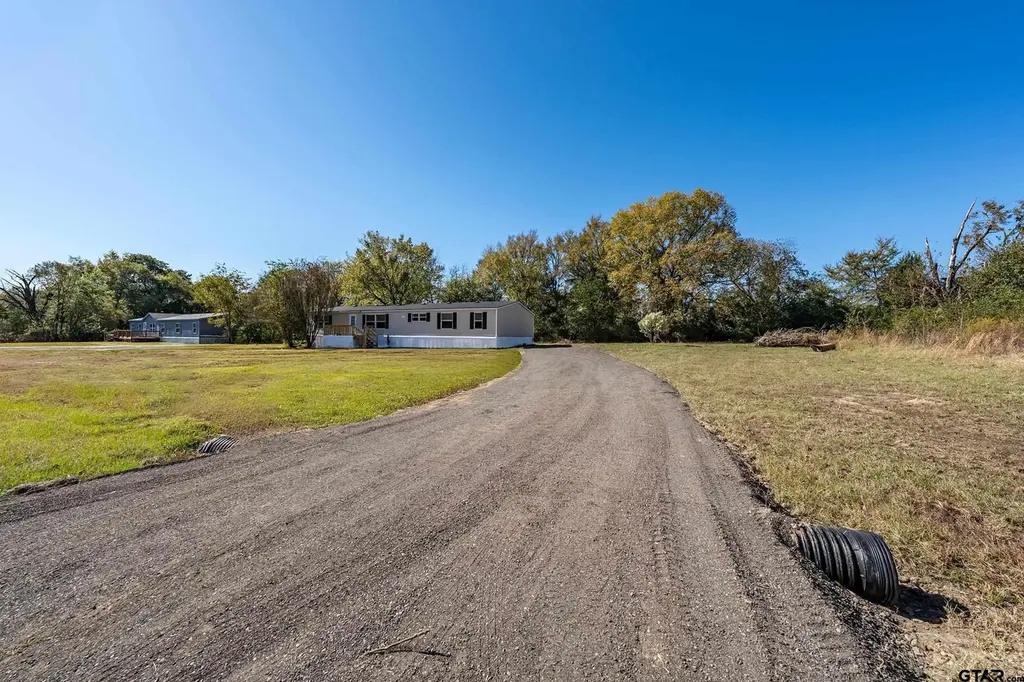
1121 Pecan Rdg · Sunrise Shores, TX
Flood risk 1/10 · Minimal
- FEMA flood zone
- X (unshaded)
- Chance of flooding over 30 yrs
- 0.0%
- Est. flood insurance / yr
- $507 – $1,088
Fire risk 4/10 · Minor
- Est. fire insurance / yr
- $1,222 – $2,270
Heat risk 7/10 · Major
- Hot days now (above 109°F)
- 7 days/yr
- Hot days in 30 yrs
- 26 days/yr
Wind risk 6/10 · Moderate
- Chance of severe wind over 30 yrs
- 68.0%
Air-quality risk 1/10 · Minimal
- Unhealthy air days now
- 0 days/yr
- Unhealthy air days in 30 yrs
- 0 days/yr
Risk factors via First Street. Map © Google.
Why this score? — see what drove the C- grade
The composite is a weighted blend of 9 inputs, each scored 0–100. Each bar is that input's sub-score; the figure is the points it added to the 100-point composite (weight × sub-score).
- Cash flow +19.9/30.0
- ARV discount +8.4/15.0
- DSCR +6.3/10.0
- 1% rule +5.0/10.0
- Schools +3.7/10.0
- Rent growth +2.5/5.0
- Livability +2.5/5.0
- Condition / age +2.5/5.0
- Appreciation +0.0/10.0
$167,900
🖨 Deal sheet (PDF) 📄 Offer letter ✓ Due diligence
Listing remarks MLS
Welcome to this beautifully updated 4-bedroom, 2-bathroom mobile home, perfectly situated on a spacious half-acre lot. This move-in-ready property has been thoughtfully renovated from top to bottom, offering both comfort and peace of mind. Enjoy a brand-new roof, updated PEX plumbing, and all-new appliances, making everyday living both efficient and worry-free. Inside, the home features freshly painted interiors, stylish new flooring throughout, and fully remodeled bathrooms designed with modern finishes. Step outside to find brand-new front and back decks—perfect for relaxing or entertaining—along with new skirting that adds a clean, finished look to the home’s exterior. The crushed asphalt driveway provides easy access and ample parking. With plenty of outdoor space and high-quality upgrades throughout, this property offers the perfect blend of modern convenience and country charm. Don’t miss your chance to own this beautifully refreshed home!
Key facts
- Updated pex plumbing
- Stylish new flooring
- Brand new roof
Tags
Neighborhood map
What this means for you Summary
Snapshot
- This is a 4-bed/2.0-bath manufactured listed at $168k.
Deal economics
- At list price, monthly cash flow is $202 ($2k/yr) — positive.
- The deal already cash-flows at list — no discount required.
- To meet the 1% rule (rent ≥ 1% of price), the offer needs to be $168k (0.2% below list).
- Recommended offer: $158k (6.0% below list) — sets the bar for market timing.
- Cap rate 7.7% vs local median 4.1% in Sunrise Shores — top-decile yield for the area; either an underpriced asset or a hidden risk that comps aren't pricing in. Stress-test before assuming the spread holds.
Location & tenants
- Location reads: area grade C — affects rentability + tenant quality, not the cash-flow math above.
- Brownsboro ISD (rural): math 42% / reading 46% proficiency, ranked #290 of 826 in TX (top 35%) — families likely to look elsewhere, expect single-tenant / working-renter base with shorter leases.
- Zoned schools: Chandler El (math 42% / reading 37%, grade F, #1,545 of 4,322 statewide, top 38%, 450 students, 74% FRL); Brownsboro J H (math 48% / reading 49%, grade C-, #392 of 1,662 statewide, top 24%, 405 students, 60% FRL); Brownsboro H S (math 31% / reading 63%, grade D-, #591 of 1,632 statewide, top 38%, 757 students, 50% FRL).
- Market conditions: 228 active listings in the ZIP; 263 units permitted in Henderson County in 2024 (0 in 5+ unit buildings).
Forward outlook
- Local home prices are declining (-3.0%/yr); year-one equity from $1k of loan paydown is wiped out by about $5k of value loss. Plan a longer hold.
Negotiation context
- It's been on market 63 days — a 6% lower offer ($158k) is reasonable based on typical stale-listing flexibility.
Risks & watch-outs
- Climate carrying-cost: major wind risk, 68% chance of damaging wind over 30y; extreme-heat days projected 7→26/yr by 2055 (HVAC capex compounding) — expect insurance premiums to compound above CPI over the hold.
Questions for the listing agent
- It's been on market 63 days. Have you received any prior offers? Is the seller open to a 6% concession, seller financing, or rate buy-down credit?
- Why hasn't it sold? Are there any deal-killer items the seller is aware of (foundation, flood, title, zoning, code violations)?
- Is there a deadline driving the sale (1031 exchange, divorce, estate, relocation)? That informs how much negotiation room exists.
- What's the average days-on-market for RENTAL listings here right now (not sales)? A rising rental-DOM trend means longer vacancies and softer asking-rent achievability than the comps imply.
- What's the recent tenant-quality profile in this submarket — average credit score on applications, eviction rate, late-payment / NSF rate, and stable-employment percentage? A property-management company in the area should have these aggregated.
- How much new for-sale + rental construction is in the pipeline within 1–3 miles? Heavy new supply typically softens prices + rents 12–24 months out; constrained supply supports both.
Investment metrics
- 1% rule
- 1.00% ✗
- Cap rate
- 7.73%
- Cash-on-cash
- 5.14%
- DSCR
- 1.23
- GRM
- 8.4
CMA / ARV
- ARV (median comp)
- $171,196
- List price
- $167,900
- Delta
- -1.93%
- Verdict
- FAIR
- Comps
- 3 within 2.0 mi
Show comp detail 1 sale within ~0.75 mi
| Address | Dist | Beds/Ba | Sqft | Sold | Price | $/sf | Match |
|---|---|---|---|---|---|---|---|
| 20561 Joe Paul Ln | 0.73mi | 4/3.0 | 2,048 (+0%) | 21mo | $120,000 | $59 | 44 |
Match score weights: distance 35% · size 25% · config 20% · recency 20%. Top-matched comps best support the ARV.
Projected returns pro-forma
-3.0% appreciation · 3.0% rent growth · sell at horizon
- IRR
- -8.3%
- Equity multiple
- 0.69×
- Total profit
- $-14,371
- Equity at exit
- $25,034
- IRR
- 1.2%
- Equity multiple
- 1.09×
- Total profit
- $4,019
- Equity at exit
- $14,517
Cash invested: $47,012 (down + closing). Projections, not guarantees.
Landlord ↔ Tenant lean methodology
- Overall (STATE)
- 87 Strongly Landlord-Friendly
- State Texas
- 87 Strongly Landlord-Friendly · R+5
- County
- — inherits STATE
- City
- — inherits STATE
ZIP-level market 75758
- Home prices YoY
- -27.6%
- Active inventory
- 228
- Price-to-rent
- 8.4×
Monthly cashflow live
- Estimated rent
- $1,675 medium interval (Pro) →
- Mortgage (P&I)
- −$880
- Tax from tax record
- −$171 /mo · $2,056/yr
- Insurance
- −$70
- HOA
- −$0
- Vacancy / Maint / Mgmt
- −$352
- Net cashflow
- $202
Break-even live
Sensitivity live
| Price | -10% $297 | -5% $249 | +0% $202 | +5% $154 | +10% $106 |
|---|---|---|---|---|---|
| Rent | -10% $69 | -5% $135 | +0% $202 | +5% $268 | +10% $334 |
| Rate | -1.0pp $286 | -0.5pp $244 | base $202 | +0.5pp $158 | +1.0pp $114 |
UW: 25.0% down · 7.5% · 30yr · 1.5% tax · 5.0% vac · 8.0% maint · 8.0% mgmt
Financing live
Cash to close
- Down payment
- $41,975
- Closing costs
- $5,037
- Reserves months
- —
- Total cash needed
- —
Loan-product check · same deal, 3 products live
Conventional
25% down · 7.5% · 30yr
- Down + closing
- —
- Monthly P&I
- —
- Monthly cashflow
- —
- DSCR
- —
- Eligible?
- —
Personal DTI + credit; lowest rate.
DSCR
20% down · 8.5% · 30yr
- Down + closing
- —
- Monthly P&I
- —
- Monthly cashflow
- —
- DSCR
- —
- Eligible?
- —
No personal income docs; deal must DSCR.
Hard money
10% down · 12.0% · 12mo
- Down + closing
- —
- Monthly P&I
- —
- Monthly cashflow
- —
- DSCR
- —
- Eligible?
- —
Short-term bridge; refi at stabilization.
Listing history 20 events
-
2026-06-13status $167,900 Pending 63 DOM
-
2026-06-10days on market $167,900 Active 63 DOM
-
2026-06-09days on market $167,900 Active 62 DOM
-
2026-06-08days on market $167,900 Active 61 DOM
-
2026-06-07days on market $167,900 Active 60 DOM
-
2026-06-02days on market $167,900 Active 55 DOM
-
2026-06-01days on market $167,900 Active 54 DOM
-
2026-05-31days on market $167,900 Active 53 DOM
-
2026-05-30days on market $167,900 Active 52 DOM
-
2026-04-08$167,900 Active 983-char remark
Show marketing remark (983 chars)
Welcome to this beautifully updated 4-bedroom, 2-bathroom mobile home, perfectly situated on a spacious half-acre lot. This move-in-ready property has been thoughtfully renovated from top to bottom, offering both comfort and peace of mind. Enjoy a brand-new roof, updated PEX plumbing, and all-new appliances, making everyday living both efficient and worry-free. Inside, the home features freshly painted interiors, stylish new flooring throughout, and fully remodeled bathrooms designed with modern finishes. Step outside to find brand-new front and back decks—perfect for relaxing or entertaining—along with new skirting that adds a clean, finished look to the home’s exterior. The crushed asphalt driveway provides easy access and ample parking. With plenty of outdoor space and high-quality upgrades throughout, this property offers the perfect blend of modern convenience and country charm. Don’t miss your chance to own this beautifully refreshed home!
-
2026-03-12price $167,900
-
2026-01-22price $163,900
-
2026-01-08price $164,900
-
2025-12-31price $165,900
-
2025-12-09price $169,900
-
2025-12-03price $177,900
-
2025-04-04soldstatus
-
2025-03-06soldstatus
-
2025-03-06soldstatus
-
2000-01-22soldstatus
ⓘ Source: listings_history table (triggers on properties + properties_extension) + one-shot
backfill from property_details.listing_events for pre-trigger history.
Tax reassessment forecast TX · Resets to sale price
- Current annual tax
- $2,056 · $171/mo
- Projected year-2 tax
- $3,073 · $256/mo
- Expected delta
- +$1,017/yr (+$85/mo · 49.4%)
ⓘ Screening estimate from a state-policy table — verify with the county assessor before closing.
Climate risk First Street
- Flood 1/10 Low FEMA zone X (unshaded) · 0% chance over 30 yrs
- Wildfire 4/10 Moderate
- Heat 7/10 Severe 7 d/yr ≥109°F today · 26 d/yr by 30 yrs out
- Wind 6/10 Major 68% chance of damaging wind over 30 yrs
- Air quality 1/10 Low 0 unhealthy d/yr today · 0 by 30 yrs out
Nearby sold comps map
Loading sold comps map…
Walkable amenities ~0.75 mi
Loading nearby amenities…
Taxation est. · year 1
- Rental income
- $20,101
- − Mortgage interest
- −$9,405
- − Property taxes
- −$2,056
- − Insurance
- −$840
- − Repairs & maintenance
- −$1,608
- − Management
- −$1,608
- − Depreciation
- −$4,884
- Taxable loss
- −$300
- Est. tax savings @ 24.0%
- +$72
- After-tax cash flow
- $2,490/yr
For passive investors: Depreciation is non-cash, so a rental often shows a tax loss while cash-flowing — sheltering income. Rental losses are passive: they offset passive income freely, and up to $25,000/yr can offset ordinary (W-2) income if you actively participate and your MAGI is under $100k (phasing out to $0 by $150k); unused losses carry forward. On sale, claimed depreciation is recaptured at up to 25%, and gains may owe capital-gains tax (a 1031 exchange can defer both). Figures are a year-1 estimate at your 24.0% rate — not tax advice; consult a CPA.
Schools (NCES district)
- District
- Brownsboro ISD
- NCES district ID
- 4811640
- Math proficiency
- 42% ▼ -5.00%
- Reading proficiency
- 46% ▬ 0.00%
- Median HH income
- $45,624
- Composite
- 37.38/100
- National rank
- #4429
- State rank
- #290 of 826 in TX
Livability — Sunrise Shores
No livability data for this city. (Only ~50 U.S. cities are tracked.)
Census & demographics
- Population (ZIP)
- 10,357
Population outlook (Henderson County) Hauer SSP2
- Today (2025)
- 80,471 people
- By 2030
- 80,608 · +0.2%
- By 2040
- 80,087 · -0.5%
- By 2050
- 78,208 · -2.8%
- By 2075
- 72,423 · -10.0%
- By 2100
- 61,012 · -24.2%
Race, ethnicity, and origin ACS 2023
- Neighborhood character
- Predominantly White (79%)
- Race & ethnicity
- White 79% Hispanic / Latino 16% Two or more races 9% Black 2%
- Hispanic origin (detail)
- Mexican 14%
- Common ancestry
- Slovak 3% Serbian 2% Romanian 1%
- Foreign-born
- 5% · Canada, Vietnam
- Languages at home
- 91% English-only · Spanish 8% Other Indo-European 1%
Political lean MEDSL · Henderson
- 2024 margin
- Solid R (+63.5) · D 18.0% · R 81.4%
- 2008→2024 swing
- -18.8pp toward R · 2008: -44.6pp · 2024: -63.5pp
- All cycles
- 2024: R+63.5 2020: R+60.2 2016: R+60.0 2012: R+54.8 2008: R+44.6
Not yet ingested
- Civics
- —
Market trends
- HPI YoY
- ▼ -73.16%
- Current HPI
- 192.0837
- Rent YoY
- —
- Metro
- —
- State GDP YoY
- ▲ 3.95%
- F500 in state
- 110
Industry mix (Fortune 500 HQ in TX)
| Industry | F500 HQs | Revenue |
|---|---|---|
| Energy | 16 | $1,198B |
|
||
| Technology | 5 | $198B |
|
||
| Engineering / Construction | 4 | $72B |
|
||
| Energy Services | 3 | $60B |
|
||
| Utilities | 3 | $41B |
|
||
| Healthcare | 2 | $330B |
|
||
Price history
-5.6% since first listed11 events — show timeline
- 2026-04-08 Listed $167,900 GTAR
- 2026-03-12 Price Changed $167,900 GTAR
- 2026-01-22 Price Changed $163,900 GTAR
- 2026-01-08 Price Changed $164,900 GTAR
- 2025-12-31 Price Changed $165,900 GTAR
- 2025-12-09 Price Changed $169,900 GTAR
- 2025-12-03 Price Changed $177,900 GTAR
- 2025-04-04 Sold (Public Records) — Public Records
- 2025-03-06 Sold (Public Records) — Public Records
- 2025-03-06 Sold (Public Records) — Public Records
- 2000-01-22 Sold (Public Records) — Public Records
Property tax history
+3.7%/yrLatest (2025): $2,056 · +1.5% YoY. Source: county tax records.
Cash-flow waterfall
monthlySold comps — $/sqft
last 12 mo · ≤1 miLoading sold comps…