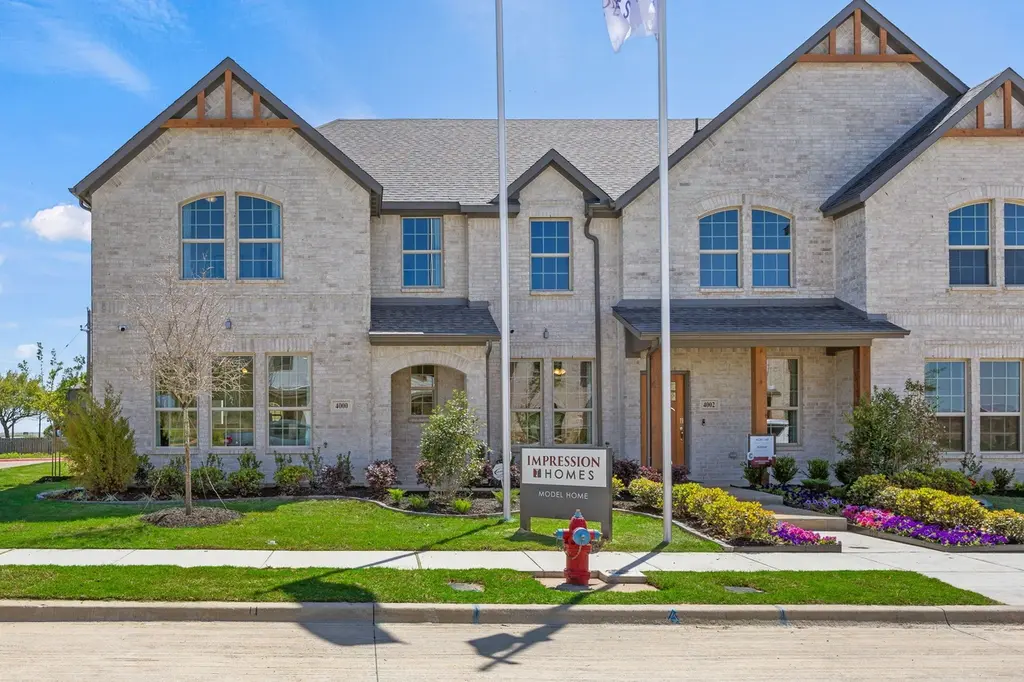
4505 Avion Dr · Sanger, TX
Flood risk No data
- FEMA flood zone
- —
- Chance of flooding over 30 yrs
- —
- Est. flood insurance / yr
- —
Fire risk No data
- Est. fire insurance / yr
- —
Heat risk No data
- Hot days now (above threshold)
- —
- Hot days in 30 yrs
- —
Wind risk No data
- Chance of severe wind over 30 yrs
- —
Air-quality risk No data
- Unhealthy air days now
- —
- Unhealthy air days in 30 yrs
- —
Risk factors via First Street. Map © Google.
Why this score? — see what drove the D+ grade
The composite is a weighted blend of 9 inputs, each scored 0–100. Each bar is that input's sub-score; the figure is the points it added to the 100-point composite (weight × sub-score).
- Cash flow +16.7/30.0
- ARV discount +11.7/15.0
- DSCR +5.2/10.0
- Schools +3.8/10.0
- 1% rule +3.3/10.0
- Livability +3.1/5.0
- Rent growth +2.6/5.0
- Condition / age +2.5/5.0
- Appreciation +0.0/10.0
$248,903
🖨 Deal sheet (PDF) 📄 Offer letter ✓ Due diligence
Listing remarks MLS
Experience the perfect combination of space, comfort and functionality in this 3 bedroom, 2.5 bath home with a large owner#8217;s suite and ample walk in closets. Discover your new sanctuary today!
Key facts
- 2 garage spots
- Built 2025
- Listed 419 days
Neighborhood map
What this means for you Summary
Snapshot
- This is a 3-bed/2.0-bath land listed at $249k.
Deal economics
- At list price, monthly cash flow is $153 ($2k/yr) — positive.
- The deal already cash-flows at list — no discount required.
- To meet the 1% rule (rent ≥ 1% of price), the offer needs to be $208k (16.6% below list).
- Recommended offer: $208k (16.6% below list) — sets the bar for 1% rule.
- Cap rate 7.0% vs local median 3.6% in Sanger — top-decile yield for the area; either an underpriced asset or a hidden risk that comps aren't pricing in. Stress-test before assuming the spread holds.
Location & tenants
- Location reads 62/100 on livability (#958 in TX) — a middle-class / working-renter tenant base. Strengths: crime A+, cost of living A+, housing A+; Watch: schools C-, amenities F, commute F.
- Sanger ISD (rural): math 38% / reading 47% proficiency, ranked #281 of 826 in TX (top 34%) — families likely to look elsewhere, expect single-tenant / working-renter base with shorter leases.
- Market conditions: Rents flat; 327 active listings in the ZIP; 10 comparable units currently listed for rent nearby; rentals at typical pace (median 15d on market — plan ~3-4 weeks tenant-placement turnaround); solid renter incomes; 10,531 units permitted in Denton County in 2024 (2,713 in 5+ unit buildings).
Forward outlook
- Local home prices are declining (-3.0%/yr); year-one equity from $2k of loan paydown is wiped out by about $7k of value loss. Plan a longer hold.
- Denton County population projected at +66% by 2050 — long-run rental-demand tailwind backs the buy-and-hold thesis.
Negotiation context
- It's been on market 419 days — a 12% lower offer ($219k) is reasonable based on typical stale-listing flexibility.
Questions for the listing agent
- It's been on market 419 days. Have you received any prior offers? Is the seller open to a 17% concession, seller financing, or rate buy-down credit?
- Why hasn't it sold? Are there any deal-killer items the seller is aware of (foundation, flood, title, zoning, code violations)?
- Is there a deadline driving the sale (1031 exchange, divorce, estate, relocation)? That informs how much negotiation room exists.
- The area grade is low — what's the realistic commute time and amenity access for the typical tenant pool here? Any planned neighborhood developments (good or bad) we should know about?
- What's the average days-on-market for RENTAL listings here right now (not sales)? A rising rental-DOM trend means longer vacancies and softer asking-rent achievability than the comps imply.
- What's the recent tenant-quality profile in this submarket — average credit score on applications, eviction rate, late-payment / NSF rate, and stable-employment percentage? A property-management company in the area should have these aggregated.
- How much new for-sale + rental construction is in the pipeline within 1–3 miles? Heavy new supply typically softens prices + rents 12–24 months out; constrained supply supports both.
Investment metrics
- 1% rule
- 0.83% ✗
- Cap rate
- 7.03%
- Cash-on-cash
- 2.64%
- DSCR
- 1.12
- GRM
- 10.0
CMA / ARV
- ARV (median comp)
- $274,839
- List price
- $248,903
- Delta
- -9.44%
- Verdict
- FAIR
- Comps
- 10 within 1.0 mi
Projected returns pro-forma
-3.0% appreciation · 0.57% rent growth · sell at horizon
- IRR
- -14.6%
- Equity multiple
- 0.49×
- Total profit
- $-35,631
- Equity at exit
- $37,112
- IRR
- -9.9%
- Equity multiple
- 0.45×
- Total profit
- $-38,269
- Equity at exit
- $21,521
Cash invested: $69,693 (down + closing). Projections, not guarantees.
Landlord ↔ Tenant lean methodology
- Overall (STATE)
- 87 Strongly Landlord-Friendly
- State Texas
- 87 Strongly Landlord-Friendly · R+5
- County
- — inherits STATE
- City
- — inherits STATE
ZIP-level market 76266
- Home prices YoY
- -18.2%
- Rents YoY
- 0.6%
- Active inventory
- 327
- Price-to-rent
- 10.0×
Monthly cashflow live
- Estimated rent
- $2,076 high interval (Pro) →
- Mortgage (P&I)
- −$1,305
- Tax from tax record
- −$77 /mo · $929/yr
- Insurance
- −$104
- HOA
- −$0
- Vacancy / Maint / Mgmt
- −$436
- Net cashflow
- $153
Break-even live
Sensitivity live
| Price | -10% $294 | -5% $224 | +0% $153 | +5% $83 | +10% $12 |
|---|---|---|---|---|---|
| Rent | -10% $-11 | -5% $71 | +0% $153 | +5% $235 | +10% $317 |
| Rate | -1.0pp $279 | -0.5pp $217 | base $153 | +0.5pp $89 | +1.0pp $23 |
UW: 25.0% down · 7.5% · 30yr · 1.5% tax · 5.0% vac · 8.0% maint · 8.0% mgmt
Financing live
Cash to close
- Down payment
- $62,226
- Closing costs
- $7,467
- Reserves months
- —
- Total cash needed
- —
Loan-product check · same deal, 3 products live
Conventional
25% down · 7.5% · 30yr
- Down + closing
- —
- Monthly P&I
- —
- Monthly cashflow
- —
- DSCR
- —
- Eligible?
- —
Personal DTI + credit; lowest rate.
DSCR
20% down · 8.5% · 30yr
- Down + closing
- —
- Monthly P&I
- —
- Monthly cashflow
- —
- DSCR
- —
- Eligible?
- —
No personal income docs; deal must DSCR.
Hard money
10% down · 12.0% · 12mo
- Down + closing
- —
- Monthly P&I
- —
- Monthly cashflow
- —
- DSCR
- —
- Eligible?
- —
Short-term bridge; refi at stabilization.
Rent comps 10 comps
| Address | Beds | Baths | Sqft | Rent | $/sqft | DOM | Units | Dist |
|---|---|---|---|---|---|---|---|---|
| 4601 Avion Dr Sanger, TX | 3.0 | 2.5 | 1589 | $1,995 | $1.26 | 12d | 1 | 0.02mi |
| 4001 Avion Dr Sanger, TX | 3.0 | 2.5 | 1866 | $1,995 | $1.07 | 13d | 1 | 0.14mi |
| 4807 Avion Dr Sanger, TX | 3.0 | 2.0 | 1834 | $2,450 | $1.34 | 14d | 1 | 0.26mi |
| 4929 Sanger Circle Dr Sanger, TX | 3.0 | 2.5 | 1481 | $1,795 | $1.21 | 14d | 1 | 0.45mi |
| 5000 Villas Dr Sanger, TX | 3.0 | 2.5 | 1484 | $1,800 | $1.21 | 45d | 1 | 0.48mi |
| 5002 Villas Dr Sanger, TX | 3.0 | 2.5 | 1484 | $1,800 | $1.21 | 45d | 1 | 0.48mi |
| 5018 Villas Dr Sanger, TX | 3.0 | 3.0 | 1485 | $1,945 | $1.31 | 22d | 1 | 0.49mi |
| 909 N 6th St Sanger, TX | 3.0 | 2.0 | 1200 | $1,800 | $1.50 | 14d | 1 | 1.26mi |
| 3119 Belz Rd Unit NA Sanger, TX | 4.0 | 2.0 | 2000 | $3,100 | $1.55 | 0d | 1 | 1.30mi |
| 3024 Lake Side Dr Sanger, TX | 4.0 | 2.0 | 1862 | $2,245 | $1.21 | 9d | 1 | 1.31mi |
Listing history 17 events
-
2026-06-21days on market $248,903 Active 419 DOM
-
2026-06-18days on market $248,903 Active 416 DOM
-
2026-06-17days on market $248,903 Active 415 DOM
-
2026-06-16days on market $248,903 Active 414 DOM
-
2026-06-15days on market $248,903 Active 413 DOM
-
2026-06-13days on market $248,903 Active 411 DOM
-
2026-06-13days on market $248,903 Active 410 DOM
-
2026-06-09days on market $248,903 Active 407 DOM
-
2026-06-08days on market $248,903 Active 406 DOM
-
2026-06-07days on market $248,903 Active 405 DOM
-
2026-06-04days on market $248,903 Active 402 DOM
-
2026-06-03days on market $248,903 Active 401 DOM
-
2026-06-02days on market $248,903 Active 400 DOM
-
2026-06-01days on market $248,903 Active 399 DOM
-
2026-05-31days on market $248,903 Active 398 DOM
-
2026-01-29price $248,903 197-char remark
Show marketing remark (197 chars)
Experience the perfect combination of space, comfort and functionality in this 3 bedroom, 2.5 bath home with a large owner#8217;s suite and ample walk in closets. Discover your new sanctuary today!
-
2025-04-29$303,903 Active 197-char remark
Show marketing remark (197 chars)
Experience the perfect combination of space, comfort and functionality in this 3 bedroom, 2.5 bath home with a large owner#8217;s suite and ample walk in closets. Discover your new sanctuary today!
ⓘ Source: listings_history table (triggers on properties + properties_extension) + one-shot
backfill from property_details.listing_events for pre-trigger history.
Tax reassessment forecast TX · Resets to sale price
- Current annual tax
- $929 · $77/mo
- Projected year-2 tax
- $4,555 · $380/mo
- Expected delta
- +$3,626/yr (+$302/mo · 390.4%)
ⓘ Screening estimate from a state-policy table — verify with the county assessor before closing.
Nearby sold comps map
Loading sold comps map…
Walkable amenities ~0.75 mi
Loading nearby amenities…
Taxation est. · year 1
- Rental income
- $24,908
- − Mortgage interest
- −$13,942
- − Property taxes
- −$929
- − Insurance
- −$1,245
- − Repairs & maintenance
- −$1,993
- − Management
- −$1,993
- − Depreciation
- −$7,241
- Taxable loss
- −$2,434
- Est. tax savings @ 24.0%
- +$584
- After-tax cash flow
- $2,425/yr
For passive investors: Depreciation is non-cash, so a rental often shows a tax loss while cash-flowing — sheltering income. Rental losses are passive: they offset passive income freely, and up to $25,000/yr can offset ordinary (W-2) income if you actively participate and your MAGI is under $100k (phasing out to $0 by $150k); unused losses carry forward. On sale, claimed depreciation is recaptured at up to 25%, and gains may owe capital-gains tax (a 1031 exchange can defer both). Figures are a year-1 estimate at your 24.0% rate — not tax advice; consult a CPA.
Schools (NCES district)
- District
- Sanger ISD
- NCES district ID
- 4839180
- Math proficiency
- 38% ▼ -13.00%
- Reading proficiency
- 47% ▼ -2.00%
- Median HH income
- $62,803
- Composite
- 37.76/100
- National rank
- #4349
- State rank
- #281 of 826 in TX
Livability — Sanger
- Score
- 62/100
- State rank
- #958
- US rank
- #16973
Category grades
Schools grade is shown separately in the Schools card above.
Census & demographics
- Census place
- Sanger, TX
- County
- Denton County · 901,654 people
- City population
- 18,155
- Metro
- Dallas-Fort Worth-Arlington, TX
- Population (ZIP)
- 18,155
- Household income
- $99,425
- Rent vs Own
- Severe rent burden
- 325.0
Population outlook (Denton County) Hauer SSP2
- Today (2025)
- 1,053,010 people
- By 2030
- 1,192,269 · +13.2%
- By 2040
- 1,472,920 · +39.9%
- By 2050
- 1,746,506 · +65.9%
- By 2075
- 2,358,497 · +124.0%
- By 2100
- 2,779,183 · +163.9%
Race, ethnicity, and origin ACS 2023
- Neighborhood character
- Predominantly White (74%)
- Race & ethnicity
- White 74% Hispanic / Latino 18% Two or more races 10% Black 5% Asian 1%
- Hispanic origin (detail)
- Mexican 15%
- Common ancestry
- Italian 4% Iranian 2% Lithuanian 2%
- Foreign-born
- 8% · Canada
- Languages at home
- 86% English-only · Spanish 11% Other Indo-European 1% Russian/Polish/Slavic 1%
Political lean MEDSL · Denton
- 2024 margin
- R (+13.2) · D 42.7% · R 55.8% · Other 1.5%
- 2008→2024 swing
- +11.0pp toward D · 2008: -24.2pp · 2024: -13.2pp
- All cycles
- 2024: R+13.2 2020: R+8.1 2016: R+20.2 2012: R+31.7 2008: R+24.2
Not yet ingested
- Civics
- —
Market trends
- HPI YoY
- ▼ -63.07%
- Current HPI
- 284.2146
- Rent YoY
- ▲ 0.57%
- Metro
- Dallas-Fort Worth-Arlington, TX
- State GDP YoY
- ▲ 3.95%
- F500 in state
- 110
Industry mix (Fortune 500 HQ in TX)
| Industry | F500 HQs | Revenue |
|---|---|---|
| Energy | 16 | $1,198B |
|
||
| Technology | 5 | $198B |
|
||
| Engineering / Construction | 4 | $72B |
|
||
| Energy Services | 3 | $60B |
|
||
| Utilities | 3 | $41B |
|
||
| Healthcare | 2 | $330B |
|
||
Price history
-18.1% since first listed2 events — show timeline
- 2026-01-29 Price Changed $248,903 Zillow
- 2025-04-29 Listed $303,903 Zillow
Property tax history
-27.1%/yrLatest (2025): $929 · -12.0% YoY. Source: county tax records.
Cash-flow waterfall
monthlySold comps — $/sqft
last 12 mo · ≤1 miLoading sold comps…