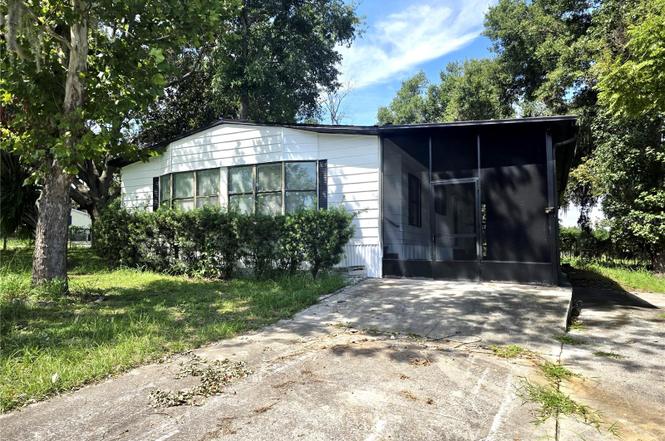
16909 Bay Ave · Montverde, FL
Flood risk 1/10 · Minimal
- FEMA flood zone
- X (unshaded)
- Chance of flooding over 30 yrs
- 0.0%
- Est. flood insurance / yr
- $507 – $1,088
Fire risk 3/10 · Minor
- Est. fire insurance / yr
- $947 – $1,759
Heat risk 9/10 · Severe
- Hot days now (above 108°F)
- 7 days/yr
- Hot days in 30 yrs
- 25 days/yr
Wind risk 9/10 · Severe
- Chance of severe wind over 30 yrs
- 99.0%
Air-quality risk 1/10 · Minimal
- Unhealthy air days now
- 0 days/yr
- Unhealthy air days in 30 yrs
- 0 days/yr
Risk factors via First Street. Map © Google.
Why this score? — see what drove the B grade
The composite is a weighted blend of 9 inputs, each scored 0–100. Each bar is that input's sub-score; the figure is the points it added to the 100-point composite (weight × sub-score).
- Cash flow +30.0/30.0
- DSCR +10.0/10.0
- 1% rule +9.8/10.0
- ARV discount +7.5/15.0
- Schools +4.2/10.0
- Livability +3.3/5.0
- Rent growth +2.5/5.0
- Condition / age +2.5/5.0
- Appreciation +2.3/10.0
$215,000
🖨 Deal sheet 📄 Offer letter ✓ Due diligence
Listing remarks
Welcome to your peaceful retreat in the highly sought-after town of Montverde! This beautifully remodeled 2-bedroom, 2-bathroom manufactured home is perfectly situated on a corner lot, offering comfort, style, and functionality. Step inside to discover an open-concept floor plan featuring a brand-new modern kitchen with quartz countertops, perfect for enjoying everyday living in a bright and integrated space. The updated finishes and refreshed flooring create a fresh, contemporary feel throughout. The spacious primary bedroom includes an en-suite bathroom, while the second bedroom and additional full bathroom provide comfort and privacy for family or guests. Outside, you’ll find a lar
Key facts
- Quartz countertops
- Modern kitchen
- Corner lot
Tags
Property features AI
Finance
- Other: Lot approximately 0.19 acres (about 0 to less than 1/4 acre); Paved/asphalt roads; Direction faces east
- Financial info: No CDD; Not homesteaded
- HOA & community: Pets allowed
Exterior
- Parking: Asphalt/paved road access
- Utilities: Public water available and connected; Public sewer; Electricity available and connected
- Home design: Manufactured home (double wide); One story; East-facing
- Construction: Vinyl siding; Shingle roof; Pillar/post/pier foundation; Built as double wide manufactured home
- Exterior features: Covered porch; Private mailbox; Storage; Fenced (other)
Interior
- Kitchen: Microwave; Range; Refrigerator
- Bedrooms: 2 bedrooms
- Flooring: Laminate
- Bathrooms: 2 full bathrooms
- Heating & cooling: Central heating; Central air conditioning
- Interior features: Ceiling fans; Living room and dining room combo; Thermostat
- Laundry & utility: Inside laundry room
Neighborhood map
What this means for you Summary
Snapshot
- This is a 2-bed/2.0-bath manufactured listed at $215k.
Deal economics
- At list price, monthly cash flow is $1k ($15k/yr) — positive.
- The deal already cash-flows at list — no discount required.
- Meets the 1% rule at list price ($3k rent vs $215k).
- Recommended offer: $189k (12.0% below list) — sets the bar for market timing.
- Cap rate 13.1% vs local median 2.2% in Montverde — top-decile yield for the area; either an underpriced asset or a hidden risk that comps aren't pricing in. Stress-test before assuming the spread holds.
Location & tenants
- Location reads 66/100 on livability (#598 in FL) — a middle-class / working-renter tenant base. Strengths: crime A+, employment A+, housing A+; Watch: cost of living D, amenities F, commute F.
- Lake (suburban): math 49% / reading 50% proficiency, ranked #37 of 73 in FL (top 51%) — families likely to look elsewhere, expect single-tenant / working-renter base with shorter leases.
- Market conditions: 199 active listings in the ZIP; 2 comparable units currently listed for rent nearby; solid renter incomes; 4,799 units permitted in Lake County in 2024 (814 in 5+ unit buildings).
- This rent runs 35% of the median local income ($108k/yr) — at the standard rent-burdened threshold; future hikes will face affordability resistance.
Forward outlook
- Local home prices are declining (-3.0%/yr); year-one equity from $1k of loan paydown is wiped out by about $6k of value loss. Plan a longer hold.
- Lake County population projected at +37% by 2050 — long-run rental-demand tailwind backs the buy-and-hold thesis.
- At projected returns (-3.0% appreciation + 3.0% rent growth), your $60k cash investment doubles in ~6 years — after that, you're playing with house money.
Negotiation context
- It's been on market 215 days — a 12% lower offer ($189k) is reasonable based on typical stale-listing flexibility.
- 2 sale attempts with the ask held roughly flat each time — persistent listings suggest the price (not the market) is what's stuck; bring a comps-based counter.
- Current owner paid $125k; list at $215k implies a 72% gain — meaningful room to come down on a strong offer.
Risks & watch-outs
- Climate carrying-cost: severe wind risk, 99% chance of damaging wind over 30y; extreme-heat days projected 7→25/yr by 2055 (HVAC capex compounding) — expect insurance premiums to compound above CPI over the hold.
Questions for the listing agent
- It's been on market 215 days. Have you received any prior offers? Is the seller open to a 12% concession, seller financing, or rate buy-down credit?
- Why hasn't it sold? Are there any deal-killer items the seller is aware of (foundation, flood, title, zoning, code violations)?
- Is there a deadline driving the sale (1031 exchange, divorce, estate, relocation)? That informs how much negotiation room exists.
- What's the average days-on-market for RENTAL listings here right now (not sales)? A rising rental-DOM trend means longer vacancies and softer asking-rent achievability than the comps imply.
- What's the recent tenant-quality profile in this submarket — average credit score on applications, eviction rate, late-payment / NSF rate, and stable-employment percentage? A property-management company in the area should have these aggregated.
- How much new for-sale + rental construction is in the pipeline within 1–3 miles? Heavy new supply typically softens prices + rents 12–24 months out; constrained supply supports both.
Investment metrics
- 1% rule
- 1.48% ✓
- Cap rate
- 13.05%
- Cash-on-cash
- 24.14%
- DSCR
- 2.07
- GRM
- 5.6
CMA / ARV
- ARV (on-the-fly)
- $70,304
- Comps found
- 1
Show comp detail 1 sale within ~0.75 mi
| Address | Dist | Beds/Ba | Sqft | Sold | Price | $/sf | Match |
|---|---|---|---|---|---|---|---|
| 16919 Sugar Berry Ln | 0.09mi | 3/2.0 (+1) | 1,152 (-15%) | 10mo | $60,000 | $52 | 58 |
Match score weights: distance 35% · size 25% · config 20% · recency 20%. Top-matched comps best support the ARV.
Projected returns pro-forma
-3.0% appreciation · 3.0% rent growth · sell at horizon
- IRR
- 17.4%
- Equity multiple
- 1.70×
- Total profit
- $42,220
- Equity at exit
- $32,057
- IRR
- 25.8%
- Equity multiple
- 3.26×
- Total profit
- $135,808
- Equity at exit
- $18,589
Cash invested: $60,200 (down + closing). Projections, not guarantees.
Landlord ↔ Tenant lean methodology
- Overall (STATE)
- 87 Strongly Landlord-Friendly
- State Florida
- 87 Strongly Landlord-Friendly · R+3
- County
- — inherits STATE
- City
- — inherits STATE
ZIP-level market 34756
- Home prices YoY
- -1.3%
- Active inventory
- 199
- Price-to-rent
- 5.6×
Monthly cashflow live
- Estimated rent
- $3,179 medium interval (Pro) →
- Mortgage (P&I)
- −$1,127
- Tax from tax record
- −$84 /mo · $1,002/yr
- Insurance
- −$90
- HOA
- −$0
- Vacancy / Maint / Mgmt
- −$668
- Net cashflow
- $1,211
Break-even live
UW: 25.0% down · 7.5% · 30yr · 1.5% tax · 5.0% vac · 8.0% maint · 8.0% mgmt
Financing live
Cash to close
- Down payment
- $53,750
- Closing costs
- $6,450
- Reserves months
- —
- Total cash needed
- —
Loan-product check · same deal, 3 products live
Conventional
25% down · 7.5% · 30yr
- Down + closing
- —
- Monthly P&I
- —
- Monthly cashflow
- —
- DSCR
- —
- Eligible?
- —
Personal DTI + credit; lowest rate.
DSCR
20% down · 8.5% · 30yr
- Down + closing
- —
- Monthly P&I
- —
- Monthly cashflow
- —
- DSCR
- —
- Eligible?
- —
No personal income docs; deal must DSCR.
Hard money
10% down · 12.0% · 12mo
- Down + closing
- —
- Monthly P&I
- —
- Monthly cashflow
- —
- DSCR
- —
- Eligible?
- —
Short-term bridge; refi at stabilization.
Rent comps 2 comps
| Address | Beds | Baths | Sqft | Rent | $/sqft | DOM | Units | Dist |
|---|---|---|---|---|---|---|---|---|
| 16300 County Road 455 #401 Montverde, FL | 3.0 | 3.0 | 1568 | $3,750 | $2.39 | 21d | 1 | 0.79mi |
| 17530 County Road 455 Montverde, FL | 3.0 | 2.0 | 1724 | $2,400 | $1.39 | 20d | 1 | 0.92mi |
Listing history 11 events
-
2026-05-02status Pending
-
2026-02-23status Active
-
2026-01-30status Pending
-
2025-12-01price $215,000
-
2025-10-08price $220,000
-
2025-09-04$225,000 Active
-
2025-05-08soldstatus $125,000
-
2002-05-06soldstatus $62,000
-
1998-12-28soldstatus $48,000
-
1998-01-23soldstatus $45,900
-
1988-02-01soldstatus $14,000
ⓘ Source: listings_history table (triggers on properties + properties_extension) + one-shot
backfill from property_details.listing_events for pre-trigger history.
Tax reassessment forecast FL · Resets to sale price
- Current annual tax
- $1,002 · $84/mo
- Projected year-2 tax
- $1,784 · $149/mo
- Expected delta
- +$782/yr (+$65/mo · 78.0%)
ⓘ Screening estimate from a state-policy table — verify with the county assessor before closing.
Climate risk First Street
- Flood 1/10 Low FEMA zone X (unshaded) · 0% chance over 30 yrs
- Wildfire 3/10 Moderate
- Heat 9/10 Extreme 7 d/yr ≥108°F today · 25 d/yr by 30 yrs out
- Wind 9/10 Extreme 99% chance of damaging wind over 30 yrs
- Air quality 1/10 Low 0 unhealthy d/yr today · 0 by 30 yrs out
Nearby sold comps map
Loading sold comps map…
Walkable amenities ~0.75 mi
Loading nearby amenities…
Taxation est. · year 1
- Rental income
- $38,150
- − Mortgage interest
- −$12,043
- − Property taxes
- −$1,002
- − Insurance
- −$1,075
- − Repairs & maintenance
- −$3,052
- − Management
- −$3,052
- − Depreciation
- −$6,255
- Taxable income
- $11,671
- Est. tax owed @ 24.0%
- −$2,801
- After-tax cash flow
- $11,730/yr
For passive investors: Depreciation is non-cash, so a rental often shows a tax loss while cash-flowing — sheltering income. Rental losses are passive: they offset passive income freely, and up to $25,000/yr can offset ordinary (W-2) income if you actively participate and your MAGI is under $100k (phasing out to $0 by $150k); unused losses carry forward. On sale, claimed depreciation is recaptured at up to 25%, and gains may owe capital-gains tax (a 1031 exchange can defer both). Figures are a year-1 estimate at your 24.0% rate — not tax advice; consult a CPA.
Schools (NCES district)
- District
- Lake
- NCES district ID
- 1201050
- Math proficiency
- 49% ▼ -7.00%
- Reading proficiency
- 50% ▼ -4.00%
- Median HH income
- $46,632
- Composite
- 42.05/100
- National rank
- #3327
- State rank
- #37 of 73 in FL
Livability — Montverde
- Score
- 66/100
- State rank
- #598
- US rank
- #11453
Category grades
Schools grade is shown separately in the Schools card above.
Census & demographics
- County
- Lake County · 364,602 people
- City population
- 4,876
- Metro
- Orlando-Kissimmee-Sanford, FL
- Population (ZIP)
- 4,876
- Household income
- $108,500
- Rent vs Own
- Severe rent burden
- 24.0
Population outlook (Lake County) Hauer SSP2
- Today (2025)
- 386,640 people
- By 2030
- 417,107 · +7.9%
- By 2040
- 476,676 · +23.3%
- By 2050
- 531,296 · +37.4%
- By 2075
- 648,303 · +67.7%
- By 2100
- 698,530 · +80.7%
Race, ethnicity, and origin ACS 2023
- Neighborhood character
- Predominantly White (74%)
- Race & ethnicity
- White 74% Hispanic / Latino 17% Two or more races 6% Black 5%
- Hispanic origin (detail)
- Mexican 6% Puerto Rican 4% Cuban 6%
- Common ancestry
- Romanian 4% Italian 2% Lithuanian 1%
- Foreign-born
- 6% · Canada, Mexico, Jamaica
- Languages at home
- 84% English-only · Spanish 14% Arabic 2% Other Indo-European 1%
Political lean MEDSL · Lake
- 2024 margin
- Strong R (+24.7) · D 37.3% · R 62.0%
- 2008→2024 swing
- -11.2pp toward R · 2008: -13.5pp · 2024: -24.7pp
- All cycles
- 2024: R+24.7 2020: R+20.0 2016: R+23.1 2012: R+17.1 2008: R+13.5
Not yet ingested
- Civics
- —
Market trends
- HPI YoY
- ▼ -5.42%
- Current HPI
- 410.9213
- Rent YoY
- —
- Metro
- Orlando-Kissimmee-Sanford, FL
- State GDP YoY
- ▲ 3.28%
- F500 in state
- 36
Industry mix (Fortune 500 HQ in FL)
| Industry | F500 HQs | Revenue |
|---|---|---|
| Industrial Technology | 2 | $29B |
|
||
| Insurance | 2 | $17B |
|
||
| Retail | 1 | $60B |
|
||
| Technology Distribution | 1 | $58B |
|
||
| Homebuilding | 1 | $35B |
|
||
| Technology Manufacturing | 1 | $35B |
|
||
Price history
+1435.7% since first listed11 events — show timeline
- 2026-05-02 Pending — Stellar MLS as Distributed by MLS Grid
- 2026-02-23 Relisted — Stellar MLS as Distributed by MLS Grid
- 2026-01-30 Pending — Stellar MLS as Distributed by MLS Grid
- 2025-12-01 Price Changed $215,000 Stellar MLS as Distributed by MLS Grid
- 2025-10-08 Price Changed $220,000 Stellar MLS as Distributed by MLS Grid
- 2025-09-04 Listed $225,000 Stellar MLS as Distributed by MLS Grid
- 2025-05-08 Sold (Public Records) $125,000 Public Records
- 2002-05-06 Sold (Public Records) $62,000 Public Records
- 1998-12-28 Sold (Public Records) $48,000 Public Records
- 1998-01-23 Sold (Public Records) $45,900 Public Records
- 1988-02-01 Sold (Public Records) $14,000 Public Records
Property tax history
+8.7%/yrLatest (2025): $1,002 · +3.8% YoY. Source: county tax records.
Cash-flow waterfall
monthlySold comps — $/sqft
last 12 mo · ≤1 miLoading sold comps…