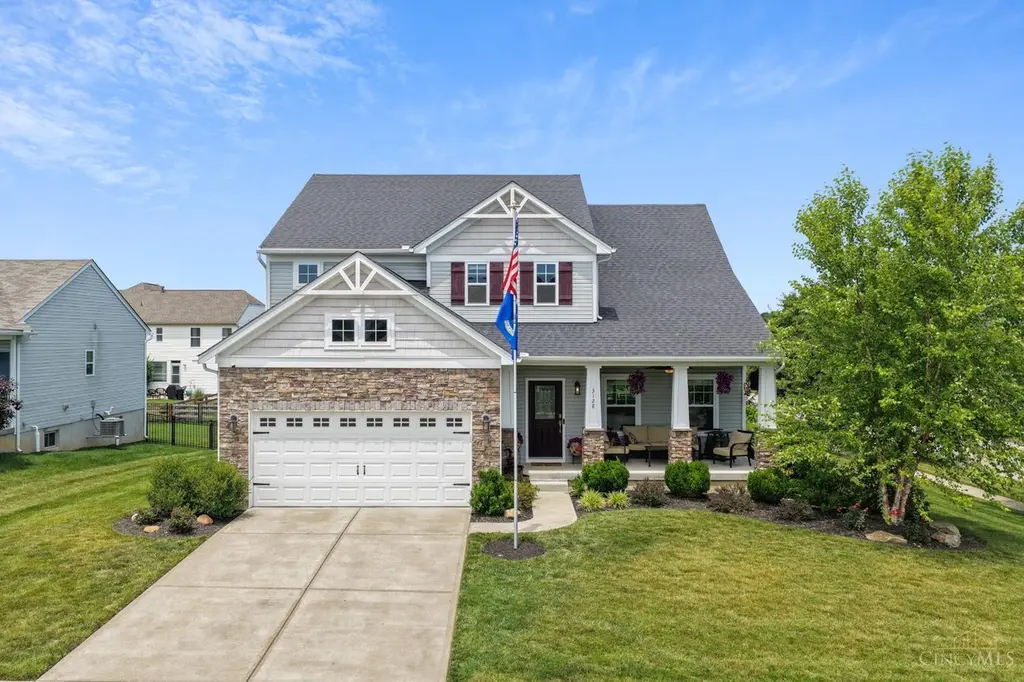
3128 Artisan Way · Morrow, OH
Flood risk 1/10 · Minimal
- FEMA flood zone
- X (unshaded)
- Chance of flooding over 30 yrs
- 0.0%
- Est. flood insurance / yr
- $473 – $860
Fire risk 1/10 · Minimal
- Est. fire insurance / yr
- $713 – $1,323
Heat risk 5/10 · Moderate
- Hot days now (above 101°F)
- 7 days/yr
- Hot days in 30 yrs
- 20 days/yr
Wind risk 2/10 · Minimal
- Chance of severe wind over 30 yrs
- 1.0%
Air-quality risk 4/10 · Minor
- Unhealthy air days now
- 4 days/yr
- Unhealthy air days in 30 yrs
- 6 days/yr
Risk factors via First Street. Map © Google.
Why this score? — see what drove the C grade
The composite is a weighted blend of 9 inputs, each scored 0–100. Each bar is that input's sub-score; the figure is the points it added to the 100-point composite (weight × sub-score).
- Cash flow +27.2/30.0
- DSCR +9.5/10.0
- 1% rule +7.4/10.0
- Schools +6.1/10.0
- Livability +3.8/5.0
- Rent growth +2.5/5.0
- Condition / age +2.5/5.0
- ARV discount +0.0/15.0
- Appreciation +0.0/10.0
$485,000
🖨 Deal sheet (PDF) 📄 Offer letter ✓ Due diligence
Listing remarks MLS
Welcome to this meticulously maintained Potterhill Capstone home featuring 4 bedrooms + loft, 2.5 baths, & over 2,500 sq ft of thoughtfully designed living space. The open floor plan showcases a dramatic two-story great room with a floor-to-ceiling stone gas fireplace, spacious kitchen with stainless steel appliances & island flowing into sunroom filled with natural light. First-floor primary suite offers an adjoining bath & walk-in closet. The unfinished lower level provides an additional 1,300 sq ft with bath rough-in, ready for your personal touch. Enjoy your private, level 0.34-acre lot from the rear deck, custom concrete patio with firepit, or covered front porch. Original owner home with a 2-car garage. Hopewell Valley HOA includes pool, basketball court, playground & walking paths. Conveniently located just minutes from Little Miami HS & JH, shopping, dining, recreation, Little Miami Scenic Trail + more.
Key facts
- 0.34 acre lot
- 2 garage spots
- Community pool
Property features AI
Finance
- Other: Residential zoning
- HOA & community: Homeowners association with a monthly fee of $62; HOA covers landscaping, community play area, pool, and walking trails
Exterior
- Parking: Attached front-entry garage with 2 garage spaces; Driveway parking
- Security: Security system/technology present
- Utilities: Public water; Public sewer; Natural gas service; Electric water heating
- Home design: Transitional-style single-family home; Two levels; Poured foundation; Security smart technology included
- Construction: Stone and vinyl siding exterior; Shingle roof; Built with poured foundation
- Exterior features: Deck; Patio; Porch; Yard on a lot under half an acre (approximately 0.34 acres); Shed on property
Interior
- Kitchen: Pantry; Island; Dishwasher; Microwave; Oven/Range; Refrigerator; Open kitchen/dining layout (kitchen approx. 17 x 13)
- Bedrooms: Primary bedroom on main level (14 x 16); Three additional bedrooms on second level (two are 11 x 12, one is 11 x 11); Total of 4 bedrooms
- Bathrooms: Two full bathrooms; One half bathroom; Primary bathroom includes tub and shower; Main-level full and partial baths available
- Heating & cooling: Gas heating; Central air conditioning
- Interior features: 9-foot (and higher) ceilings; Fireplace in family room (gas); Full basement (unfinished) with bath rough-in; Loft and solarium flexible spaces; Entry with defined foyer
- Laundry & utility: Second-floor laundry room (6 x 5); Sump pump in mechanical systems
Neighborhood map
What this means for you Summary
Snapshot
- This is a 4-bed/2.5-bath single-family listed at $485k.
Deal economics
- At list price, monthly cash flow is $1k ($17k/yr) — positive.
- The deal already cash-flows at list — no discount required.
- Meets the 1% rule at list price ($6k rent vs $485k).
- Cap rate 9.7% vs local median 4.0% in Morrow — top-decile yield for the area; either an underpriced asset or a hidden risk that comps aren't pricing in. Stress-test before assuming the spread holds.
Location & tenants
- Location reads 75/100 on livability (#266 in OH, #4,231 nationally) — a middle-class / working-renter tenant base. Strengths: crime A+, cost of living A+, housing A+; Watch: amenities F, commute F.
- Little Miami Local (rural): math 67% / reading 70% proficiency, ranked #140 of 656 in OH (top 21%) — acceptable for families but not a draw, mixed tenant base, ~2y average lease; only 17% free/reduced lunch — higher-income household profile.
- Zoned schools: Little Miami Primary School (math 76% / reading 65%, grade A-, #376 of 1,584 statewide, top 24%, 855 students, 18% FRL); Little Miami Middle School (math 67% / reading 72%, grade A, #143 of 654 statewide, top 23%, 1,279 students, 16% FRL); Little Miami High School (math 52% / reading 81%, grade B, #150 of 781 statewide, top 20%, 1,445 students, 14% FRL) — zoned schools at 16% FRL track the district average.
- Market conditions: 127 active listings in the ZIP; 1 comparable units currently listed for rent nearby; high-income renter base; 1,224 units permitted in Warren County in 2024 (474 in 5+ unit buildings).
- At $5,995/mo this rent would consume 60% of the median local household income ($120k/yr) — very limited rent-growth headroom before tenants either downsize or default.
Forward outlook
- Local home prices are declining (-3.0%/yr); year-one equity from $3k of loan paydown is wiped out by about $15k of value loss. Plan a longer hold.
- Warren County population projected at +16% by 2050 — long-run rental-demand tailwind backs the buy-and-hold thesis.
- At projected returns (-3.0% appreciation + 3.0% rent growth), your $136k cash investment doubles in ~10 years — after that, you're playing with house money.
Negotiation context
- Only 5 days on market — expect competitive offers; lowballing is unlikely to land.
- 2 sale attempts with the ask held roughly flat each time — persistent listings suggest the price (not the market) is what's stuck; bring a comps-based counter.
- Current owner paid $35k; list at $485k implies a 1286% gain — meaningful room to come down on a strong offer.
Risks & watch-outs
- Climate carrying-cost: extreme-heat days projected 7→20/yr by 2055 (HVAC capex compounding) — expect insurance premiums to compound above CPI over the hold.
Questions for the listing agent
- What does the HOA fee cover, when was the last increase, and are there any pending special assessments or reserve-fund shortfalls?
- Is there a deadline driving the sale (1031 exchange, divorce, estate, relocation)? That informs how much negotiation room exists.
- Schools are B-rated — typically a magnet for longer-tenancy family renters. What's the average tenant stay here, and is there a school-zone premium baked into asking?
- What's the average days-on-market for RENTAL listings here right now (not sales)? A rising rental-DOM trend means longer vacancies and softer asking-rent achievability than the comps imply.
- What's the recent tenant-quality profile in this submarket — average credit score on applications, eviction rate, late-payment / NSF rate, and stable-employment percentage? A property-management company in the area should have these aggregated.
- How much new for-sale + rental construction is in the pipeline within 1–3 miles? Heavy new supply typically softens prices + rents 12–24 months out; constrained supply supports both.
Investment metrics
- 1% rule
- 1.24% ✓
- Cap rate
- 9.73%
- Cash-on-cash
- 12.27%
- DSCR
- 1.55
- GRM
- 6.7
CMA / ARV
- ARV (on-the-fly)
- $400,640
- Comps found
- 12
Show comp detail 12 sales within ~0.75 mi
| Address | Dist | Beds/Ba | Sqft | Sold | Price | $/sf | Match |
|---|---|---|---|---|---|---|---|
| 4993 Lakeview Dr | 0.29mi | 4/2.5 | 2,429 (-3%) | 4mo | $369,770 | $152 | 78 |
| 5441 Hopewell Valley Dr | 0.33mi | 4/2.5 | 2,632 (+5%) | 1mo | $444,000 | $169 | 75 |
| 5029 Lakeview Dr | 0.23mi | 4/2.5 | 2,429 (-3%) | 14mo | $365,000 | $150 | 73 |
| 5487 Hopewell Valley Dr | 0.36mi | 4/2.5 | 2,491 (-0%) | 16mo | $481,000 | $193 | 70 |
| 5341 Valley View Dr | 0.33mi | 4/2.5 | 2,616 (+4%) | 12mo | $467,250 | $179 | 67 |
| 5335 Valley View Dr | 0.32mi | 4/2.5 | 2,414 (-4%) | 15mo | $429,900 | $178 | 66 |
| 4980 Lakeview Dr | 0.33mi | 4/2.5 | 2,188 (-13%) | 5mo | $349,000 | $160 | 60 |
| 2854 Alysheba Ct | 0.62mi | 3/3.0 (-1) | 2,560 (+2%) | 2mo | $420,000 | $164 | 58 |
| 5521 Appaloosa Cir | 0.62mi | 4/2.5 | 2,352 (-6%) | 5mo | $373,000 | $159 | 57 |
| 120 Pamela Dr | 0.60mi | 4/2.0 | 2,376 (-5%) | 11mo | $269,000 | $113 | 53 |
| 2800 Aristides Ct | 0.68mi | 4/3.5 | 2,501 (-0%) | 16mo | $400,000 | $160 | 51 |
| 5185 Appaloosa Cir | 0.70mi | 3/3.5 (-1) | 2,825 (+13%) | 10mo | $380,000 | $135 | 28 |
Match score weights: distance 35% · size 25% · config 20% · recency 20%. Top-matched comps best support the ARV.
Projected returns pro-forma
-3.0% appreciation · 3.0% rent growth · sell at horizon
- IRR
- 1.9%
- Equity multiple
- 1.07×
- Total profit
- $9,910
- Equity at exit
- $72,315
- IRR
- 11.5%
- Equity multiple
- 1.90×
- Total profit
- $122,832
- Equity at exit
- $41,934
Cash invested: $135,800 (down + closing). Projections, not guarantees.
Landlord ↔ Tenant lean methodology
- Overall (STATE)
- 73 Landlord-Friendly
- State Ohio
- 73 Landlord-Friendly · R+6
- County
- — inherits STATE
- City
- — inherits STATE
ZIP-level market 45152
- Home prices YoY
- -31.1%
- Active inventory
- 127
- Price-to-rent
- 6.7×
Monthly cashflow live
- Estimated rent
- $5,995 medium interval (Pro) →
- Mortgage (P&I)
- −$2,543
- Tax from tax record
- −$540 /mo · $6,485/yr
- Insurance
- −$202
- HOA
- −$62
- Vacancy / Maint / Mgmt
- −$1,259
- Net cashflow
- $1,388
Break-even live
Sensitivity live
| Price | -10% $1,663 | -5% $1,525 | +0% $1,388 | +5% $1,251 | +10% $1,114 |
|---|---|---|---|---|---|
| Rent | -10% $915 | -5% $1,151 | +0% $1,388 | +5% $1,625 | +10% $1,862 |
| Rate | -1.0pp $1,632 | -0.5pp $1,512 | base $1,388 | +0.5pp $1,262 | +1.0pp $1,135 |
UW: 25.0% down · 7.5% · 30yr · 1.5% tax · 5.0% vac · 8.0% maint · 8.0% mgmt
Financing live
Cash to close
- Down payment
- $121,250
- Closing costs
- $14,550
- Reserves months
- —
- Total cash needed
- —
Loan-product check · same deal, 3 products live
Conventional
25% down · 7.5% · 30yr
- Down + closing
- —
- Monthly P&I
- —
- Monthly cashflow
- —
- DSCR
- —
- Eligible?
- —
Personal DTI + credit; lowest rate.
DSCR
20% down · 8.5% · 30yr
- Down + closing
- —
- Monthly P&I
- —
- Monthly cashflow
- —
- DSCR
- —
- Eligible?
- —
No personal income docs; deal must DSCR.
Hard money
10% down · 12.0% · 12mo
- Down + closing
- —
- Monthly P&I
- —
- Monthly cashflow
- —
- DSCR
- —
- Eligible?
- —
Short-term bridge; refi at stabilization.
Rent comps 1 comps
| Address | Beds | Baths | Sqft | Rent | $/sqft | DOM | Units | Dist |
|---|---|---|---|---|---|---|---|---|
| 5738 Azra Ct Morrow, OH | 4.0 | 2.5 | 2600 | $5,995 | $2.31 | 45d | 1 | 0.82mi |
HOA detail
- Monthly dues
- $62 · $744/yr
- Likely covers
- gaspool
Listing history 4 events
-
2026-06-21days on market $485,000 Active 5 DOM
-
2026-06-18days on market $485,000 Active 2 DOM
-
2026-06-17remarks 687-char remark
-
2026-06-17$485,000 Active 1 DOM
ⓘ Source: listings_history table (triggers on properties + properties_extension) + one-shot
backfill from property_details.listing_events for pre-trigger history.
Tax reassessment forecast OH · Partial reset (capped growth)
- Current annual tax
- $6,485 · $540/mo
- Projected year-2 tax
- $7,026 · $585/mo
- Expected delta
- +$540/yr (+$45/mo · 8.3%)
ⓘ Screening estimate from a state-policy table — verify with the county assessor before closing.
Climate risk First Street
- Flood 1/10 Low FEMA zone X (unshaded) · 0% chance over 30 yrs
- Wildfire 1/10 Low
- Heat 5/10 Major 7 d/yr ≥101°F today · 20 d/yr by 30 yrs out
- Wind 2/10 Low 100% chance of damaging wind over 30 yrs
- Air quality 4/10 Moderate 4 unhealthy d/yr today · 6 by 30 yrs out
Nearby sold comps map
Loading sold comps map…
Walkable amenities ~0.75 mi
Loading nearby amenities…
Taxation est. · year 1
- Rental income
- $71,940
- − Mortgage interest
- −$27,168
- − Property taxes
- −$6,485
- − Insurance
- −$2,425
- − Repairs & maintenance
- −$5,755
- − Management
- −$5,755
- − HOA
- −$744
- − Depreciation
- −$14,109
- Taxable income
- $9,499
- Est. tax owed @ 24.0%
- −$2,280
- After-tax cash flow
- $14,378/yr
For passive investors: Depreciation is non-cash, so a rental often shows a tax loss while cash-flowing — sheltering income. Rental losses are passive: they offset passive income freely, and up to $25,000/yr can offset ordinary (W-2) income if you actively participate and your MAGI is under $100k (phasing out to $0 by $150k); unused losses carry forward. On sale, claimed depreciation is recaptured at up to 25%, and gains may owe capital-gains tax (a 1031 exchange can defer both). Figures are a year-1 estimate at your 24.0% rate — not tax advice; consult a CPA.
Schools (NCES district)
- District
- Little Miami Local
- NCES district ID
- 3905044
- Math proficiency
- 67% ▼ -11.00%
- Reading proficiency
- 70% ▼ -6.00%
- Median HH income
- $74,949
- Composite
- 60.5/100
- National rank
- #844
- State rank
- #140 of 656 in OH
Livability — Morrow
- Score
- 75/100
- State rank
- #266
- US rank
- #4231
Category grades
Schools grade is shown separately in the Schools card above.
Census & demographics
- County
- Warren · 227,646 people
- Metro
- Cincinnati, OH-KY-IN
- Population (ZIP)
- 13,577
- Household income
- $120,340
- Rent vs Own
- Severe rent burden
- 5.6
Population outlook (Warren County) Hauer SSP2
- Today (2025)
- 248,603 people
- By 2030
- 259,345 · +4.3%
- By 2040
- 277,666 · +11.7%
- By 2050
- 289,599 · +16.5%
- By 2075
- 311,681 · +25.4%
- By 2100
- 302,738 · +21.8%
Race, ethnicity, and origin ACS 2023
- Neighborhood character
- Predominantly White (91%)
- Race & ethnicity
- White 91% Hispanic / Latino 4% Two or more races 3% Black 2% Asian 2%
- Common ancestry
- Romanian 7% Italian 3% Lithuanian 2%
- Foreign-born
- 3% · Canada, South Korea
- Languages at home
- 96% English-only · Spanish 2% Chinese 1%
Political lean MEDSL · Warren
- 2024 margin
- Solid R (+31.5) · D 33.8% · R 65.3%
- 2008→2024 swing
- +4.5pp toward D · 2008: -36.1pp · 2024: -31.5pp
- All cycles
- 2024: R+31.5 2020: R+30.8 2016: R+37.6 2012: R+39.5 2008: R+36.1
Not yet ingested
- Civics
- —
Market trends
- HPI YoY
- ▼ -108.41%
- Current HPI
- 239.7828
- Rent YoY
- —
- Metro
- —
- State GDP YoY
- ▲ 1.98%
- F500 in state
- 48
Industry mix (Fortune 500 HQ in OH)
| Industry | F500 HQs | Revenue |
|---|---|---|
| Insurance | 3 | $145B |
|
||
| Industrial Machinery | 3 | $49B |
|
||
| Financial Services | 3 | $24B |
|
||
| Consumer Goods | 2 | $93B |
|
||
| Aerospace / Defense | 2 | $47B |
|
||
| Utilities | 2 | $33B |
|
||
Price history
+1285.7% since first listed3 events — show timeline
- 2026-06-17 Listed $485,000 Cincy MLS
- 2026-06-15 Listed $485,000 Dayton MLS
- 2017-01-10 Sold (Public Records) $35,000 Public Records
Property tax history
+30.6%/yrLatest (2025): $6,485 · -0.0% YoY. Source: county tax records.
Cash-flow waterfall
monthlySold comps — $/sqft
last 12 mo · ≤1 miLoading sold comps…