600 Lot 553 Ermine Rd · Oak Grove, SC
Flood risk No data
- FEMA flood zone
- —
- Chance of flooding over 30 yrs
- —
- Est. flood insurance / yr
- —
Fire risk No data
- Est. fire insurance / yr
- —
Heat risk No data
- Hot days now (above threshold)
- —
- Hot days in 30 yrs
- —
Wind risk No data
- Chance of severe wind over 30 yrs
- —
Air-quality risk No data
- Unhealthy air days now
- —
- Unhealthy air days in 30 yrs
- —
Risk factors via First Street. Map © Google.
Why this score? — see what drove the B grade
The composite is a weighted blend of 9 inputs, each scored 0–100. Each bar is that input's sub-score; the figure is the points it added to the 100-point composite (weight × sub-score).
- Cash flow +30.0/30.0
- 1% rule +10.0/10.0
- DSCR +10.0/10.0
- ARV discount +7.5/15.0
- Condition / age +4.0/5.0
- Rent growth +3.6/5.0
- Livability +3.3/5.0
- Schools +2.9/10.0
- Appreciation +0.0/10.0
$85,000
🖨 Deal sheet (PDF) 📄 Offer letter ✓ Due diligence
Listing remarks
Available for Sale or Rent-to-Own. Property is currently occupied and pending turnover. Interested buyers and Rent-to-Own applicants may apply now. Possession will be available once the property has been vacated. Contact Agent for more details!
Key facts
- 5 parking spots
- Built 1998
- Listed 24 days
Property features AI
Finance
- Financial info: Land lease $495 per month; Offered for sale
- HOA & community: Association fee charged monthly
Exterior
- Parking: Driveway; 5 parking spaces
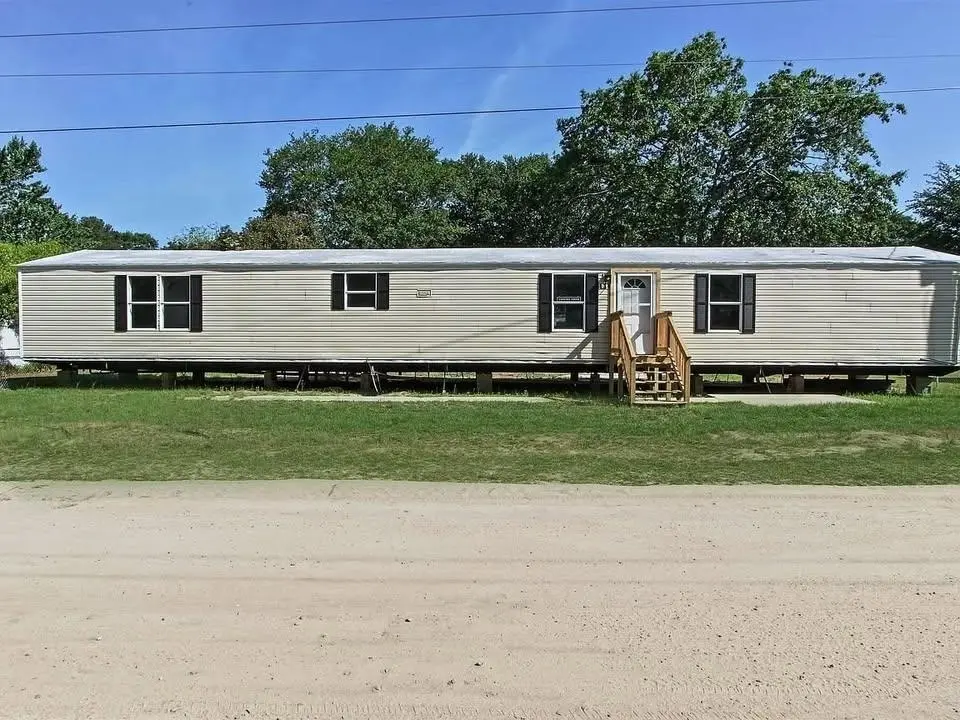
- Home design: Single-wide mobile home; Resale property
- Construction: Has home warranty
- Exterior features: Estimated lot size; Zoned residential; Has land lease (monthly)
Interior
- Bathrooms: 2 full bathrooms
- Interior features: Furnished
Neighborhood map
What this means for you Summary
Snapshot
- This is a 3-bed/2.0-bath single-family listed at $85k. Condition is rated good.
Deal economics
- At list price, monthly cash flow is $799 ($10k/yr) — positive.
- The deal already cash-flows at list — no discount required.
- Meets the 1% rule at list price ($2k rent vs $85k).
- Recommended offer: $84k (1.5% below list) — sets the bar for market timing.
Location & tenants
- Location reads 66/100 on livability (#114 in SC) — a middle-class / working-renter tenant base. Strengths: cost of living A+, housing A+, health & safety B; Watch: crime D, amenities F, commute F.
- Lexington 02 (suburban): math 30% / reading 38% proficiency, ranked #45 of 80 in SC (top 56%) — families likely to look elsewhere, expect single-tenant / working-renter base with shorter leases.
- Zoned schools: Springdale Elementary (math 62% / reading 52%, grade C+, #102 of 597 statewide, top 18%, 389 students, 65% FRL); R. H. Fulmer Middle (math 30% / reading 39%, grade F, #107 of 229 statewide, top 47%, 568 students, 100% FRL); Airport High (math 40% / reading 79%, grade C+, #110 of 196 statewide, top 58%, 1,428 students, 84% FRL) — zoned schools average 83% FRL vs 59% district-wide (25 pts higher); higher-poverty schools than district average — tighter screening recommended.
- Zoned-school proficiency averages 50% at this address vs 34% district-wide (+16 pts) — the actual schools serving this property are materially stronger than the Lexington 02 average implies; a family-tenant draw the district grade alone would hide.
- Market conditions: Rents rising fast (+4.6%/yr); 193 active listings in the ZIP; 4 comparable units currently listed for rent nearby; rentals at typical pace (median 21d on market — plan ~3-4 weeks tenant-placement turnaround); 1,712 units permitted in Lexington County in 2024 (0 in 5+ unit buildings).
Forward outlook
- Local home prices are declining (-3.0%/yr); year-one equity from $588 of loan paydown is wiped out by about $3k of value loss. Plan a longer hold.
- Lexington County population projected at +26% by 2050 — long-run rental-demand tailwind backs the buy-and-hold thesis.
- At projected returns (-3.0% appreciation + 4.6% rent growth), your $24k cash investment doubles in ~3 years — after that, you're playing with house money.
Negotiation context
- It's been on market 24 days — a 2% lower offer ($84k) is reasonable based on typical stale-listing flexibility.
- 3 sale attempts with the ask held roughly flat each time — persistent listings suggest the price (not the market) is what's stuck; bring a comps-based counter.
Questions for the listing agent
- Is there a deadline driving the sale (1031 exchange, divorce, estate, relocation)? That informs how much negotiation room exists.
- Schools are D-rated, which usually means shorter tenancies and higher turnover. Who's the typical renter profile here, and what's been the actual vacancy rate?
- Crime grade is D in this area — have there been break-ins, vandalism, or insurance claims at this property in the last 3 years? What carrier currently insures it and at what premium?
- What's the average days-on-market for RENTAL listings here right now (not sales)? A rising rental-DOM trend means longer vacancies and softer asking-rent achievability than the comps imply.
- What's the recent tenant-quality profile in this submarket — average credit score on applications, eviction rate, late-payment / NSF rate, and stable-employment percentage? A property-management company in the area should have these aggregated.
- How much new for-sale + rental construction is in the pipeline within 1–3 miles? Heavy new supply typically softens prices + rents 12–24 months out; constrained supply supports both.
Investment metrics
- 1% rule
- 2.07% ✓
- Cap rate
- 17.58%
- Cash-on-cash
- 40.31%
- DSCR
- 2.79
- GRM
- 4.0
CMA / ARV
No comps found within radius.
Projected returns pro-forma
-3.0% appreciation · 4.57% rent growth · sell at horizon
- IRR
- 38.5%
- Equity multiple
- 2.68×
- Total profit
- $39,983
- Equity at exit
- $12,674
- IRR
- 45.7%
- Equity multiple
- 5.72×
- Total profit
- $112,417
- Equity at exit
- $7,349
Cash invested: $23,800 (down + closing). Projections, not guarantees.
Landlord ↔ Tenant lean methodology
- Overall (STATE)
- 90 Strongly Landlord-Friendly
- State South Carolina
- 90 Strongly Landlord-Friendly · R+6
- County
- — inherits STATE
- City
- — inherits STATE
ZIP-level market 29170
- Home prices YoY
- -16.9%
- Rents YoY
- 4.6%
- Active inventory
- 193
- Price-to-rent
- 4.0×
Monthly cashflow live
- Estimated rent
- $1,755 medium interval (Pro) →
- Mortgage (P&I)
- −$446
- Tax est. 1.5%
- −$106 /mo · $1,275/yr
- Insurance
- −$35
- HOA
- −$0
- Vacancy / Maint / Mgmt
- −$369
- Net cashflow
- $799
Break-even live
Sensitivity live
| Price | -10% $858 | -5% $829 | +0% $799 | +5% $770 | +10% $741 |
|---|---|---|---|---|---|
| Rent | -10% $661 | -5% $730 | +0% $799 | +5% $869 | +10% $938 |
| Rate | -1.0pp $842 | -0.5pp $821 | base $799 | +0.5pp $777 | +1.0pp $755 |
UW: 25.0% down · 7.5% · 30yr · 1.5% tax · 5.0% vac · 8.0% maint · 8.0% mgmt
Financing live
Cash to close
- Down payment
- $21,250
- Closing costs
- $2,550
- Reserves months
- —
- Total cash needed
- —
Loan-product check · same deal, 3 products live
Conventional
25% down · 7.5% · 30yr
- Down + closing
- —
- Monthly P&I
- —
- Monthly cashflow
- —
- DSCR
- —
- Eligible?
- —
Personal DTI + credit; lowest rate.
DSCR
20% down · 8.5% · 30yr
- Down + closing
- —
- Monthly P&I
- —
- Monthly cashflow
- —
- DSCR
- —
- Eligible?
- —
No personal income docs; deal must DSCR.
Hard money
10% down · 12.0% · 12mo
- Down + closing
- —
- Monthly P&I
- —
- Monthly cashflow
- —
- DSCR
- —
- Eligible?
- —
Short-term bridge; refi at stabilization.
Rent comps 4 comps
| Address | Beds | Baths | Sqft | Rent | $/sqft | DOM | Units | Dist |
|---|---|---|---|---|---|---|---|---|
| 600 Ermine Rd Lot 620 West Columbia, SC | 4.0 | 2.0 | 1216 | $1,875 | $1.54 | 21d | 1 | 0.14mi |
| 536 Idlewood Park Dr West Columbia, SC | 2.0 | 2.5 | 1100 | $1,395 | $1.27 | 25d | 1 | 0.49mi |
| 200 # W Unit Woodberry Rd unit West Columbia, SC | 2.0 | 2.0 | 1000 | $1,300 | $1.30 | 4d | 1 | 0.98mi |
| 105 Landford Ct Lexington, SC | 3.0 | 2.0 | 1260 | $1,450 | $1.15 | 5d | 1 | 1.25mi |
Listing history 21 events
-
2026-06-21days on market $85,000 Active 24 DOM
-
2026-06-18days on market $85,000 Active 21 DOM
-
2026-06-17days on market $85,000 Active 20 DOM
-
2026-06-16days on market $85,000 Active 19 DOM
-
2026-06-15days on market $85,000 Active 18 DOM
-
2026-06-14days on market $85,000 Active 16 DOM
-
2026-06-13days on market $85,000 Active 15 DOM
-
2026-06-10days on market $85,000 Active 13 DOM
-
2026-06-09days on market $85,000 Active 12 DOM
-
2026-06-08days on market $85,000 Active 11 DOM
-
2026-06-07days on market $85,000 Active 10 DOM
-
2026-06-05days on market $85,000 Active 7 DOM
-
2026-06-03days on market $85,000 Active 6 DOM
-
2026-06-03days on market $85,000 Active 5 DOM
-
2026-06-02days on market $85,000 Active 4 DOM
-
2026-05-31days on market $85,000 Active 3 DOM
-
2026-05-28status Active
-
2026-05-28historical
-
2026-05-28$85,000 Active
-
2026-03-09historical
-
2026-02-04$85,000 Active
ⓘ Source: listings_history table (triggers on properties + properties_extension) + one-shot
backfill from property_details.listing_events for pre-trigger history.
Nearby sold comps map
Loading sold comps map…
Walkable amenities ~0.75 mi
Loading nearby amenities…
Taxation est. · year 1
- Rental income
- $21,066
- − Mortgage interest
- −$4,761
- − Property taxes
- −$1,275
- − Insurance
- −$425
- − Repairs & maintenance
- −$1,685
- − Management
- −$1,685
- − Depreciation
- −$2,473
- Taxable income
- $8,761
- Est. tax owed @ 24.0%
- −$2,103
- After-tax cash flow
- $7,490/yr
For passive investors: Depreciation is non-cash, so a rental often shows a tax loss while cash-flowing — sheltering income. Rental losses are passive: they offset passive income freely, and up to $25,000/yr can offset ordinary (W-2) income if you actively participate and your MAGI is under $100k (phasing out to $0 by $150k); unused losses carry forward. On sale, claimed depreciation is recaptured at up to 25%, and gains may owe capital-gains tax (a 1031 exchange can defer both). Figures are a year-1 estimate at your 24.0% rate — not tax advice; consult a CPA.
Condition & rehab AI · 12 photos
This mobile home is in good condition with a good condition score of 80. It is currently occupied and pending turnover, making it a good investment opportunity. The home has a good exterior and interior, with minor maintenance items to address. The highest-ROI updates would be painting the exterior, landscaping improvements, and updating the kitchen and bathroom.
Value-add opportunities
- Both Painting the exterior — Enhances curb appeal and can increase both resale and rental value.
- Both Landscaping improvements — Enhances curb appeal and can increase both resale and rental value.
- Resale New flooring in the kitchen — Modernizes the space and can attract more buyers.
- Resale New kitchen appliances — Modernizes the space and can attract more buyers.
- Resale New bathroom fixtures — Modernizes the space and can attract more buyers.
Renovation cost estimate screening
Value-add ROI direction
- Both Painting the exterior — Enhances curb appeal and can increase both resale and rental value. ↑
- Both Landscaping improvements — Enhances curb appeal and can increase both resale and rental value. ↑
- Resale New flooring in the kitchen — Modernizes the space and can attract more buyers. ↑
- Resale New kitchen appliances — Modernizes the space and can attract more buyers. ↑
- Resale New bathroom fixtures — Modernizes the space and can attract more buyers. ↑
ⓘ Cost ranges are severity-bucket heuristics (US national rule-of-thumb). Get contractor quotes + a written scope before underwriting a rehab budget.
Schools (NCES district)
- District
- Lexington 02
- NCES district ID
- 4502730
- Math proficiency
- 30% ▼ -6.00%
- Reading proficiency
- 38% ▬ 0.00%
- Median HH income
- $42,532
- Composite
- 28.78/100
- National rank
- #6669
- State rank
- #45 of 80 in SC
Livability — Oak Grove
- Score
- 66/100
- State rank
- #114
- US rank
- #11681
Category grades
Schools grade is shown separately in the Schools card above.
Census & demographics
- Census place
- Oak Grove, SC
- County
- Lexington County · 232,571 people
- Metro
- Columbia, SC
- Population (ZIP)
- 21,247
- Household income
- $74,902
- Rent vs Own
- Severe rent burden
- 147.0
Population outlook (Lexington County) Hauer SSP2
- Today (2025)
- 322,999 people
- By 2030
- 342,356 · +6.0%
- By 2040
- 377,715 · +16.9%
- By 2050
- 406,984 · +26.0%
- By 2075
- 465,447 · +44.1%
- By 2100
- 485,674 · +50.4%
Race, ethnicity, and origin ACS 2023
- Neighborhood character
- Predominantly White (66%)
- Race & ethnicity
- White 66% Black 17% Hispanic / Latino 10% Two or more races 8% Asian 3%
- Hispanic origin (detail)
- Mexican 6% Puerto Rican 1%
- Common ancestry
- Serbian 2% Italian 2% Romanian 2%
- Foreign-born
- 9% · Canada, Jamaica, Guatemala
- Languages at home
- 90% English-only · Spanish 7% Other Indo-European 2%
Political lean MEDSL · Lexington
- 2024 margin
- Solid R (+33.5) · D 32.5% · R 66.0% · Other 1.4%
- 2008→2024 swing
- +4.6pp toward D · 2008: -38.0pp · 2024: -33.5pp
- All cycles
- 2024: R+33.5 2020: R+30.1 2016: R+36.7 2012: R+37.8 2008: R+38.0
Not yet ingested
- Civics
- —
Market trends
- HPI YoY
- ▼ -52.72%
- Current HPI
- 259.713
- Rent YoY
- ▲ 4.57%
- Metro
- Columbia, SC
- State GDP YoY
- ▲ 4.51%
- F500 in state
- 2
Industry mix (Fortune 500 HQ in SC)
| Industry | F500 HQs | Revenue |
|---|---|---|
| Packaging | 1 | $7B |
|
||
Price history
+0.0% since first listed5 events — show timeline
- 2026-05-28 Relisted — CCAR
- 2026-05-28 Listed $85,000 CCAR
- 2026-05-28 Listing Removed — CCAR
- 2026-03-09 Listing Removed — CCAR
- 2026-02-04 Listed $85,000 CCAR
Cash-flow waterfall
monthlySold comps — $/sqft
last 12 mo · ≤1 miLoading sold comps…