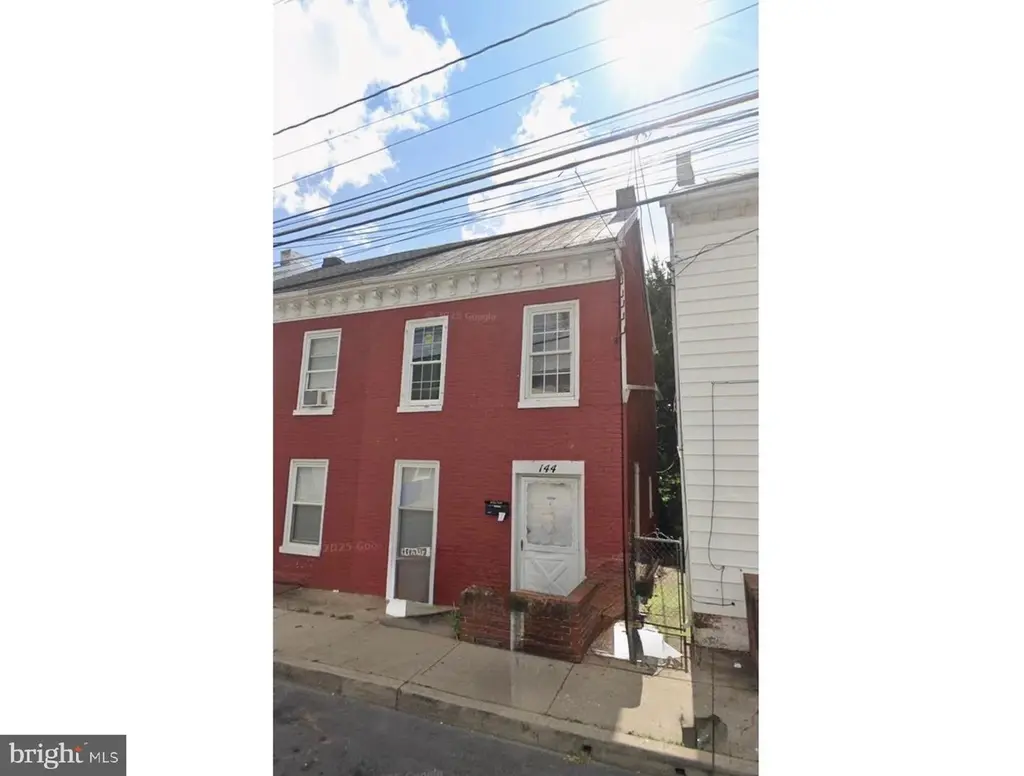
144 S Locust St · Hagerstown, MD
Flood risk 1/10 · Minimal
- FEMA flood zone
- X (unshaded)
- Chance of flooding over 30 yrs
- 0.0%
- Est. flood insurance / yr
- $473 – $860
Fire risk 1/10 · Minimal
- Est. fire insurance / yr
- $755 – $1,403
Heat risk 5/10 · Moderate
- Hot days now (above 101°F)
- 7 days/yr
- Hot days in 30 yrs
- 16 days/yr
Wind risk 2/10 · Minimal
- Chance of severe wind over 30 yrs
- 2.0%
Air-quality risk 2/10 · Minimal
- Unhealthy air days now
- 1 days/yr
- Unhealthy air days in 30 yrs
- 2 days/yr
Risk factors via First Street. Map © Google.
Why this score? — see what drove the C grade
The composite is a weighted blend of 9 inputs, each scored 0–100. Each bar is that input's sub-score; the figure is the points it added to the 100-point composite (weight × sub-score).
- Cash flow +25.7/30.0
- DSCR +8.6/10.0
- ARV discount +7.2/15.0
- 1% rule +5.8/10.0
- Livability +3.9/5.0
- Rent growth +3.5/5.0
- Condition / age +2.5/5.0
- Schools +2.3/10.0
- Appreciation +0.0/10.0
$145,000
🖨 Deal sheet 📄 Offer letter ✓ Due diligence
Key facts
- Built 1888
- Listed 45 days
Property features AI
Finance
- Other: Ownership is fee simple; Above-grade finished area reported as approximately 1,350 (estimated); Below-grade unfinished area reported as 654
Exterior
- Parking: On-street parking; Other parking
- Utilities: Public water; Public sewer
- Home design: Semi-detached property; Located within city limits (Hagerstown)
- Construction: Brick construction; Concrete perimeter foundation
- Exterior features: No tidal water on the lot; Other above- and below-grade structures
Interior
- Bedrooms: Two bedrooms on the second level; One bedroom on the third level
- Bathrooms: One full bathroom (upper levels); One full bathroom on the first upper level; One half bathroom on the main level
- Heating & cooling: Radiator heating; Ceiling fans; Window air conditioning units; Electric heating and cooling fuel; Electric hot water
- Interior features: Basement present (other / partially below grade); Living area reported as estimated
Neighborhood map
What this means for you Summary
Snapshot
- This is a 3-bed/1.5-bath townhouse listed at $145k.
Deal economics
- At list price, monthly cash flow is $346 ($4k/yr) — positive.
- The deal already cash-flows at list — no discount required.
- Meets the 1% rule at list price ($2k rent vs $145k).
- Recommended offer: $141k (3.0% below list) — sets the bar for market timing.
- Cap rate 9.2% vs local median 4.4% in Hagerstown — top-decile yield for the area; either an underpriced asset or a hidden risk that comps aren't pricing in. Stress-test before assuming the spread holds.
Location & tenants
- Location reads 77/100 on livability (#83 in MD, #3,170 nationally) — a middle-class / working-renter tenant base. Strengths: commute A+, cost of living A+, health & safety A+; Watch: schools C-, crime F, employment F.
- Washingtion County Public Schools (suburban): math 18% / reading 33% proficiency, ranked #13 of 24 in MD (top 54%) — low school quality limits family demand, transient renter base, plan for 1-2y turnover.
- Market conditions: Rents rising fast (+4.0%/yr); 368 active listings in the ZIP; 40 comparable units currently listed for rent nearby; rentals lingering (median 44d on market — plan ~5-8 weeks vacancy on turnover, expect pricing pressure); 55% of comp listings sitting > 30 days — soft ceiling on asking rent; 232 units permitted in Washington County in 2024 (12 in 5+ unit buildings).
Forward outlook
- Local home prices are declining (-3.0%/yr); year-one equity from $1k of loan paydown is wiped out by about $4k of value loss. Plan a longer hold.
- At projected returns (-3.0% appreciation + 4.0% rent growth), your $41k cash investment doubles in ~10 years — after that, you're playing with house money.
Negotiation context
- It's been on market 45 days — a 3% lower offer ($141k) is reasonable based on typical stale-listing flexibility.
- 7 sale attempts since 23y ago with the ask held roughly flat each time — persistent listings suggest the price (not the market) is what's stuck; bring a comps-based counter.
- Current owner paid $80k; list at $145k implies a 81% gain — meaningful room to come down on a strong offer.
Risks & watch-outs
- Watch-outs: built in 1888 — expect roof / HVAC / electrical / plumbing capex.
- Climate carrying-cost: extreme-heat days projected 7→16/yr by 2055 (HVAC capex compounding) — expect insurance premiums to compound above CPI over the hold.
Questions for the listing agent
- It's been on market 45 days. Have you received any prior offers? Is the seller open to a 3% concession, seller financing, or rate buy-down credit?
- Built in 1888 — when were the roof, HVAC, electrical panel, plumbing, and water heater last replaced?
- Is there a deadline driving the sale (1031 exchange, divorce, estate, relocation)? That informs how much negotiation room exists.
- Crime grade is F in this area — have there been break-ins, vandalism, or insurance claims at this property in the last 3 years? What carrier currently insures it and at what premium?
- What's the average days-on-market for RENTAL listings here right now (not sales)? A rising rental-DOM trend means longer vacancies and softer asking-rent achievability than the comps imply.
- What's the recent tenant-quality profile in this submarket — average credit score on applications, eviction rate, late-payment / NSF rate, and stable-employment percentage? A property-management company in the area should have these aggregated.
- How much new for-sale + rental construction is in the pipeline within 1–3 miles? Heavy new supply typically softens prices + rents 12–24 months out; constrained supply supports both.
Investment metrics
- 1% rule
- 1.08% ✓
- Cap rate
- 9.16%
- Cash-on-cash
- 10.23%
- DSCR
- 1.46
- GRM
- 7.7
CMA / ARV
- ARV (median comp)
- $144,191
- List price
- $145,000
- Delta
- 0.56%
- Verdict
- FAIR
- Comps
- 20 within 1.0 mi
Show comp detail 12 sales within ~0.75 mi
| Address | Dist | Beds/Ba | Sqft | Sold | Price | $/sf | Match |
|---|---|---|---|---|---|---|---|
| 306 S Mulberry St | 0.20mi | 3/1.0 | 1,310 (+0%) | 6mo | $130,000 | $99 | 83 |
| 112 E Antietam St | 0.10mi | 3/1.5 | 1,392 (+6%) | 6mo | $139,000 | $100 | 79 |
| 137 E Antietam St | 0.11mi | 4/1.0 (+1) | 1,235 (-6%) | 0mo | $165,000 | $134 | 78 |
| 43 S Prospect St #7 | 0.44mi | 2/1.0 (-1) | 1,311 (+0%) | 2mo | $185,000 | $141 | 71 |
| 385 S Cannon Ave | 0.38mi | 3/1.5 | 1,248 (-5%) | 7mo | $270,000 | $216 | 69 |
| 314 E Franklin St | 0.40mi | 2/1.0 (-1) | 1,248 (-5%) | 1mo | $165,000 | $132 | 66 |
| 312 E Franklin St | 0.39mi | 2/1.0 (-1) | 1,248 (-5%) | 4mo | $165,000 | $132 | 64 |
| 410 Summit Ave | 0.48mi | 3/1.0 | 1,360 (+4%) | 6mo | $222,000 | $163 | 64 |
| 227 N Locust St | 0.46mi | 3/1.0 | 1,216 (-7%) | 7mo | $87,400 | $72 | 59 |
| 720 Naples Dr | 0.72mi | 2/2.0 (-1) | 1,288 (-2%) | 3mo | $204,000 | $158 | 54 |
| 337 East Ridge Dr | 0.66mi | 2/1.5 (-1) | 1,176 (-10%) | 1mo | $237,500 | $202 | 47 |
| 725 S Potomac St | 0.65mi | 3/1.5 | 1,504 (+15%) | 3mo | $213,000 | $142 | 42 |
Match score weights: distance 35% · size 25% · config 20% · recency 20%. Top-matched comps best support the ARV.
Projected returns pro-forma
-3.0% appreciation · 4.0% rent growth · sell at horizon
- IRR
- 0.1%
- Equity multiple
- 1.00×
- Total profit
- $101
- Equity at exit
- $21,620
- IRR
- 10.6%
- Equity multiple
- 1.86×
- Total profit
- $34,973
- Equity at exit
- $12,537
Cash invested: $40,600 (down + closing). Projections, not guarantees.
Landlord ↔ Tenant lean methodology
- Overall (STATE)
- 27 Tenant-Leaning
- State Maryland
- 27 Tenant-Leaning · D+14
- County
- — inherits STATE
- City
- — inherits STATE
ZIP-level market 21740
- Rents YoY
- 4.0%
- Active inventory
- 368
- Price-to-rent
- 7.7×
Monthly cashflow live
- Estimated rent
- $1,568 high interval (Pro) →
- Mortgage (P&I)
- −$760
- Tax from tax record
- −$72 /mo · $859/yr
- Insurance
- −$60
- HOA
- −$0
- Vacancy / Maint / Mgmt
- −$329
- Net cashflow
- $346
Break-even live
UW: 25.0% down · 7.5% · 30yr · 1.5% tax · 5.0% vac · 8.0% maint · 8.0% mgmt
Financing live
Cash to close
- Down payment
- $36,250
- Closing costs
- $4,350
- Reserves months
- —
- Total cash needed
- —
Loan-product check · same deal, 3 products live
Conventional
25% down · 7.5% · 30yr
- Down + closing
- —
- Monthly P&I
- —
- Monthly cashflow
- —
- DSCR
- —
- Eligible?
- —
Personal DTI + credit; lowest rate.
DSCR
20% down · 8.5% · 30yr
- Down + closing
- —
- Monthly P&I
- —
- Monthly cashflow
- —
- DSCR
- —
- Eligible?
- —
No personal income docs; deal must DSCR.
Hard money
10% down · 12.0% · 12mo
- Down + closing
- —
- Monthly P&I
- —
- Monthly cashflow
- —
- DSCR
- —
- Eligible?
- —
Short-term bridge; refi at stabilization.
Rent comps 40 comps
| Address | Beds | Baths | Sqft | Rent | $/sqft | DOM | Units | Dist |
|---|---|---|---|---|---|---|---|---|
| 326 S Potomac St #1 Hagerstown, MD | 2.0 | 1.0 | 1050 | $1,400 | $1.33 | 43d | 1 | 0.20mi |
| 326 S Potomac St #2 Hagerstown, MD | 2.0 | 1.0 | 1350 | $1,500 | $1.11 | 43d | 1 | 0.20mi |
| 338 S Locust St Hagerstown, MD | 3.0 | 1.5 | 1320 | $1,600 | $1.21 | 20d | 1 | 0.20mi |
| 103 E Washington St Unit 1E Hagerstown, MD | 3.0 | 1.0 | 1200 | $1,200 | $1.00 | 13d | 1 | 0.22mi |
| 124 Ray St Hagerstown, MD | 3.0 | 1.0 | 960 | $1,500 | $1.56 | 20d | 1 | 0.23mi |
| 50 Rochester Pl Unit 23 Hagerstown, MD | 2.0 | 1.0 | 900 | $1,275 | $1.42 | 43d | 1 | 0.23mi |
| 60 E Washington St Apt 1E Hagerstown, MD | 3.0 | 1.5 | 1300 | $1,500 | $1.15 | 20d | 1 | 0.24mi |
| 313 Frederick St Unit 313 Hagerstown, MD | 3.0 | 1.5 | 1650 | $2,500 | $1.52 | 43d | 1 | 0.31mi |
| 313 Frederick St Hagerstown, MD | 3.0 | 1.5 | 1650 | $2,500 | $1.52 | 43d | 1 | 0.31mi |
| 42 E Franklin St Hagerstown, MD | 3.0 | 1.5 | 1200 | $1,350 | $1.12 | 43d | 1 | 0.35mi |
| 92 W Washington St Unit 403 Hagerstown, MD | 2.0 | 1.5 | 924 | $1,550 | $1.68 | 43d | 1 | 0.38mi |
| 92 W Washington St Unit 410 Hagerstown, MD | 3.0 | 1.5 | 1415 | $1,795 | $1.27 | 43d | 1 | 0.38mi |
| 92 W Washington St Unit 405 Hagerstown, MD | 2.0 | 1.0 | 1083 | $1,650 | $1.52 | 43d | 1 | 0.38mi |
| 115 N Potomac St Unit 2 Hagerstown, MD | 2.0 | 1.0 | 1200 | $1,250 | $1.04 | 20d | 1 | 0.40mi |
| 115 East Ave Unit 2 Hagerstown, MD | 2.0 | 1.0 | 1200 | $1,400 | $1.17 | 43d | 1 | 0.43mi |
| 235 East Ave Hagerstown, MD | 2.0 | 1.0 | 1200 | $1,200 | $1.00 | 13d | 1 | 0.46mi |
| 210 N Locust St Hagerstown, MD | 3.0 | 1.0 | 1476 | $1,275 | $0.86 | 20d | 1 | 0.46mi |
| 207 N Mulberry St Unit 3 Hagerstown, MD | 2.0 | 1.0 | 940 | $1,130 | $1.20 | 20d | 1 | 0.46mi |
| 311 Jefferson St Unit 311 Hagerstown, MD | 3.0 | 1.5 | 1200 | $1,550 | $1.29 | 43d | 1 | 0.54mi |
| 307 N Locust St Hagerstown, MD | 3.0 | 1.0 | 1140 | $1,490 | $1.31 | 43d | 1 | 0.55mi |
| 612 Frederick St Hagerstown, MD | 4.0 | 2.0 | 1422 | $1,875 | $1.32 | 20d | 1 | 0.57mi |
| 27 Bethel St Hagerstown, MD | 2.0 | 1.0 | 954 | $950 | $1.00 | 43d | 1 | 0.57mi |
| 382 S Cleveland Ave Unit 4 Hagerstown, MD | 2.0 | 1.0 | 900 | $1,200 | $1.33 | 13d | 1 | 0.58mi |
| 322 N Cannon Ave Hagerstown, MD | 3.0 | 1.5 | 1488 | $1,800 | $1.21 | 13d | 1 | 0.58mi |
| 323 N Potomac St #1 Hagerstown, MD | 2.0 | 2.0 | 1800 | $1,505 | $0.84 | 20d | 1 | 0.61mi |
| 323 N Potomac St Unit 2 Hagerstown, MD | 2.0 | 1.0 | 1700 | $1,380 | $0.81 | 20d | 1 | 0.61mi |
| 62 Bethel St Hagerstown, MD | 3.0 | 1.5 | 1088 | $1,700 | $1.56 | 43d | 1 | 0.61mi |
| 441 N Potomac St Hagerstown, MD | 2.0 | 1.0 | 970 | $1,350 | $1.39 | 43d | 1 | 0.75mi |
| 421 Salem Ave Hagerstown, MD | 3.0 | 1.0 | 1256 | $1,550 | $1.23 | 20d | 1 | 0.76mi |
| 616 George St Hagerstown, MD | 3.0 | 1.0 | 1034 | $1,600 | $1.55 | 43d | 1 | 0.89mi |
| 629 Oak Hill Ave Unit 3 Hagerstown, MD | 2.0 | 1.0 | 1386 | $1,595 | $1.15 | 43d | 1 | 0.89mi |
| 625 George St Hagerstown, MD | 2.0 | 1.0 | 1856 | $1,400 | $0.75 | 13d | 1 | 0.89mi |
| 55 Manor Dr Unit 20-204 Hagerstown, MD | 2.0 | 1.0 | 936 | $1,454 | $1.55 | 43d | 1 | 0.93mi |
| 55 Manor Dr Unit 82-103 Hagerstown, MD | 3.0 | 1.0 | 945 | $1,670 | $1.77 | 43d | 1 | 0.93mi |
| 55 Manor Dr Unit 32-203 Hagerstown, MD | 2.0 | 1.0 | 936 | $1,509 | $1.61 | 43d | 1 | 0.93mi |
| 55 Manor Dr Unit 30-A1 Hagerstown, MD | 2.0 | 1.0 | 936 | $1,504 | $1.61 | 43d | 1 | 0.93mi |
| 109 Fairground Ave Hagerstown, MD | 3.0 | 1.0 | 1470 | $1,600 | $1.09 | 13d | 1 | 0.94mi |
| 909 Corbett St Hagerstown, MD | 3.0 | 2.5 | 1276 | $2,695 | $2.11 | 13d | 1 | 0.95mi |
| 607 Salem Ave Hagerstown, MD | 4.0 | 1.0 | 1344 | $1,775 | $1.32 | 43d | 1 | 0.97mi |
| 464 Peleton St Hagerstown, MD | 3.0 | 2.0 | 1253 | $2,025 | $1.62 | 13d | 1 | 0.97mi |
Listing history 39 events
-
2026-06-18days on market $145,000 Active 45 DOM
-
2026-06-17days on market $145,000 Active 44 DOM
-
2026-06-16days on market $145,000 Active 43 DOM
-
2026-06-15days on market $145,000 Active 42 DOM
-
2026-06-14days on market $145,000 Active 40 DOM
-
2026-06-13days on market $145,000 Active 39 DOM
-
2026-06-10days on market $145,000 Active 37 DOM
-
2026-06-09days on market $145,000 Active 36 DOM
-
2026-06-08days on market $145,000 Active 35 DOM
-
2026-06-07days on market $145,000 Active 34 DOM
-
2026-06-03days on market $145,000 Active 30 DOM
-
2026-06-02days on market $145,000 Active 29 DOM
-
2026-06-01days on market $145,000 Active 28 DOM
-
2026-05-31days on market $145,000 Active 27 DOM
-
2026-05-30days on market $145,000 Active 26 DOM
-
2026-05-04$145,000 Active
-
2026-04-24historical
-
2026-04-23status Active
-
2026-03-03status Pending
-
2026-02-25$145,000 Active
-
2026-02-12historical
-
2025-10-15soldstatus $80,000
-
2022-02-16price $1,250
-
2022-01-25soldstatus $75,000
-
2021-11-10soldstatus $65,000
-
2016-09-11historical Withdrawn
-
2016-09-11historical
-
2016-05-27Active
-
2016-05-27$69,900
-
2005-11-03soldstatus $93,500
-
2005-10-20soldstatus $93,500
-
2005-09-20historical
-
2005-08-10$98,900
-
2004-03-23soldstatus $60,000
-
2004-03-16soldstatus $60,000
-
2004-02-19historical
-
2003-08-21$64,900
-
1994-04-14soldstatus $44,900
-
1987-04-27soldstatus $28,000
ⓘ Source: listings_history table (triggers on properties + properties_extension) + one-shot
backfill from property_details.listing_events for pre-trigger history.
Tax reassessment forecast MD · Partial reset (capped growth)
- Current annual tax
- $859 · $72/mo
- Projected year-2 tax
- $1,220 · $102/mo
- Expected delta
- +$361/yr (+$30/mo · 42.0%)
ⓘ Screening estimate from a state-policy table — verify with the county assessor before closing.
Climate risk First Street
- Flood 1/10 Low FEMA zone X (unshaded) · 0% chance over 30 yrs
- Wildfire 1/10 Low
- Heat 5/10 Major 7 d/yr ≥101°F today · 16 d/yr by 30 yrs out
- Wind 2/10 Low 2% chance of damaging wind over 30 yrs
- Air quality 2/10 Low 1 unhealthy d/yr today · 2 by 30 yrs out
Nearby sold comps map
Loading sold comps map…
Walkable amenities ~0.75 mi
Loading nearby amenities…
Taxation est. · year 1
- Rental income
- $18,814
- − Mortgage interest
- −$8,122
- − Property taxes
- −$859
- − Insurance
- −$725
- − Repairs & maintenance
- −$1,505
- − Management
- −$1,505
- − Depreciation
- −$4,218
- Taxable income
- $1,879
- Est. tax owed @ 24.0%
- −$451
- After-tax cash flow
- $3,703/yr
For passive investors: Depreciation is non-cash, so a rental often shows a tax loss while cash-flowing — sheltering income. Rental losses are passive: they offset passive income freely, and up to $25,000/yr can offset ordinary (W-2) income if you actively participate and your MAGI is under $100k (phasing out to $0 by $150k); unused losses carry forward. On sale, claimed depreciation is recaptured at up to 25%, and gains may owe capital-gains tax (a 1031 exchange can defer both). Figures are a year-1 estimate at your 24.0% rate — not tax advice; consult a CPA.
Schools (NCES district)
- District
- Washingtion County Public Schools
- NCES district ID
- 2400660
- Math proficiency
- 18% ▼ -20.00%
- Reading proficiency
- 33% ▼ -17.00%
- Median HH income
- $54,784
- Composite
- 22.87/100
- National rank
- #8007
- State rank
- #13 of 24 in MD
Livability — Hagerstown
- Score
- 77/100
- State rank
- #83
- US rank
- #3170
Category grades
Schools grade is shown separately in the Schools card above.
Census & demographics
- Census place
- Hagerstown, MD
- County
- Washington County · 98,861 people
- City population
- 64,792
- Metro
- Hagerstown-Martinsburg, MD-WV
- Population (ZIP)
- 64,792
- Household income
- $62,873
- Rent vs Own
- Severe rent burden
- 2832.0
Population outlook (Washington County) Hauer SSP2
- Today (2025)
- 151,614 people
- By 2030
- 151,455 · -0.1%
- By 2040
- 150,097 · -1.0%
- By 2050
- 148,193 · -2.3%
- By 2075
- 146,581 · -3.3%
- By 2100
- 138,025 · -9.0%
Race, ethnicity, and origin ACS 2023
- Neighborhood character
- Majority White (64%)
- Race & ethnicity
- White 64% Black 18% Two or more races 10% Hispanic / Latino 10% Asian 2%
- Hispanic origin (detail)
- Mexican 2% Puerto Rican 2% Dominican 2%
- Common ancestry
- Romanian 2% Lithuanian 1% Slovak 1%
- Foreign-born
- 9% · Canada, China
- Languages at home
- 86% English-only · Spanish 9% French/Haitian/Cajun 1% Chinese 1%
Political lean MEDSL · Washington
- 2024 margin
- Strong R (+23.0) · D 37.3% · R 60.4% · Other 2.3%
- 2008→2024 swing
- -10.2pp toward R · 2008: -12.9pp · 2024: -23.0pp
- All cycles
- 2024: R+23.0 2020: R+20.9 2016: R+32.4 2012: R+18.5 2008: R+12.9
Not yet ingested
- Civics
- —
Market trends
- HPI YoY
- ▼ -248.38%
- Current HPI
- 264.8018
- Rent YoY
- ▲ 4.00%
- Metro
- Hagerstown-Martinsburg, MD-WV
- State GDP YoY
- ▲ 2.97%
- F500 in state
- 12
Industry mix (Fortune 500 HQ in MD)
| Industry | F500 HQs | Revenue |
|---|---|---|
| Aerospace / Defense | 1 | $71B |
|
||
| Utilities | 1 | $25B |
|
||
| Hotels | 1 | $24B |
|
||
| Consumer Goods | 1 | $7B |
|
||
| Real Estate | 1 | $6B |
|
||
| Chemicals | 1 | $2B |
|
||
Price history
+417.9% since first listed24 events — show timeline
- 2026-05-04 Listed $145,000 BRIGHT MLS
- 2026-04-24 Listing Removed — BRIGHT MLS
- 2026-04-23 Relisted — BRIGHT MLS
- 2026-03-03 Pending — BRIGHT MLS
- 2026-02-25 Listed $145,000 BRIGHT MLS
- 2026-02-12 Coming Soon — BRIGHT MLS
- 2025-10-15 Sold (Public Records) $80,000 Public Records
- 2022-02-16 Price Changed $1,250 RENT.
- 2022-01-25 Sold (Public Records) $75,000 Public Records
- 2021-11-10 Sold (Public Records) $65,000 Public Records
- 2016-09-11 Listing Removed — BRIGHT MLS
- 2016-09-11 Delisted — MRIS
- 2016-05-27 Listed — MRIS
- 2016-05-27 Listed $69,900 BRIGHT MLS
- 2005-11-03 Sold (Public Records) $93,500 Public Records
- 2005-10-20 Sold (MLS) $93,500 MRIS
- 2005-09-20 Delisted — MRIS
- 2005-08-10 Listed $98,900 MRIS
- 2004-03-23 Sold (Public Records) $60,000 Public Records
- 2004-03-16 Sold (MLS) $60,000 MRIS
- 2004-02-19 Delisted — MRIS
- 2003-08-21 Listed $64,900 MRIS
- 1994-04-14 Sold (Public Records) $44,900 Public Records
- 1987-04-27 Sold (Public Records) $28,000 Public Records
Property tax history
-3.0%/yrLatest (2025): $859 · +13.7% YoY. Source: county tax records.
Cash-flow waterfall
monthlySold comps — $/sqft
last 12 mo · ≤1 miLoading sold comps…