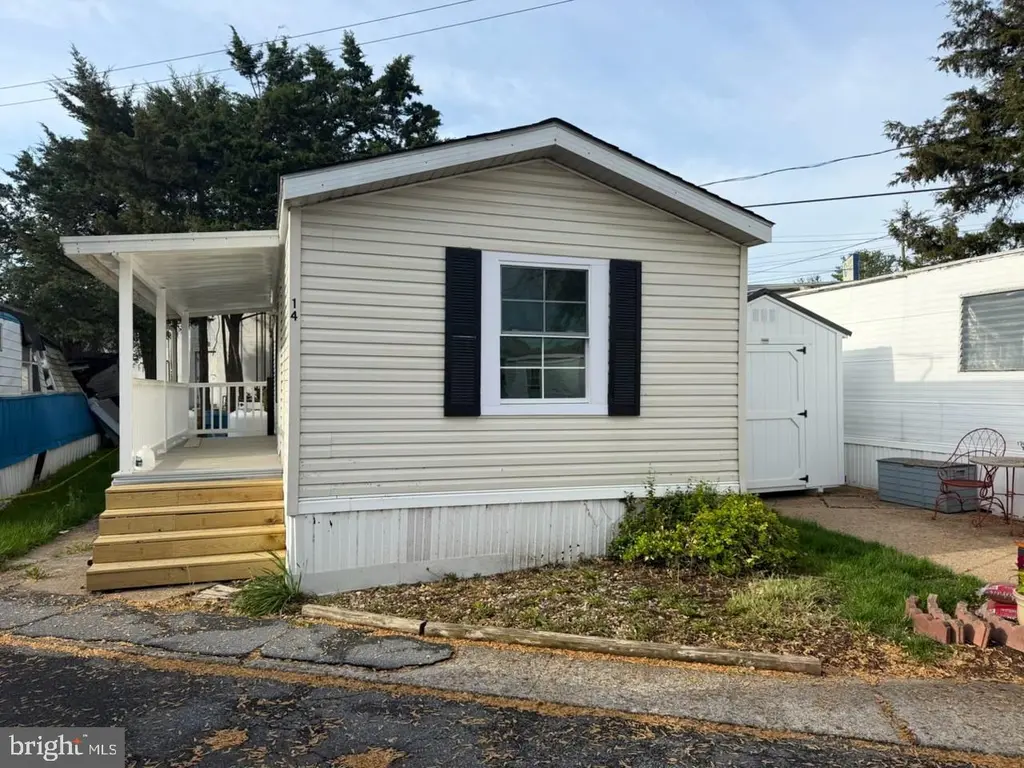
14 Nelson Mobile Mnr · Highspire, PA
Flood risk 10/10 · Severe
- FEMA flood zone
- X (shaded)
- Chance of flooding over 30 yrs
- 0.99%
- Est. flood insurance / yr
- $507 – $1,088
Fire risk 1/10 · Minimal
- Est. fire insurance / yr
- $511 – $949
Heat risk 5/10 · Moderate
- Hot days now (above 102°F)
- 7 days/yr
- Hot days in 30 yrs
- 16 days/yr
Wind risk 3/10 · Minor
- Chance of severe wind over 30 yrs
- 6.0%
Air-quality risk 3/10 · Minor
- Unhealthy air days now
- 3 days/yr
- Unhealthy air days in 30 yrs
- 5 days/yr
Risk factors via First Street. Map © Google.
Why this score? — see what drove the B- grade
The composite is a weighted blend of 9 inputs, each scored 0–100. Each bar is that input's sub-score; the figure is the points it added to the 100-point composite (weight × sub-score).
- Cash flow +30.0/30.0
- 1% rule +10.0/10.0
- DSCR +10.0/10.0
- ARV discount +7.5/15.0
- Schools +3.3/10.0
- Livability +3.2/5.0
- Rent growth +2.9/5.0
- Condition / age +2.5/5.0
- Appreciation +0.0/10.0
$64,000
🖨 Deal sheet (PDF) 📄 Offer letter ✓ Due diligence
Listing remarks
Renovated in 2026, ready to move into this singlewide (2 beds, 1 bath). $645 monthly lot rent in Lisa Lakes MHP. Buyer can purchase 1 yr home warranty (optional). See 27 pics. Walk to restaurant and lake.
Key facts
- Renovated
- Walk to restaurant
- Walk to lake
Tags
Property features AI
Finance
- Other: Income/expense note: Annual ground rent
- Financial info: Improvement assessed at $18,800; Annual taxes reported (total $745 for tax year 2025); Property manager present
- HOA & community: Ground rent exists (monthly $645)
Exterior
- Parking: On-street parking
- Utilities: Public water; Public sewer
- Home design: Manufactured home, single wide; Above-grade living space only; Year built/effective 2026
- Construction: Vinyl siding; Above grade and below grade structures noted
- Exterior features: Rented lot in a mobile home park (Lisa Lake MHP); Not in a federal flood zone
Interior
- Bedrooms: Two bedrooms on the main level
- Bathrooms: One full bathroom on the main level
- Heating & cooling: Forced air heating; Propane (leased) heating fuel; Electric hot water
- Interior features: No basement; Living area reported by assessor; Property in very good condition
Neighborhood map
What this means for you Summary
Snapshot
- This is a 2-bed/1.0-bath manufactured listed at $64k.
Deal economics
- At list price, monthly cash flow is $422 ($5k/yr) — positive.
- The deal already cash-flows at list — no discount required.
- Meets the 1% rule at list price ($1k rent vs $64k).
- Recommended offer: $62k (3.0% below list) — sets the bar for market timing.
- Cap rate 15.5% vs local median 4.2% in Highspire — top-decile yield for the area; either an underpriced asset or a hidden risk that comps aren't pricing in. Stress-test before assuming the spread holds.
Location & tenants
- Location reads 63/100 on livability (#1,272 in PA) — a middle-class / working-renter tenant base. Strengths: cost of living A+, housing A+; Watch: amenities F, commute F, employment D-.
- Middletown Area SD (suburban): math 31% / reading 45% proficiency, ranked #368 of 539 in PA (top 68%) — families likely to look elsewhere, expect single-tenant / working-renter base with shorter leases.
- Zoned schools: Middletown Area Hs (math 72% / reading 10%, grade F, #251 of 437 statewide, top 58%, 747 students, 51% FRL).
- Market conditions: Rents rising (+1.6%/yr); 146 active listings in the ZIP; 1 comparable units currently listed for rent nearby; 540 units permitted in Dauphin County in 2024 (194 in 5+ unit buildings).
Forward outlook
- Local home prices are declining (-3.0%/yr); year-one equity from $442 of loan paydown is wiped out by about $2k of value loss. Plan a longer hold.
- At projected returns (-3.0% appreciation + 1.6% rent growth), your $18k cash investment doubles in ~5 years — after that, you're playing with house money.
Negotiation context
- It's been on market 48 days — a 3% lower offer ($62k) is reasonable based on typical stale-listing flexibility.
- Current owner paid $24k; list at $64k implies a 163% gain — meaningful room to come down on a strong offer.
Risks & watch-outs
- Watch-outs: flood insurance adds $66/mo.
- Climate carrying-cost: severe flood risk; extreme-heat days projected 7→16/yr by 2055 (HVAC capex compounding) — expect insurance premiums to compound above CPI over the hold.
Questions for the listing agent
- It's been on market 48 days. Have you received any prior offers? Is the seller open to a 3% concession, seller financing, or rate buy-down credit?
- What's the actual annual flood-insurance premium (NFIP or private), and is the property in a SFHA with mandatory coverage?
- Is there a deadline driving the sale (1031 exchange, divorce, estate, relocation)? That informs how much negotiation room exists.
- Schools are F-rated, which usually means shorter tenancies and higher turnover. Who's the typical renter profile here, and what's been the actual vacancy rate?
- What's the average days-on-market for RENTAL listings here right now (not sales)? A rising rental-DOM trend means longer vacancies and softer asking-rent achievability than the comps imply.
- What's the recent tenant-quality profile in this submarket — average credit score on applications, eviction rate, late-payment / NSF rate, and stable-employment percentage? A property-management company in the area should have these aggregated.
- How much new for-sale + rental construction is in the pipeline within 1–3 miles? Heavy new supply typically softens prices + rents 12–24 months out; constrained supply supports both.
Investment metrics
- 1% rule
- 1.81% ✓
- Cap rate
- 15.46%
- Cash-on-cash
- 32.73%
- DSCR
- 2.46
- GRM
- 4.6
CMA / ARV
- ARV (median comp)
- $41,589
- List price
- $64,000
- Delta
- 53.89%
- Verdict
- OVERPRICED
- Comps
- 6 within 1.0 mi
Projected returns pro-forma
-3.0% appreciation · 1.58% rent growth · sell at horizon
- IRR
- 20.8%
- Equity multiple
- 1.83×
- Total profit
- $14,941
- Equity at exit
- $9,543
- IRR
- 28.0%
- Equity multiple
- 3.31×
- Total profit
- $41,338
- Equity at exit
- $5,534
Cash invested: $17,920 (down + closing). Projections, not guarantees.
Landlord ↔ Tenant lean methodology
- Overall (STATE)
- 62 Landlord-Friendly
- State Pennsylvania
- 62 Landlord-Friendly · EVEN
- County
- — inherits STATE
- City
- — inherits STATE
ZIP-level market 17057
- Home prices YoY
- -23.9%
- Rents YoY
- 1.6%
- Active inventory
- 146
- Price-to-rent
- 4.6×
Monthly cashflow live
- Estimated rent
- $1,156 medium interval (Pro) →
- Mortgage (P&I)
- −$336
- Tax from tax record
- −$62 /mo · $746/yr
- Insurance
- −$27
- Flood insurance flood zone
- −$66 /mo · $798/yr
- HOA
- −$0
- Vacancy / Maint / Mgmt
- −$243
- Net cashflow
- $422
Break-even live
Sensitivity live
| Price | -10% $458 | -5% $440 | +0% $422 | +5% $404 | +10% $386 |
|---|---|---|---|---|---|
| Rent | -10% $331 | -5% $377 | +0% $422 | +5% $468 | +10% $514 |
| Rate | -1.0pp $454 | -0.5pp $439 | base $422 | +0.5pp $406 | +1.0pp $389 |
UW: 25.0% down · 7.5% · 30yr · 1.5% tax · 5.0% vac · 8.0% maint · 8.0% mgmt
Financing live
Cash to close
- Down payment
- $16,000
- Closing costs
- $1,920
- Reserves months
- —
- Total cash needed
- —
Loan-product check · same deal, 3 products live
Conventional
25% down · 7.5% · 30yr
- Down + closing
- —
- Monthly P&I
- —
- Monthly cashflow
- —
- DSCR
- —
- Eligible?
- —
Personal DTI + credit; lowest rate.
DSCR
20% down · 8.5% · 30yr
- Down + closing
- —
- Monthly P&I
- —
- Monthly cashflow
- —
- DSCR
- —
- Eligible?
- —
No personal income docs; deal must DSCR.
Hard money
10% down · 12.0% · 12mo
- Down + closing
- —
- Monthly P&I
- —
- Monthly cashflow
- —
- DSCR
- —
- Eligible?
- —
Short-term bridge; refi at stabilization.
Rent comps 1 comps
| Address | Beds | Baths | Sqft | Rent | $/sqft | DOM | Units | Dist |
|---|---|---|---|---|---|---|---|---|
| 263 2nd St Unit 2 Highspire, PA | 1.0 | 1.0 | 525 | $875 | $1.67 | 15d | 1 | 1.17mi |
Listing history 18 events
-
2026-06-21days on market $64,000 Active 48 DOM
-
2026-06-18days on market $64,000 Active 45 DOM
-
2026-06-17days on market $64,000 Active 44 DOM
-
2026-06-16days on market $64,000 Active 43 DOM
-
2026-06-15days on market $64,000 Active 42 DOM
-
2026-06-14days on market $64,000 Active 40 DOM
-
2026-06-10days on market $64,000 Active 37 DOM
-
2026-06-09days on market $64,000 Active 36 DOM
-
2026-06-08days on market $64,000 Active 35 DOM
-
2026-06-07days on market $64,000 Active 34 DOM
-
2026-06-05days on market $64,000 Active 31 DOM
-
2026-06-03days on market $64,000 Active 30 DOM
-
2026-06-02days on market $64,000 Active 29 DOM
-
2026-06-01days on market $64,000 Active 28 DOM
-
2026-05-31days on market $64,000 Active 27 DOM
-
2026-05-31days on market $64,000 Active 26 DOM
-
2026-05-04$64,000 Active 204-char remark
-
1996-01-16soldstatus $24,350
ⓘ Source: listings_history table (triggers on properties + properties_extension) + one-shot
backfill from property_details.listing_events for pre-trigger history.
Tax reassessment forecast PA · Partial reset (capped growth)
- Current annual tax
- $746 · $62/mo
- Projected year-2 tax
- $878 · $73/mo
- Expected delta
- +$133/yr (+$11/mo · 17.8%)
ⓘ Screening estimate from a state-policy table — verify with the county assessor before closing.
Climate risk First Street
- Flood 10/10 Extreme FEMA zone X (shaded) · 99% chance over 30 yrs
- Wildfire 1/10 Low
- Heat 5/10 Major 7 d/yr ≥102°F today · 16 d/yr by 30 yrs out
- Wind 3/10 Moderate 6% chance of damaging wind over 30 yrs
- Air quality 3/10 Moderate 3 unhealthy d/yr today · 5 by 30 yrs out
Nearby sold comps map
Loading sold comps map…
Walkable amenities ~0.75 mi
Loading nearby amenities…
Taxation est. · year 1
- Rental income
- $13,871
- − Mortgage interest
- −$3,585
- − Property taxes
- −$746
- − Insurance
- −$1,118
- − Repairs & maintenance
- −$1,110
- − Management
- −$1,110
- − Depreciation
- −$1,862
- Taxable income
- $4,341
- Est. tax owed @ 24.0%
- −$1,042
- After-tax cash flow
- $4,025/yr
For passive investors: Depreciation is non-cash, so a rental often shows a tax loss while cash-flowing — sheltering income. Rental losses are passive: they offset passive income freely, and up to $25,000/yr can offset ordinary (W-2) income if you actively participate and your MAGI is under $100k (phasing out to $0 by $150k); unused losses carry forward. On sale, claimed depreciation is recaptured at up to 25%, and gains may owe capital-gains tax (a 1031 exchange can defer both). Figures are a year-1 estimate at your 24.0% rate — not tax advice; consult a CPA.
Schools (NCES district)
- District
- Middletown Area SD
- NCES district ID
- 4215240
- Math proficiency
- 31% ▼ -9.00%
- Reading proficiency
- 45% ▼ -11.00%
- Median HH income
- $53,128
- Composite
- 33.08/100
- National rank
- #5567
- State rank
- #368 of 539 in PA
Livability — Highspire
- Score
- 63/100
- State rank
- #1272
- US rank
- #15383
Category grades
Schools grade is shown separately in the Schools card above.
Census & demographics
- County
- Dauphin County · 247,857 people
- City population
- 23,560
- Metro
- Harrisburg-Carlisle, PA
- Population (ZIP)
- 23,560
- Household income
- $73,407
- Rent vs Own
- Severe rent burden
- 748.0
Population outlook (Dauphin County) Hauer SSP2
- Today (2025)
- 281,628 people
- By 2030
- 283,549 · +0.7%
- By 2040
- 285,385 · +1.3%
- By 2050
- 286,188 · +1.6%
- By 2075
- 291,053 · +3.3%
- By 2100
- 282,374 · +0.3%
Race, ethnicity, and origin ACS 2023
- Neighborhood character
- Predominantly White (76%)
- Race & ethnicity
- White 76% Hispanic / Latino 11% Two or more races 8% Black 6% Asian 2%
- Hispanic origin (detail)
- Mexican 1% Puerto Rican 7%
- Common ancestry
- Romanian 3% Italian 2% Serbian 2%
- Foreign-born
- 5% · Canada, China, South Korea
- Languages at home
- 92% English-only · Spanish 4% Other Indo-European 1%
Political lean MEDSL · Dauphin
- 2024 margin
- Lean D (+5.9) · D 52.4% · R 46.5% · Other 1.1%
- 2008→2024 swing
- -3.1pp toward R · 2008: 9.1pp · 2024: 5.9pp
- All cycles
- 2024: D+5.9 2020: D+8.5 2016: D+2.8 2012: D+6.0 2008: D+9.1
Not yet ingested
- Civics
- —
Market trends
- HPI YoY
- ▼ -83.17%
- Current HPI
- 265.6077
- Rent YoY
- ▲ 1.58%
- Metro
- Harrisburg-Carlisle, PA
- State GDP YoY
- ▲ 1.68%
- F500 in state
- 34
Industry mix (Fortune 500 HQ in PA)
| Industry | F500 HQs | Revenue |
|---|---|---|
| Healthcare | 2 | $309B |
|
||
| Insurance | 2 | $27B |
|
||
| Telecommunications / Media | 1 | $124B |
|
||
| Industrial Distribution | 1 | $22B |
|
||
| Financial Services | 1 | $20B |
|
||
| Chemicals / Materials | 1 | $18B |
|
||
Price history
+162.8% since first listed2 events — show timeline
- 2026-05-04 Listed $64,000 BRIGHT MLS
- 1996-01-16 Sold (Public Records) $24,350 Public Records
Property tax history
+1.5%/yrLatest (2026): $746 · +4.7% YoY. Source: county tax records.
Cash-flow waterfall
monthlySold comps — $/sqft
last 12 mo · ≤1 miLoading sold comps…