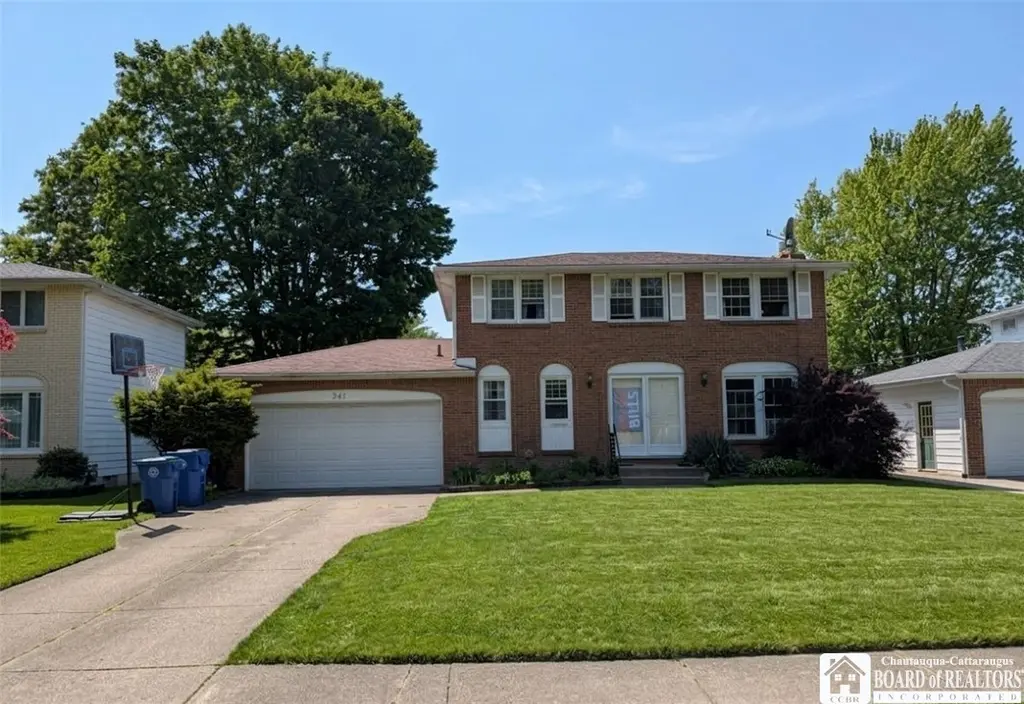
341 Vine Ln · North Tonawanda, NY
Flood risk 2/10 · Minimal
- FEMA flood zone
- X (unshaded)
- Chance of flooding over 30 yrs
- 0.03%
- Est. flood insurance / yr
- $473 – $860
Fire risk 3/10 · Minor
- Est. fire insurance / yr
- $691 – $1,283
Heat risk 2/10 · Minimal
- Hot days now (above 94°F)
- 7 days/yr
- Hot days in 30 yrs
- 15 days/yr
Wind risk 1/10 · Minimal
- Chance of severe wind over 30 yrs
- —
Air-quality risk 3/10 · Minor
- Unhealthy air days now
- 2 days/yr
- Unhealthy air days in 30 yrs
- 3 days/yr
Risk factors via First Street. Map © Google.
Why this score? — see what drove the C+ grade
The composite is a weighted blend of 9 inputs, each scored 0–100. Each bar is that input's sub-score; the figure is the points it added to the 100-point composite (weight × sub-score).
- Cash flow +20.7/30.0
- ARV discount +15.0/15.0
- 1% rule +6.6/10.0
- DSCR +6.6/10.0
- Schools +4.5/10.0
- Livability +4.2/5.0
- Rent growth +2.5/5.0
- Condition / age +2.5/5.0
- Appreciation +0.0/10.0
$200,000
🖨 Deal sheet 📄 Offer letter ✓ Due diligence
Listing remarks MLS
Fabulous brick and vinyl center entrance Colonial. Features new Pergo flooring (2011) in the living room, dining room, kitchen and bath. Living room boasts bay window and gas fireplace with large brick surround. Efficient eat in kitchen includes all appliances. Dining room features shadow boxes. Remodeled lower bath. Master bed with double closets. Partially finished basement. Large fenced in yard with concrete patio. Security system, new furnace and AC (2010), roof soffit (2012), and all windows and exterior doors have been replaced. 2.5 attached garage. Don't delay, Call today!
Key facts
- Cozy gas fireplace
- Remodeled lower bath
- Concrete patio
Tags
Property features AI
Finance
- HOA & community: Community trails/paths
Exterior
- Parking: Attached garage; Approximately 2.5 garage spaces
- Utilities: Public water connected; Sewer connected
- Home design: Two-story house; Existing/resale property
- Construction: Brick and frame construction; Poured foundation
- Exterior features: Concrete driveway; Near public transit; Rectangular residential lot; Road frontage on a city street; Lot dimensions approximately 64 x 125
Interior
- Kitchen: Appliances negotiable; Gas water heater
- Bedrooms: Total rooms: 7
- Flooring: Varied flooring; Vinyl
- Bathrooms: 1 full bathroom; 1 half bathroom; 1 main-level bathroom
- Heating & cooling: Gas forced-air heating; Central air conditioning
- Interior features: Separate/formal dining room; Recreation room; Bonus room; Partially finished full basement; Has fireplace (1)
- Laundry & utility: Washer/dryer not specified
Neighborhood map
What this means for you Summary
Snapshot
- This is a 3-bed/1.5-bath single-family listed at $200k.
Deal economics
- At list price, monthly cash flow is $271 ($3k/yr) — positive.
- The deal already cash-flows at list — no discount required.
- Meets the 1% rule at list price ($2k rent vs $200k).
- Cap rate 7.9% vs local median 4.0% in North Tonawanda — top-decile yield for the area; either an underpriced asset or a hidden risk that comps aren't pricing in. Stress-test before assuming the spread holds.
Location & tenants
- Location reads 85/100 on livability (#30 in NY, #518 nationally) — a professional / high-income tenant draw. Strengths: commute A+, housing A+, health & safety A+.
- Sweet Home Central School District (suburban): math 46% / reading 59% proficiency, ranked #342 of 590 in NY (top 58%) — acceptable for families but not a draw, mixed tenant base, ~2y average lease.
- Market conditions: 94 active listings in the ZIP; 10 comparable units currently listed for rent nearby; rentals at typical pace (median 16d on market — plan ~3-4 weeks tenant-placement turnaround); 1,244 units permitted in Erie County in 2024 (563 in 5+ unit buildings).
- This rent runs 37% of the median local income ($75k/yr) — at the standard rent-burdened threshold; future hikes will face affordability resistance.
Forward outlook
- Local home prices are declining (-3.0%/yr); year-one equity from $1k of loan paydown is wiped out by about $6k of value loss. Plan a longer hold.
Negotiation context
- Only 7 days on market — expect competitive offers; lowballing is unlikely to land.
- 2 sale attempts since 13y ago with the ask held roughly flat each time — persistent listings suggest the price (not the market) is what's stuck; bring a comps-based counter.
- Current owner paid $135k; 48% above their basis — modest negotiation headroom, anchor on the comps not their cost.
Risks & watch-outs
- Watch-outs: property tax is 2.6% of price.
Questions for the listing agent
- Built in 1971 — when were the roof, HVAC, electrical panel, plumbing, and water heater last replaced?
- Property tax is high relative to price — has the assessment been appealed recently, and will the sale trigger a re-assessment?
- Is there a deadline driving the sale (1031 exchange, divorce, estate, relocation)? That informs how much negotiation room exists.
- Schools are B-rated — typically a magnet for longer-tenancy family renters. What's the average tenant stay here, and is there a school-zone premium baked into asking?
- What's the average days-on-market for RENTAL listings here right now (not sales)? A rising rental-DOM trend means longer vacancies and softer asking-rent achievability than the comps imply.
- What's the recent tenant-quality profile in this submarket — average credit score on applications, eviction rate, late-payment / NSF rate, and stable-employment percentage? A property-management company in the area should have these aggregated.
- How much new for-sale + rental construction is in the pipeline within 1–3 miles? Heavy new supply typically softens prices + rents 12–24 months out; constrained supply supports both.
Investment metrics
- 1% rule
- 1.16% ✓
- Cap rate
- 7.92%
- Cash-on-cash
- 5.81%
- DSCR
- 1.26
- GRM
- 7.2
CMA / ARV
- ARV (on-the-fly)
- $321,904
- Comps found
- 9
Show comp detail 9 sales within ~0.75 mi
| Address | Dist | Beds/Ba | Sqft | Sold | Price | $/sf | Match |
|---|---|---|---|---|---|---|---|
| 305 Vine Ln | 0.07mi | 3/1.5 | 1,388 (+2%) | 10mo | $328,000 | $236 | 85 |
| 291 Vine Ln | 0.10mi | 3/1.5 | 1,388 (+2%) | 20mo | $316,000 | $228 | 76 |
| 437 Vine Ln | 0.20mi | 3/1.5 | 1,375 (+1%) | 22mo | $355,250 | $258 | 71 |
| 153 Florence Ln | 0.45mi | 3/2.0 | 1,366 (+0%) | 11mo | $420,000 | $307 | 67 |
| 511 Vine Ln | 0.34mi | 3/1.5 | 1,440 (+6%) | 10mo | $265,000 | $184 | 67 |
| 116 Sunset Ct | 0.61mi | 3/1.0 | 1,373 (+1%) | 3mo | $277,000 | $202 | 66 |
| 87 Florence Ln | 0.53mi | 3/3.0 | 1,366 (+0%) | 14mo | $415,000 | $304 | 57 |
| 8 Sweethaven Ct | 0.30mi | 2/2.0 (-1) | 1,540 (+13%) | 16mo | $345,915 | $225 | 44 |
| 233 Sunset Ct | 0.68mi | 2/2.5 (-1) | 1,509 (+11%) | 22mo | $405,000 | $268 | 24 |
Match score weights: distance 35% · size 25% · config 20% · recency 20%. Top-matched comps best support the ARV.
Projected returns pro-forma
-3.0% appreciation · 3.0% rent growth · sell at horizon
- IRR
- -7.2%
- Equity multiple
- 0.73×
- Total profit
- $-14,978
- Equity at exit
- $29,821
- IRR
- 2.4%
- Equity multiple
- 1.18×
- Total profit
- $9,813
- Equity at exit
- $17,292
Cash invested: $56,000 (down + closing). Projections, not guarantees.
Landlord ↔ Tenant lean methodology
- Overall (STATE)
- 15 Strongly Tenant-Friendly
- State New York
- 15 Strongly Tenant-Friendly · D+10
- County
- — inherits STATE
- City
- — inherits STATE
ZIP-level market 14228
- Home prices YoY
- -31.9%
- Active inventory
- 94
- Price-to-rent
- 7.2×
Monthly cashflow live
- Estimated rent
- $2,326 high interval (Pro) →
- Mortgage (P&I)
- −$1,049
- Tax from tax record
- −$434 /mo · $5,204/yr
- Insurance
- −$83
- HOA
- −$0
- Vacancy / Maint / Mgmt
- −$488
- Net cashflow
- $271
Break-even live
UW: 25.0% down · 7.5% · 30yr · 1.5% tax · 5.0% vac · 8.0% maint · 8.0% mgmt
Financing live
Cash to close
- Down payment
- $50,000
- Closing costs
- $6,000
- Reserves months
- —
- Total cash needed
- —
Loan-product check · same deal, 3 products live
Conventional
25% down · 7.5% · 30yr
- Down + closing
- —
- Monthly P&I
- —
- Monthly cashflow
- —
- DSCR
- —
- Eligible?
- —
Personal DTI + credit; lowest rate.
DSCR
20% down · 8.5% · 30yr
- Down + closing
- —
- Monthly P&I
- —
- Monthly cashflow
- —
- DSCR
- —
- Eligible?
- —
No personal income docs; deal must DSCR.
Hard money
10% down · 12.0% · 12mo
- Down + closing
- —
- Monthly P&I
- —
- Monthly cashflow
- —
- DSCR
- —
- Eligible?
- —
Short-term bridge; refi at stabilization.
Rent comps 10 comps
| Address | Beds | Baths | Sqft | Rent | $/sqft | DOM | Units | Dist |
|---|---|---|---|---|---|---|---|---|
| 157 Fairgreen Dr Unit Right side Buffalo, NY | 3.0 | 1.5 | 1500 | $2,300 | $1.53 | 1d | 1 | 0.09mi |
| 1 Apollo Dr Buffalo, NY | 2.0 | 2.5 | 988 | $2,150 | $2.18 | 16d | 1 | 0.71mi |
| 133 Sunshine Dr Buffalo, NY | 3.0 | 1.0 | 1300 | $2,100 | $1.62 | 16d | 1 | 1.40mi |
| 2493 Sweet Home Rd Unit 1-106 Buffalo, NY | 2.0 | 2.0 | 943 | $1,782 | $1.89 | 23d | 1 | 1.42mi |
| 2493 Sweet Home Rd Apt 101 Buffalo, NY | 2.0 | 2.0 | 1000 | $2,850 | $2.85 | 3d | 1 | 1.42mi |
| 2493 Sweet Home Rd Unit 101A Buffalo, NY | 2.0 | 2.0 | 1000 | $3,500 | $3.50 | 43d | 1 | 1.42mi |
| 2493 Sweet Home Rd Unit 1-201 Buffalo, NY | 2.0 | 2.0 | 943 | $1,904 | $2.02 | 43d | 1 | 1.42mi |
| 212 Sunshine Dr Unit Left Buffalo, NY | 3.0 | 1.5 | 1300 | $2,099 | $1.61 | 1d | 1 | 1.45mi |
| 227 Sunshine Dr Unit 227 Buffalo, NY | 3.0 | 2.0 | 1450 | $2,799 | $1.93 | 1d | 1 | 1.49mi |
| 91 Marine Dr Amherst, NY | 3.0 | 1.0 | 1291 | $2,150 | $1.67 | 43d | 1 | 1.49mi |
Listing history 9 events
-
2026-06-07statusdays on market $200,000 Pending 7 DOM
-
2026-06-03days on market $200,000 Active 6 DOM
-
2026-06-02days on market $200,000 Active 5 DOM
-
2026-06-01days on market $200,000 Active 4 DOM
-
2026-05-31days on market $200,000 Active 3 DOM
-
2026-05-28$200,000 Active
-
2013-12-16soldstatus $135,000
-
2013-12-10soldstatus $135,000 587-char remark
Show marketing remark (587 chars)
Fabulous brick and vinyl center entrance Colonial. Features new Pergo flooring (2011) in the living room, dining room, kitchen and bath. Living room boasts bay window and gas fireplace with large brick surround. Efficient eat in kitchen includes all appliances. Dining room features shadow boxes. Remodeled lower bath. Master bed with double closets. Partially finished basement. Large fenced in yard with concrete patio. Security system, new furnace and AC (2010), roof soffit (2012), and all windows and exterior doors have been replaced. 2.5 attached garage. Don't delay, Call today!
-
2013-09-04$139,500 587-char remark
Show marketing remark (587 chars)
Fabulous brick and vinyl center entrance Colonial. Features new Pergo flooring (2011) in the living room, dining room, kitchen and bath. Living room boasts bay window and gas fireplace with large brick surround. Efficient eat in kitchen includes all appliances. Dining room features shadow boxes. Remodeled lower bath. Master bed with double closets. Partially finished basement. Large fenced in yard with concrete patio. Security system, new furnace and AC (2010), roof soffit (2012), and all windows and exterior doors have been replaced. 2.5 attached garage. Don't delay, Call today!
ⓘ Source: listings_history table (triggers on properties + properties_extension) + one-shot
backfill from property_details.listing_events for pre-trigger history.
Tax reassessment forecast NY · Partial reset (capped growth)
- Current annual tax
- $5,204 · $434/mo
- Projected year-2 tax
- $5,204 · $434/mo
- Expected delta
- $0/yr ($0/mo · 0.0%)
ⓘ Screening estimate from a state-policy table — verify with the county assessor before closing.
Climate risk First Street
- Flood 2/10 Low FEMA zone X (unshaded) · 3% chance over 30 yrs
- Wildfire 3/10 Moderate
- Heat 2/10 Low 7 d/yr ≥94°F today · 15 d/yr by 30 yrs out
- Wind 1/10 Low
- Air quality 3/10 Moderate 2 unhealthy d/yr today · 3 by 30 yrs out
Nearby sold comps map
Loading sold comps map…
Walkable amenities ~0.75 mi
Loading nearby amenities…
Taxation est. · year 1
- Rental income
- $27,907
- − Mortgage interest
- −$11,203
- − Property taxes
- −$5,204
- − Insurance
- −$1,000
- − Repairs & maintenance
- −$2,233
- − Management
- −$2,233
- − Depreciation
- −$5,818
- Taxable income
- $216
- Est. tax owed @ 24.0%
- −$52
- After-tax cash flow
- $3,204/yr
For passive investors: Depreciation is non-cash, so a rental often shows a tax loss while cash-flowing — sheltering income. Rental losses are passive: they offset passive income freely, and up to $25,000/yr can offset ordinary (W-2) income if you actively participate and your MAGI is under $100k (phasing out to $0 by $150k); unused losses carry forward. On sale, claimed depreciation is recaptured at up to 25%, and gains may owe capital-gains tax (a 1031 exchange can defer both). Figures are a year-1 estimate at your 24.0% rate — not tax advice; consult a CPA.
Schools (NCES district)
- District
- Sweet Home Central School District
- NCES district ID
- 3628500
- Math proficiency
- 46% ▼ -12.00%
- Reading proficiency
- 59% ▲ 4.00%
- Median HH income
- $48,509
- Composite
- 44.67/100
- National rank
- #2765
- State rank
- #342 of 590 in NY
Livability — North Tonawanda
- Score
- 85/100
- State rank
- #30
- US rank
- #518
Category grades
Schools grade is shown separately in the Schools card above.
Census & demographics
- County
- Erie County · 714,559 people
- City population
- 44,241
- Metro
- Buffalo-Cheektowaga, NY
- Population (ZIP)
- 25,350
- Household income
- $74,871
- Rent vs Own
- Severe rent burden
- 1566.0
Population outlook (Erie County) Hauer SSP2
- Today (2025)
- 933,037 people
- By 2030
- 935,181 · +0.2%
- By 2040
- 928,531 · -0.5%
- By 2050
- 905,725 · -2.9%
- By 2075
- 834,037 · -10.6%
- By 2100
- 708,033 · -24.1%
Race, ethnicity, and origin ACS 2023
- Neighborhood character
- Predominantly White (74%)
- Race & ethnicity
- White 74% Asian 13% Black 5% Hispanic / Latino 5% Two or more races 5%
- Hispanic origin (detail)
- Puerto Rican 3%
- Common ancestry
- Romanian 13% Scotch-Irish 2% Lithuanian 1%
- Foreign-born
- 17% · China, Canada, South Korea
- Languages at home
- 78% English-only · Chinese 6% Other Indo-European 4% Russian/Polish/Slavic 3%
Political lean MEDSL · Erie
- 2024 margin
- Lean D (+9.7) · D 54.8% · R 45.2%
- 2008→2024 swing
- -7.9pp toward R · 2008: 17.5pp · 2024: 9.7pp
- All cycles
- 2024: D+9.7 2020: D+14.7 2016: D+4.8 2012: D+15.6 2008: D+17.5
Not yet ingested
- Civics
- —
Market trends
- HPI YoY
- ▼ -148.08%
- Current HPI
- 316.3097
- Rent YoY
- —
- Metro
- Buffalo-Cheektowaga, NY
- State GDP YoY
- ▲ 2.60%
- F500 in state
- 92
Industry mix (Fortune 500 HQ in NY)
| Industry | F500 HQs | Revenue |
|---|---|---|
| Financial Services | 10 | $950B |
|
||
| Consumer Goods | 9 | $162B |
|
||
| Insurance | 4 | $225B |
|
||
| Telecommunications | 2 | $144B |
|
||
| Pharmaceuticals | 2 | $112B |
|
||
| Media / Entertainment | 2 | $69B |
|
||
Price history
+43.4% since first listed4 events — show timeline
- 2026-05-28 Listed $200,000 UNYREIS
- 2013-12-16 Sold (Public Records) $135,000 Public Records
- 2013-12-10 Sold (MLS) $135,000 WNYREIS
- 2013-09-04 Listed $139,500 WNYREIS
Property tax history
+4.1%/yrLatest (2025): $5,204 · -20.9% YoY. Source: county tax records.
Cash-flow waterfall
monthlySold comps — $/sqft
last 12 mo · ≤1 miLoading sold comps…