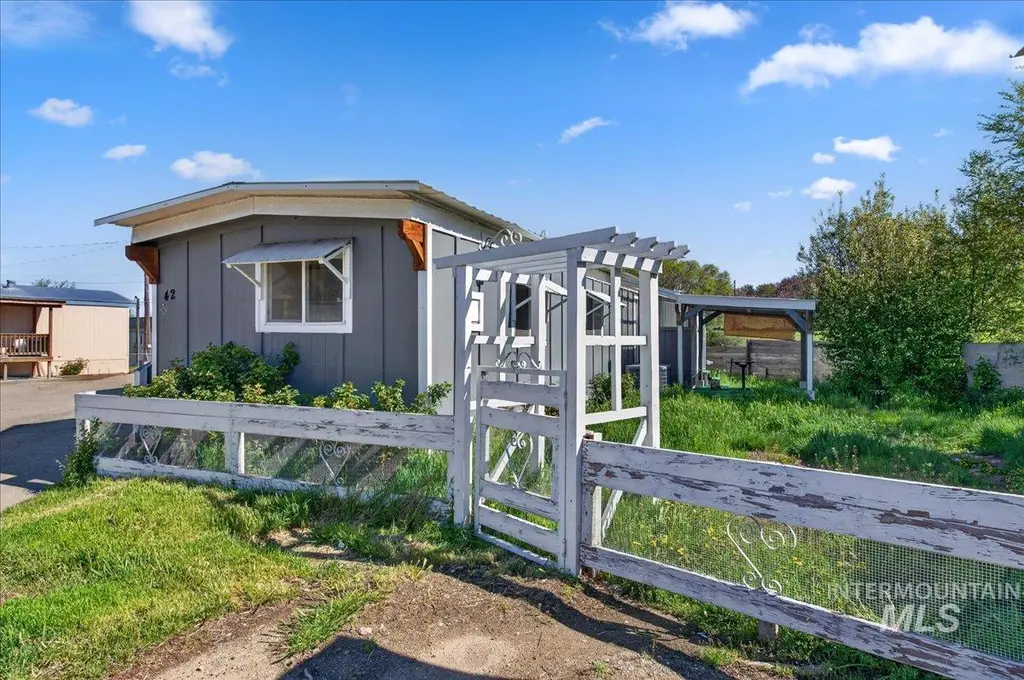
1323 Elgin #42 · Caldwell, ID
Flood risk 1/10 · Minimal
- FEMA flood zone
- X (unshaded)
- Chance of flooding over 30 yrs
- 0.0%
- Est. flood insurance / yr
- $507 – $1,088
Fire risk 4/10 · Minor
- Est. fire insurance / yr
- $584 – $1,086
Heat risk 5/10 · Moderate
- Hot days now (above 99°F)
- 7 days/yr
- Hot days in 30 yrs
- 18 days/yr
Wind risk 1/10 · Minimal
- Chance of severe wind over 30 yrs
- —
Air-quality risk 7/10 · Major
- Unhealthy air days now
- 11 days/yr
- Unhealthy air days in 30 yrs
- 18 days/yr
Risk factors via First Street. Map © Google.
Why this score? — see what drove the C+ grade
The composite is a weighted blend of 9 inputs, each scored 0–100. Each bar is that input's sub-score; the figure is the points it added to the 100-point composite (weight × sub-score).
- Cash flow +30.0/30.0
- 1% rule +10.0/10.0
- DSCR +10.0/10.0
- Livability +3.4/5.0
- Rent growth +3.2/5.0
- Condition / age +2.2/5.0
- Schools +2.0/10.0
- ARV discount +0.0/15.0
- Appreciation +0.0/10.0
$69,900
🖨 Deal sheet 📄 Offer letter ✓ Due diligence
Listing remarks MLS
You must see to appreciate! Remodeled Manufacture Home WITH NO LAND, 2 beds, 1 bath, (it has an small bedroom added, it could be used as a 3rd bedroom. ) newer floors, doors, windows, New siding, New roof, New Ac unit, Tons of updates!
Key facts
- Built 1979
- Listed 58 days
Property features AI
Finance
- HOA & community: Association fees billed annually; Located in a mobile home park
Exterior
- Utilities: Community water service; Sewer connected; Cable connected; Broadband internet; Electric service
- Home design: Mobile/manufactured home located in a rented lot; Built in 1979
- Construction: HardiPlank-type siding; Metal roof; Built in 1979
- Exterior features: Full wood fencing; Covered patio/deck; Storage shed; Dog run; Garden; Manual sprinkler system; Paved road access
Interior
- Kitchen: Oven/Range (freestanding); Refrigerator; Pantry
- Bedrooms: 3 bedrooms (all on the main level)
- Flooring: Carpet; Laminate
- Bathrooms: 1 bathroom
- Fireplace: One fireplace with insert
- Heating & cooling: Electric forced-air heating; Central air conditioning
- Interior features: Master bedroom on main level; Pantry; Laminate countertops
- Laundry & utility: Utility room on main level; Electric water heater
Neighborhood map
What this means for you Summary
Snapshot
- This is a 3-bed/1.0-bath manufactured listed at $70k. Condition is rated fair.
Deal economics
- At list price, monthly cash flow is $701 ($8k/yr) — positive.
- The deal already cash-flows at list — no discount required.
- Meets the 1% rule at list price ($1k rent vs $70k).
- Recommended offer: $68k (3.0% below list) — sets the bar for market timing.
- Cap rate 18.3% vs local median 3.1% in Caldwell — top-decile yield for the area; either an underpriced asset or a hidden risk that comps aren't pricing in. Stress-test before assuming the spread holds.
Location & tenants
- Location reads 67/100 on livability (#88 in ID) — a middle-class / working-renter tenant base. Strengths: cost of living A+, housing A+; Watch: crime C-, employment D+, amenities F.
- Caldwell District (suburban): math 17% / reading 31% proficiency, ranked #90 of 92 in ID (top 98%) — low school quality limits family demand, transient renter base, plan for 1-2y turnover; 72% free/reduced lunch — lower-income household profile, screen leases tightly.
- Zoned schools: Van Buren Elementary School (math 23% / reading 28%, grade F, #330 of 357 statewide, top 92%, 561 students, 90% FRL); Caldwell Senior High School (math 16% / reading 38%, grade F, #131 of 169 statewide, top 77%, 1,474 students, 76% FRL).
- Market conditions: Rents rising (+2.7%/yr); 341 active listings in the ZIP; 19 comparable units currently listed for rent nearby; rentals leasing fast (median 11d on market — plan ~1-2 weeks tenant-placement turnaround); 3,620 units permitted in Canyon County in 2024 (196 in 5+ unit buildings).
Forward outlook
- Local home prices are declining (-3.0%/yr); year-one equity from $483 of loan paydown is wiped out by about $2k of value loss. Plan a longer hold.
- Canyon County population projected at +41% by 2050 — long-run rental-demand tailwind backs the buy-and-hold thesis.
- At projected returns (-3.0% appreciation + 2.7% rent growth), your $20k cash investment doubles in ~3 years — after that, you're playing with house money.
Negotiation context
- It's been on market 58 days — a 3% lower offer ($68k) is reasonable based on typical stale-listing flexibility.
- 3 sale attempts since 4y ago; this cycle's ask has dropped $5k (7%) from the opening price — seller is motivated, your offer sets the floor, not the list.
Risks & watch-outs
- Climate carrying-cost: extreme-heat days projected 7→18/yr by 2055 (HVAC capex compounding) — expect insurance premiums to compound above CPI over the hold.
Questions for the listing agent
- It's been on market 58 days. Have you received any prior offers? Is the seller open to a 3% concession, seller financing, or rate buy-down credit?
- Have any recent inspections been done? Can we get a copy of the seller's disclosures and any deferred-maintenance estimates?
- Built in 1979 — when were the roof, HVAC, electrical panel, plumbing, and water heater last replaced?
- Is there a deadline driving the sale (1031 exchange, divorce, estate, relocation)? That informs how much negotiation room exists.
- Schools are D-rated, which usually means shorter tenancies and higher turnover. Who's the typical renter profile here, and what's been the actual vacancy rate?
- What's the average days-on-market for RENTAL listings here right now (not sales)? A rising rental-DOM trend means longer vacancies and softer asking-rent achievability than the comps imply.
- What's the recent tenant-quality profile in this submarket — average credit score on applications, eviction rate, late-payment / NSF rate, and stable-employment percentage? A property-management company in the area should have these aggregated.
- How much new for-sale + rental construction is in the pipeline within 1–3 miles? Heavy new supply typically softens prices + rents 12–24 months out; constrained supply supports both.
Investment metrics
- 1% rule
- 2.14% ✓
- Cap rate
- 18.33%
- Cash-on-cash
- 42.97%
- DSCR
- 2.91
- GRM
- 3.9
CMA / ARV
- ARV (on-the-fly)
- $56,550
- Comps found
- 1
Show comp detail 1 sale within ~0.75 mi
| Address | Dist | Beds/Ba | Sqft | Sold | Price | $/sf | Match |
|---|---|---|---|---|---|---|---|
| 818 N Illinois Ave Unit 1A | 0.71mi | 2/1.0 (-1) | 840 (-3%) | 1mo | $54,900 | $65 | 55 |
Match score weights: distance 35% · size 25% · config 20% · recency 20%. Top-matched comps best support the ARV.
Projected returns pro-forma
-3.0% appreciation · 2.69% rent growth · sell at horizon
- IRR
- 39.4%
- Equity multiple
- 2.68×
- Total profit
- $32,871
- Equity at exit
- $10,422
- IRR
- 45.7%
- Equity multiple
- 5.31×
- Total profit
- $84,298
- Equity at exit
- $6,044
Cash invested: $19,572 (down + closing). Projections, not guarantees.
Landlord ↔ Tenant lean methodology
- Overall (STATE)
- 91 Strongly Landlord-Friendly
- State Idaho
- 91 Strongly Landlord-Friendly · R+18
- County
- — inherits STATE
- City
- — inherits STATE
ZIP-level market 83605
- Home prices YoY
- -27.0%
- Rents YoY
- 2.7%
- Active inventory
- 341
- Price-to-rent
- 3.9×
Monthly cashflow live
- Estimated rent
- $1,499 high interval (Pro) →
- Mortgage (P&I)
- −$367
- Tax est. 1.5%
- −$87 /mo · $1,048/yr
- Insurance
- −$29
- HOA
- −$0
- Vacancy / Maint / Mgmt
- −$315
- Net cashflow
- $701
Break-even live
UW: 25.0% down · 7.5% · 30yr · 1.5% tax · 5.0% vac · 8.0% maint · 8.0% mgmt
Financing live
Cash to close
- Down payment
- $17,475
- Closing costs
- $2,097
- Reserves months
- —
- Total cash needed
- —
Loan-product check · same deal, 3 products live
Conventional
25% down · 7.5% · 30yr
- Down + closing
- —
- Monthly P&I
- —
- Monthly cashflow
- —
- DSCR
- —
- Eligible?
- —
Personal DTI + credit; lowest rate.
DSCR
20% down · 8.5% · 30yr
- Down + closing
- —
- Monthly P&I
- —
- Monthly cashflow
- —
- DSCR
- —
- Eligible?
- —
No personal income docs; deal must DSCR.
Hard money
10% down · 12.0% · 12mo
- Down + closing
- —
- Monthly P&I
- —
- Monthly cashflow
- —
- DSCR
- —
- Eligible?
- —
Short-term bridge; refi at stabilization.
Rent comps 19 comps
| Address | Beds | Baths | Sqft | Rent | $/sqft | DOM | Units | Dist |
|---|---|---|---|---|---|---|---|---|
| 1305 E Belmont St Unit B Caldwell, ID | 2.0 | 1.0 | 712 | $1,100 | $1.54 | 23d | 1 | 0.19mi |
| 2720 Blackfoot Ln Caldwell, ID | 2.0 | 2.0 | 940 | $1,425 | $1.52 | 19d | 1 | 0.57mi |
| 516 Rooster Ln Caldwell, ID | 2.0 | 2.0 | 940 | $1,450 | $1.54 | 2d | 1 | 0.60mi |
| 2809 Blackfoot Ln Caldwell, ID | 2.0 | 2.0 | 966 | $1,450 | $1.50 | 2d | 1 | 0.61mi |
| 511 Rooster Ln Caldwell, ID | 2.0 | 2.0 | 940 | $1,450 | $1.54 | 2d | 1 | 0.63mi |
| 616 Main St Caldwell, ID | 2.0 | 1.0 | 578 | $1,720 | $2.97 | 2d | 16 | 0.64mi |
| 1002 Everett St Caldwell, ID | 2.0 | 1.0 | 962 | $1,125 | $1.17 | 10d | 1 | 0.75mi |
| 2000 College Ave Caldwell, ID | 2.0 | 1.0 | 675 | $1,168 | $1.73 | 2d | 1 | 0.96mi |
| 2609 Red Robin Way Caldwell, ID | 3.0 | 2.0 | 936 | $1,650 | $1.76 | 11d | 1 | 1.03mi |
| 1412 N 1st Ave Caldwell, ID | 2.0 | 2.0 | 1000 | $1,400 | $1.40 | 3d | 1 | 1.06mi |
| 1110 S Kimball Ave Caldwell, ID | 2.0 | 1.0 | 1066 | $1,350 | $1.27 | 2d | 5 | 1.07mi |
| 2121 S Montana Ave Unit C Caldwell, ID | 2.0 | 2.0 | 1000 | $1,595 | $1.59 | 10d | 1 | 1.10mi |
| 2100 E Maple St Caldwell, ID | 1.0–3.0 | 1.0–1.5 | 930 | $1,350 | $1.45 | 2d | 1 | 1.14mi |
| 2003 E Linden St Unit 2 Caldwell, ID | 2.0 | 1.0 | 930 | $1,250 | $1.34 | 14d | 1 | 1.23mi |
| 2420 Robert Ave Caldwell, ID | 3.0 | 1.0 | 1100 | $1,545 | $1.40 | 23d | 1 | 1.38mi |
| 2422 Robert Ave Caldwell, ID | 2.0 | 1.0 | 796 | $1,250 | $1.57 | 23d | 1 | 1.38mi |
| 224 Sunset Landing Ln Caldwell, ID | 3.0 | 2.0 | 1112 | $1,577 | $1.42 | 10d | 1 | 1.44mi |
| 224 Sunset Landing Ln Caldwell, ID | 2.0 | 1.0 | 912 | $1,365 | $1.50 | 23d | 1 | 1.44mi |
| 304 Cliff Swallow Ave Unit 1460924P Caldwell, ID | 1.0–6.0 | 1.0–4.0 | 2050 | $5,653 | $2.76 | 3d | 2 | 1.45mi |
Listing history 22 events
-
2026-06-18days on market $69,900 Active 58 DOM
-
2026-06-17days on market $69,900 Active 57 DOM
-
2026-06-16days on market $69,900 Active 56 DOM
-
2026-06-15days on market $69,900 Active 55 DOM
-
2026-06-13days on market $69,900 Active 53 DOM
-
2026-06-13pricedays on market $69,900 Active 52 DOM
-
2026-06-10days on market $74,900 Active 50 DOM
-
2026-06-09days on market $74,900 Active 49 DOM
-
2026-06-08days on market $74,900 Active 48 DOM
-
2026-06-07days on market $74,900 Active 47 DOM
-
2026-06-03days on market $74,900 Active 43 DOM
-
2026-06-03days on market $74,900 Active 42 DOM
-
2026-06-01days on market $74,900 Active 41 DOM
-
2026-05-31days on market $74,900 Active 40 DOM
-
2026-04-21$74,900 Active
-
2023-05-17historical
-
2023-05-17price $79,000
-
2023-05-02price $85,000
-
2023-03-21$90,000 Active
-
2022-07-25soldstatus Sold 236-char remark
Show marketing remark (236 chars)
You must see to appreciate! Remodeled Manufacture Home WITH NO LAND, 2 beds, 1 bath, (it has an small bedroom added, it could be used as a 3rd bedroom. ) newer floors, doors, windows, New siding, New roof, New Ac unit, Tons of updates!
-
2022-05-26status Pending 236-char remark
Show marketing remark (236 chars)
You must see to appreciate! Remodeled Manufacture Home WITH NO LAND, 2 beds, 1 bath, (it has an small bedroom added, it could be used as a 3rd bedroom. ) newer floors, doors, windows, New siding, New roof, New Ac unit, Tons of updates!
-
2022-05-10$75,000 Active 236-char remark
Show marketing remark (236 chars)
You must see to appreciate! Remodeled Manufacture Home WITH NO LAND, 2 beds, 1 bath, (it has an small bedroom added, it could be used as a 3rd bedroom. ) newer floors, doors, windows, New siding, New roof, New Ac unit, Tons of updates!
ⓘ Source: listings_history table (triggers on properties + properties_extension) + one-shot
backfill from property_details.listing_events for pre-trigger history.
Climate risk First Street
- Flood 1/10 Low FEMA zone X (unshaded) · 0% chance over 30 yrs
- Wildfire 4/10 Moderate
- Heat 5/10 Major 7 d/yr ≥99°F today · 18 d/yr by 30 yrs out
- Wind 1/10 Low
- Air quality 7/10 Severe 11 unhealthy d/yr today · 18 by 30 yrs out
Nearby sold comps map
Loading sold comps map…
Walkable amenities ~0.75 mi
Loading nearby amenities…
Taxation est. · year 1
- Rental income
- $17,984
- − Mortgage interest
- −$3,915
- − Property taxes
- −$1,048
- − Insurance
- −$350
- − Repairs & maintenance
- −$1,439
- − Management
- −$1,439
- − Depreciation
- −$2,033
- Taxable income
- $7,760
- Est. tax owed @ 24.0%
- −$1,862
- After-tax cash flow
- $6,549/yr
For passive investors: Depreciation is non-cash, so a rental often shows a tax loss while cash-flowing — sheltering income. Rental losses are passive: they offset passive income freely, and up to $25,000/yr can offset ordinary (W-2) income if you actively participate and your MAGI is under $100k (phasing out to $0 by $150k); unused losses carry forward. On sale, claimed depreciation is recaptured at up to 25%, and gains may owe capital-gains tax (a 1031 exchange can defer both). Figures are a year-1 estimate at your 24.0% rate — not tax advice; consult a CPA.
Condition & rehab AI · 12 photos
This home is in fair condition with moderate rehab needs, featuring updated kitchen and bath, new roof and siding, and good flooring. It requires interior paint and landscaping improvements to maximize its value.
Repairs flagged
- Major interior walls/paint — paint in need of touch-up
- Major landscaping/curb appeal — overgrown yard and fence in need of maintenance
Value-add opportunities
- Resale paint interior walls — Fresh paint can make a significant difference in a home's curb appeal and overall appearance
- Both landscaping and fence maintenance — A well-maintained yard and fence can improve both the resale and rental value of a property
Renovation cost estimate screening
| Repair item | Severity | Est. cost |
|---|---|---|
| interior walls/paint · paint in need of touch-up | Major | $15,000–50,000 |
| landscaping/curb appeal · overgrown yard and fence in need of maintenance | Major | $15,000–50,000 |
| Total estimated repair cost · 2 items | $30,000–100,000 |
Value-add ROI direction
- Resale paint interior walls — Fresh paint can make a significant difference in a home's curb appeal and overall appearance ↑
- Both landscaping and fence maintenance — A well-maintained yard and fence can improve both the resale and rental value of a property ↑
ⓘ Cost ranges are severity-bucket heuristics (US national rule-of-thumb). Get contractor quotes + a written scope before underwriting a rehab budget.
Schools (NCES district)
- District
- Caldwell District
- NCES district ID
- 1600510
- Math proficiency
- 17% ▼ -11.00%
- Reading proficiency
- 31% ▼ -4.00%
- Median HH income
- $36,116
- Composite
- 19.85/100
- National rank
- #8694
- State rank
- #90 of 92 in ID
Livability — Caldwell
- Score
- 67/100
- State rank
- #88
- US rank
- #10145
Category grades
Schools grade is shown separately in the Schools card above.
Census & demographics
- Census place
- Caldwell, ID
- County
- Canyon County · 235,358 people
- City population
- 76,816
- Metro
- Boise City, ID
- Population (ZIP)
- 41,325
- Household income
- $68,427
- Rent vs Own
- Severe rent burden
- 719.0
Population outlook (Canyon County) Hauer SSP2
- Today (2025)
- 248,853 people
- By 2030
- 269,596 · +8.3%
- By 2040
- 311,081 · +25.0%
- By 2050
- 350,809 · +41.0%
- By 2075
- 441,884 · +77.6%
- By 2100
- 505,641 · +103.2%
Race, ethnicity, and origin ACS 2023
- Neighborhood character
- Diverse neighborhood (Simpson 0.56)
- Race & ethnicity
- White 51% Hispanic / Latino 42% Two or more races 15% Native American 1%
- Hispanic origin (detail)
- Mexican 36%
- Common ancestry
- Lithuanian 3% Slovak 2% Italian 2%
- Foreign-born
- 13% · Canada
- Languages at home
- 71% English-only · Spanish 27% Russian/Polish/Slavic 1%
Political lean MEDSL · Canyon
- 2024 margin
- Solid R (+46.6) · D 25.4% · R 72.0% · Other 2.5%
- 2008→2024 swing
- -11.4pp toward R · 2008: -35.2pp · 2024: -46.6pp
- All cycles
- 2024: R+46.6 2020: R+39.7 2016: R+41.8 2012: R+37.1 2008: R+35.2
Not yet ingested
- Civics
- —
Market trends
- HPI YoY
- ▼ -135.47%
- Current HPI
- 366.7896
- Rent YoY
- ▲ 2.69%
- Metro
- Boise City, ID
- State GDP YoY
- ▲ 4.51%
- F500 in state
- 6
Industry mix (Fortune 500 HQ in ID)
| Industry | F500 HQs | Revenue |
|---|---|---|
| Retail | 1 | $79B |
|
||
| Technology | 1 | $25B |
|
||
| Food / Agriculture | 1 | $6B |
|
||
Price history
-0.1% since first listed8 events — show timeline
- 2026-04-21 Listed $74,900 IMLS
- 2023-05-17 Listing Removed — IMLS
- 2023-05-17 Price Changed $79,000 IMLS
- 2023-05-02 Price Changed $85,000 IMLS
- 2023-03-21 Listed $90,000 IMLS
- 2022-07-25 Sold (MLS) — IMLS
- 2022-05-26 Pending — IMLS
- 2022-05-10 Listed $75,000 IMLS
Cash-flow waterfall
monthlySold comps — $/sqft
last 12 mo · ≤1 miLoading sold comps…