 Fourplex
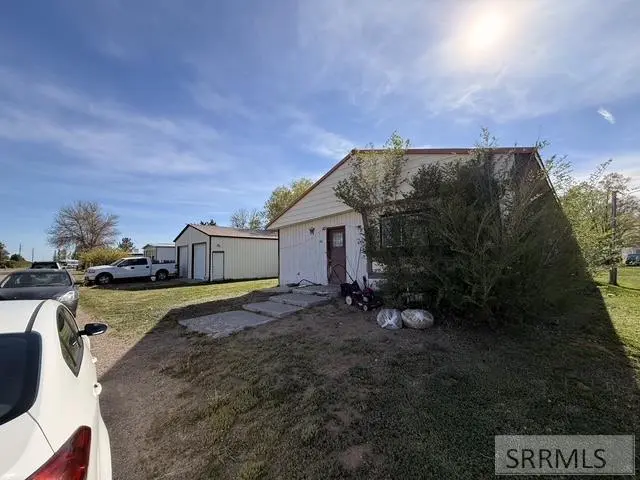
343 Thomas Ave · Dubois, ID
Flood risk 2/10 · Minimal
- FEMA flood zone
- X
- Chance of flooding over 30 yrs
- 0.09%
- Est. flood insurance / yr
- $507 – $1,088
Fire risk 8/10 · Major
- Est. fire insurance / yr
- $584 – $1,086
Heat risk 3/10 · Minor
- Hot days now (above 92°F)
- 4 days/yr
- Hot days in 30 yrs
- 11 days/yr
Wind risk 1/10 · Minimal
- Chance of severe wind over 30 yrs
- —
Air-quality risk 5/10 · Moderate
- Unhealthy air days now
- 7 days/yr
- Unhealthy air days in 30 yrs
- 8 days/yr
Risk factors via First Street. Map © Google.
Why this score? — see what drove the C grade
The composite is a weighted blend of 9 inputs, each scored 0–100. Each bar is that input's sub-score; the figure is the points it added to the 100-point composite (weight × sub-score).
- Cash flow +19.7/30.0
- Appreciation +8.3/10.0
- ARV discount +7.5/15.0
- DSCR +6.2/10.0
- 1% rule +5.2/10.0
- Livability +2.9/5.0
- Rent growth +2.5/5.0
- Schools +2.2/10.0
- Condition / age +2.2/5.0
$400,000
🖨 Deal sheet 📄 Offer letter ✓ Due diligence
Multi-family units
County records classify this as Multi-Family (2-4 Unit). Listing-text estimate: 4 units. confirmed
Listing remarks
Rare investment opportunity in Dubois, Idaho! This unique income-producing property sits on two city lots and offers multiple streams of rental income with additional upside potential. The property features a 3-bedroom, 2-bathroom double-wide manufactured home on a permanent foundation with approximately 1,600 square feet of living space and a detached 2-car garage. The home is currently rented for $625 per month. In addition, there are three tenant-owned single-wide trailers located on the property, each paying $325 per month in lot rent. All tenants pay their own utilities, helping keep operating expenses low. The trailers are not included in the sale and are owned by the individual tenan
Key facts
- Permanent foundation
- Two city lots
- 0.86 acre lot
Tags
Property features AI
Finance
- Other: Lot about 0.859 acre; Zoning not verified
- Financial info: Annual tax listed
Exterior
- Parking: Gravel parking; 2-car garage
- Utilities: Public water; Public sewer
- Home design: Residential income property; Fourplex / Quadruplex
- Construction: Wood siding construction
- Exterior features: Metal roof
Interior
- Bathrooms: Five full bathrooms
- Heating & cooling: Has heating (electric)
- Interior features: Electric heating
Neighborhood map
What this means for you Summary
Snapshot
- This is a 4 × 3-bed/?-bath units multifamily listed at $400k. Condition is rated fair.
Deal economics
- At list price, monthly cash flow is $466 ($6k/yr) — positive. Per door: $116/mo.
- The deal already cash-flows at list — no discount required.
- Meets the 1% rule at list price ($4k rent vs $400k).
- Recommended offer: $394k (1.5% below list) — sets the bar for market timing.
Location & tenants
- Location reads 58/100 on livability (#196 in ID) — a working-class tenant base; expect higher turnover. Strengths: cost of living A+, housing A+, crime B; Watch: schools F, amenities F, commute F.
- Clark County District (rural): math 10% / reading 35% proficiency, ranked #129 of 133 in ID (top 97%) — low school quality limits family demand, transient renter base, plan for 1-2y turnover.
- Market conditions: 10 active listings in the ZIP; 3 units permitted in Clark County in 2024 (0 in 5+ unit buildings).
Forward outlook
- In year one you build about $29k of equity ($3k loan paydown + $27k appreciation (6.6% local appreciation)).
- Clark County population projected at -18% by 2050 — secular population decline; favor cash flow + early exit over multi-decade hold.
- At projected returns (6.6% appreciation + 3.0% rent growth), your $112k cash investment doubles in ~3 years — after that, you're playing with house money.
- By year 2, paydown + projected appreciation supports a ~$47k cash-out refi (75% LTV) — recoverable capital for the next deal without selling this one.
Negotiation context
- It's been on market 20 days — a 2% lower offer ($394k) is reasonable based on typical stale-listing flexibility.
Risks & watch-outs
- Climate carrying-cost: severe wildfire risk — expect insurance premiums to compound above CPI over the hold.
Questions for the listing agent
- Can we see the unit-by-unit rent roll, current vacancy, and any below-market leases? What's the average tenancy length?
- What capital expenditures (roof, boiler, parking lot, exteriors) have been made in the last 5 years, and what's planned in the next 2?
- Have any recent inspections been done? Can we get a copy of the seller's disclosures and any deferred-maintenance estimates?
- Built in 1972 — when were the roof, HVAC, electrical panel, plumbing, and water heater last replaced?
- Is there a deadline driving the sale (1031 exchange, divorce, estate, relocation)? That informs how much negotiation room exists.
- Schools are F-rated, which usually means shorter tenancies and higher turnover. Who's the typical renter profile here, and what's been the actual vacancy rate?
- What's the average days-on-market for RENTAL listings here right now (not sales)? A rising rental-DOM trend means longer vacancies and softer asking-rent achievability than the comps imply.
- What's the recent tenant-quality profile in this submarket — average credit score on applications, eviction rate, late-payment / NSF rate, and stable-employment percentage? A property-management company in the area should have these aggregated.
- How much new apartment / multifamily construction is in the pipeline within 1–3 miles? Heavy new supply (>2% of stock underway) typically softens rents 12–24 months out; light construction supports rent growth.
Investment metrics
- 1% rule
- 1.02% ✓
- Cap rate
- 7.69%
- Cash-on-cash
- 4.99%
- DSCR
- 1.22
- GRM
- 8.2
CMA / ARV
No comps found within radius.
Projected returns pro-forma
6.63% appreciation · 3.0% rent growth · sell at horizon
- IRR
- 20.9%
- Equity multiple
- 2.43×
- Total profit
- $160,371
- Equity at exit
- $267,564
- IRR
- 19.8%
- Equity multiple
- 4.97×
- Total profit
- $445,194
- Equity at exit
- $499,764
Cash invested: $112,000 (down + closing). Projections, not guarantees.
Landlord ↔ Tenant lean methodology
- Overall (STATE)
- 91 Strongly Landlord-Friendly
- State Idaho
- 91 Strongly Landlord-Friendly · R+18
- County
- — inherits STATE
- City
- — inherits STATE
ZIP-level market 83423
- Home prices YoY
- 2.7%
- Active inventory
- 10
- Price-to-rent
- 32.6×
Monthly cashflow live
- Estimated rent
- $4,089 medium interval (Pro) →
- Mortgage (P&I)
- −$2,098
- Tax est. 1.5%
- −$500 /mo · $6,000/yr
- Insurance
- −$167
- HOA
- −$0
- Vacancy / Maint / Mgmt
- −$859
- Net cashflow
- $466
Break-even live
4-unit breakdown (identical units grouped — click to expand)
| Units | Beds | Baths | Est. rent |
|---|---|---|---|
| 4× units | 3 | — | $4,088 |
| #1 | 3 | — | $1,022 |
| #2 | 3 | — | $1,022 |
| #3 | 3 | — | $1,022 |
| #4 | 3 | — | $1,022 |
| Total (4 units) | $4,089 | ||
UW: 25.0% down · 7.5% · 30yr · 1.5% tax · 5.0% vac · 8.0% maint · 8.0% mgmt
Financing live
Cash to close
- Down payment
- $100,000
- Closing costs
- $12,000
- Reserves months
- —
- Total cash needed
- —
Loan-product check · same deal, 3 products live
Conventional
25% down · 7.5% · 30yr
- Down + closing
- —
- Monthly P&I
- —
- Monthly cashflow
- —
- DSCR
- —
- Eligible?
- —
Personal DTI + credit; lowest rate.
DSCR
20% down · 8.5% · 30yr
- Down + closing
- —
- Monthly P&I
- —
- Monthly cashflow
- —
- DSCR
- —
- Eligible?
- —
No personal income docs; deal must DSCR.
Hard money
10% down · 12.0% · 12mo
- Down + closing
- —
- Monthly P&I
- —
- Monthly cashflow
- —
- DSCR
- —
- Eligible?
- —
Short-term bridge; refi at stabilization.
Listing history 15 events
-
2026-06-18days on market $400,000 Active 20 DOM
-
2026-06-17days on market $400,000 Active 19 DOM
-
2026-06-16days on market $400,000 Active 18 DOM
-
2026-06-15days on market $400,000 Active 17 DOM
-
2026-06-13days on market $400,000 Active 15 DOM
-
2026-06-12days on market $400,000 Active 14 DOM
-
2026-06-09days on market $400,000 Active 11 DOM
-
2026-06-08days on market $400,000 Active 10 DOM
-
2026-06-07days on market $400,000 Active 9 DOM
-
2026-06-07days on market $400,000 Active 8 DOM
-
2026-06-04days on market $400,000 Active 5 DOM
-
2026-06-02days on market $400,000 Active 4 DOM
-
2026-06-01days on market $400,000 Active 3 DOM
-
2026-05-31days on market $400,000 Active 2 DOM
-
2026-05-29$400,000 Active
ⓘ Source: listings_history table (triggers on properties + properties_extension) + one-shot
backfill from property_details.listing_events for pre-trigger history.
Climate risk First Street
- Flood 2/10 Low FEMA zone X · 9% chance over 30 yrs
- Wildfire 8/10 Severe
- Heat 3/10 Moderate 4 d/yr ≥92°F today · 11 d/yr by 30 yrs out
- Wind 1/10 Low
- Air quality 5/10 Major 7 unhealthy d/yr today · 8 by 30 yrs out
Nearby sold comps map
Loading sold comps map…
Walkable amenities ~0.75 mi
Loading nearby amenities…
Taxation est. · year 1
- Rental income
- $49,068
- − Mortgage interest
- −$22,406
- − Property taxes
- −$6,000
- − Insurance
- −$2,000
- − Repairs & maintenance
- −$3,925
- − Management
- −$3,925
- − Depreciation
- −$11,636
- Taxable loss
- −$825
- Est. tax savings @ 24.0%
- +$198
- After-tax cash flow
- $5,790/yr
For passive investors: Depreciation is non-cash, so a rental often shows a tax loss while cash-flowing — sheltering income. Rental losses are passive: they offset passive income freely, and up to $25,000/yr can offset ordinary (W-2) income if you actively participate and your MAGI is under $100k (phasing out to $0 by $150k); unused losses carry forward. On sale, claimed depreciation is recaptured at up to 25%, and gains may owe capital-gains tax (a 1031 exchange can defer both). Figures are a year-1 estimate at your 24.0% rate — not tax advice; consult a CPA.
Condition & rehab AI · 12 photos
This multi-family property requires moderate rehabilitation, including repairs to the siding, roof, and landscaping, to improve its condition and increase its value.
Repairs flagged
- Major siding — Significant wear and tear
- Major roof — Visible signs of damage
- Major landscaping — Overgrown vegetation
Value-add opportunities
- Both paint exterior — Enhances curb appeal and resale value
- Both repair roof — Fixes major structural issue and improves value
- Both landscape — Improves curb appeal and rental value
Renovation cost estimate screening
| Repair item | Severity | Est. cost |
|---|---|---|
| siding · Significant wear and tear | Major | $15,000–50,000 |
| roof · Visible signs of damage | Major | $15,000–50,000 |
| landscaping · Overgrown vegetation | Major | $15,000–50,000 |
| Total estimated repair cost · 3 items | $45,000–150,000 |
Value-add ROI direction
- Both paint exterior — Enhances curb appeal and resale value ↑
- Both repair roof — Fixes major structural issue and improves value ↑
- Both landscape — Improves curb appeal and rental value ↑
ⓘ Cost ranges are severity-bucket heuristics (US national rule-of-thumb). Get contractor quotes + a written scope before underwriting a rehab budget.
Schools (NCES district)
- District
- Clark County District
- NCES district ID
- 1600750
- Math proficiency
- 10% ▼ -10.00%
- Reading proficiency
- 35% ▲ 5.00%
- Median HH income
- $37,414
- Composite
- 21.88/100
- National rank
- #13564
- State rank
- #129 of 133 in ID
Livability — Dubois
- Score
- 58/100
- State rank
- #196
- US rank
- #20742
Category grades
Schools grade is shown separately in the Schools card above.
Census & demographics
- Census place
- Dubois, ID
- Population (ZIP)
- 668
Population outlook (Clark County) Hauer SSP2
- Today (2025)
- 776 people
- By 2030
- 738 · -4.9%
- By 2040
- 678 · -12.6%
- By 2050
- 634 · -18.3%
- By 2075
- 463 · -40.3%
- By 2100
- 352 · -54.6%
Race, ethnicity, and origin ACS 2023
- Neighborhood character
- Diverse neighborhood (Simpson 0.57)
- Race & ethnicity
- White 57% Hispanic / Latino 32% Two or more races 7%
- Hispanic origin (detail)
- Mexican 32%
- Common ancestry
- German 11% Slovak 5% Italian 4%
- Foreign-born
- 23% · Canada
- Languages at home
- 68% English-only · Spanish 32%
Political lean MEDSL · Clark
- 2024 margin
- Solid R (+69.1) · D 15.0% · R 84.1%
- 2008→2024 swing
- -4.8pp toward R · 2008: -64.3pp · 2024: -69.1pp
- All cycles
- 2024: R+69.1 2020: R+71.7 2016: R+56.2 2012: R+51.5 2008: R+64.3
Not yet ingested
- Civics
- —
Market trends
- HPI YoY
- ▲ 6.63%
- Current HPI
- 252.1974
- Rent YoY
- —
- Metro
- —
- State GDP YoY
- ▲ 4.51%
- F500 in state
- 6
Industry mix (Fortune 500 HQ in ID)
| Industry | F500 HQs | Revenue |
|---|---|---|
| Retail | 1 | $79B |
|
||
| Technology | 1 | $25B |
|
||
| Food / Agriculture | 1 | $6B |
|
||
Price history
1 event — show timeline
- 2026-05-29 Listed $400,000 SRMLS
Cash-flow waterfall
monthlySold comps — $/sqft
last 12 mo · ≤1 miLoading sold comps…