 Triplex
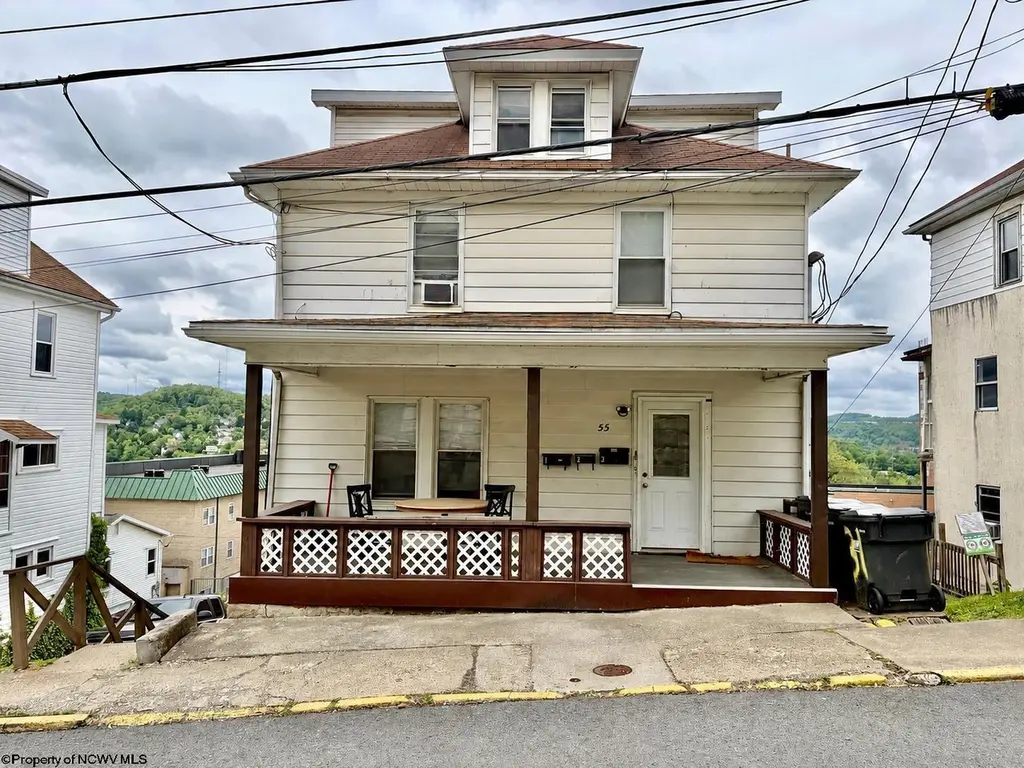
55 Jones Ave · Morgantown, WV
Flood risk 1/10 · Minimal
- FEMA flood zone
- X (unshaded)
- Chance of flooding over 30 yrs
- 0.0%
- Est. flood insurance / yr
- $473 – $860
Fire risk 1/10 · Minimal
- Est. fire insurance / yr
- $787 – $1,461
Heat risk 4/10 · Minor
- Hot days now (above 97°F)
- 7 days/yr
- Hot days in 30 yrs
- 19 days/yr
Wind risk 1/10 · Minimal
- Chance of severe wind over 30 yrs
- —
Air-quality risk 2/10 · Minimal
- Unhealthy air days now
- 0 days/yr
- Unhealthy air days in 30 yrs
- 1 days/yr
Risk factors via First Street. Map © Google.
Why this score? — see what drove the C grade
The composite is a weighted blend of 9 inputs, each scored 0–100. Each bar is that input's sub-score; the figure is the points it added to the 100-point composite (weight × sub-score).
- Cash flow +28.3/30.0
- DSCR +10.0/10.0
- 1% rule +7.0/10.0
- Livability +4.2/5.0
- Schools +4.1/10.0
- Rent growth +3.9/5.0
- Condition / age +2.5/5.0
- ARV discount +0.0/15.0
- Appreciation +0.0/10.0
$350,000
🖨 Deal sheet 📄 Offer letter ✓ Due diligence
Multi-family units
County records classify this as Multi-Family (2-4 Unit). Listing-text estimate: 3 units. confirmed
Listing remarks
Conveniently located triplex near WVU's downtown campus offers ample off street parking, common laundry, and a detached 38x32 two story garage. Don't miss out on the chance to add this income producing property to your investment portfolio! * See agent remarks *
Key facts
- Off street parking
- Common laundry
- Detached garage
Tags
Property features AI
Finance
- Other: Property used as residential income (multi-family)
Exterior
- Parking: Detached garage; On-street parking; 2 garage spaces; Rear parking access from Quay Street
- Security: Smoke detector(s)
- Utilities: Public water; Public sewer; Cable available
- Home design: Multi-family residential (2–4 family); Three-story building
- Construction: Aluminum siding; Block construction; Frame construction; Shingle roof
- Exterior features: Shingle roof; Aluminum siding, block and frame construction
Interior
- Kitchen: Refrigerator; Range
- Bedrooms: Two 1-bedroom units; One 2-bedroom unit
- Flooring: Laminate
- Bathrooms: Three full bathrooms
- Heating & cooling: Hot water heating (natural gas); Window air conditioning units
- Interior features: Balcony; Porch; Smoke detectors
- Laundry & utility: Washer; Dryer
Neighborhood map
What this means for you Summary
Snapshot
- This is a 3 × 4-bed/3.0-bath units multifamily listed at $350k.
Deal economics
- At list price, monthly cash flow is $1k ($13k/yr) — positive. Per door: $373/mo.
- The deal already cash-flows at list — no discount required.
- Meets the 1% rule at list price ($4k rent vs $350k).
- Recommended offer: $345k (1.5% below list) — sets the bar for market timing.
- Cap rate 10.1% vs local median 3.1% in Morgantown — top-decile yield for the area; either an underpriced asset or a hidden risk that comps aren't pricing in. Stress-test before assuming the spread holds.
Location & tenants
- Location reads 84/100 on livability (#5 in WV, #674 nationally) — a professional / high-income tenant draw. Strengths: amenities A+, commute A+, cost of living A+; Watch: employment D-.
- Monongalia County Schools (urban): math 45% / reading 53% proficiency, ranked #1 of 55 in WV (top 2%) — families likely to look elsewhere, expect single-tenant / working-renter base with shorter leases.
- Zoned schools: Suncrest Elementary School (math 55% / reading 54%, grade C, #29 of 377 statewide, top 10%, 567 students, 0% FRL); Suncrest Middle School (math 46% / reading 57%, grade C, #4 of 109 statewide, top 3%, 501 students, 0% FRL); Morgantown High School (math 49% / reading 73%, grade C+, #2 of 110 statewide, top 1%, 1,859 students, 0% FRL) — zoned schools average 0% FRL vs 32% district-wide (32 pts lower); this property's tenant base skews higher-income than the district average.
- Market conditions: Rents rising fast (+5.5%/yr); 119 active listings in the ZIP; 23 units permitted in Monongalia County in 2024 (15 in 5+ unit buildings).
- At $4,184/mo this rent would consume 110% of the median local household income ($46k/yr) (locally 3256% of renters already pay >50% of income on rent) — very limited rent-growth headroom before tenants either downsize or default.
Forward outlook
- Local home prices are declining (-3.0%/yr); year-one equity from $2k of loan paydown is wiped out by about $10k of value loss. Plan a longer hold.
- Monongalia County population projected at +38% by 2050 — long-run rental-demand tailwind backs the buy-and-hold thesis.
- At projected returns (-3.0% appreciation + 5.5% rent growth), your $98k cash investment doubles in ~8 years — after that, you're playing with house money.
Negotiation context
- It's been on market 29 days — a 2% lower offer ($345k) is reasonable based on typical stale-listing flexibility.
- Current owner paid $62k; list at $350k implies a 465% gain — meaningful room to come down on a strong offer.
Risks & watch-outs
- Watch-outs: built in 1917 — expect roof / HVAC / electrical / plumbing capex.
Questions for the listing agent
- Can we see the unit-by-unit rent roll, current vacancy, and any below-market leases? What's the average tenancy length?
- What capital expenditures (roof, boiler, parking lot, exteriors) have been made in the last 5 years, and what's planned in the next 2?
- Built in 1917 — when were the roof, HVAC, electrical panel, plumbing, and water heater last replaced?
- Is there a deadline driving the sale (1031 exchange, divorce, estate, relocation)? That informs how much negotiation room exists.
- Schools are D-rated, which usually means shorter tenancies and higher turnover. Who's the typical renter profile here, and what's been the actual vacancy rate?
- What's the average days-on-market for RENTAL listings here right now (not sales)? A rising rental-DOM trend means longer vacancies and softer asking-rent achievability than the comps imply.
- What's the recent tenant-quality profile in this submarket — average credit score on applications, eviction rate, late-payment / NSF rate, and stable-employment percentage? A property-management company in the area should have these aggregated.
- How much new apartment / multifamily construction is in the pipeline within 1–3 miles? Heavy new supply (>2% of stock underway) typically softens rents 12–24 months out; light construction supports rent growth.
Investment metrics
- 1% rule
- 1.20% ✓
- Cap rate
- 10.13%
- Cash-on-cash
- 13.71%
- DSCR
- 1.61
- GRM
- 7.0
CMA / ARV
- ARV (on-the-fly)
- $247,390
- Comps found
- 5
Show comp detail 5 sales within ~0.75 mi
| Address | Dist | Beds/Ba | Sqft | Sold | Price | $/sf | Match |
|---|---|---|---|---|---|---|---|
| 69 Highland Ave | 0.16mi | 4/2.0 | 2,100 (-7%) | 18mo | $230,000 | $110 | 67 |
| 445 Overhill | 0.20mi | 4/2.0 | 1,948 (-13%) | 14mo | $10,000 | $5 | 57 |
| 528 NE Grove St | 0.36mi | 5/3.0 (+1) | 1,952 (-13%) | 12mo | $220,000 | $113 | 42 |
| 250 & 252 Randolph | 0.55mi | 4/2.0 | 1,932 (-14%) | 18mo | $255,000 | $132 | 36 |
| 258 Randolph Rd | 0.56mi | 4/2.0 | 1,924 (-14%) | 20mo | $155,000 | $81 | 33 |
Match score weights: distance 35% · size 25% · config 20% · recency 20%. Top-matched comps best support the ARV.
Projected returns pro-forma
-3.0% appreciation · 5.46% rent growth · sell at horizon
- IRR
- 6.4%
- Equity multiple
- 1.26×
- Total profit
- $25,140
- Equity at exit
- $52,186
- IRR
- 17.7%
- Equity multiple
- 2.62×
- Total profit
- $159,198
- Equity at exit
- $30,262
Cash invested: $98,000 (down + closing). Projections, not guarantees.
Landlord ↔ Tenant lean methodology
- Overall (STATE)
- 83 Strongly Landlord-Friendly
- State West Virginia
- 83 Strongly Landlord-Friendly · R+22
- County
- — inherits STATE
- City
- — inherits STATE
ZIP-level market 26505
- Home prices YoY
- -31.9%
- Rents YoY
- 5.5%
- Active inventory
- 119
- Price-to-rent
- 20.9×
Monthly cashflow live
- Estimated rent
- $4,184 medium interval (Pro) →
- Mortgage (P&I)
- −$1,835
- Tax from tax record
- −$204 /mo · $2,451/yr
- Insurance
- −$146
- HOA
- −$0
- Vacancy / Maint / Mgmt
- −$879
- Net cashflow
- $1,120
Break-even live
3-unit breakdown (identical units grouped — click to expand)
| Units | Beds | Baths | Est. rent |
|---|---|---|---|
| 3× units | 4 | 3 | $4,185 |
| #1 | 4 | 3 | $1,395 |
| #2 | 4 | 3 | $1,395 |
| #3 | 4 | 3 | $1,395 |
| Total (3 units) | $4,184 | ||
UW: 25.0% down · 7.5% · 30yr · 1.5% tax · 5.0% vac · 8.0% maint · 8.0% mgmt
Financing live
Cash to close
- Down payment
- $87,500
- Closing costs
- $10,500
- Reserves months
- —
- Total cash needed
- —
Loan-product check · same deal, 3 products live
Conventional
25% down · 7.5% · 30yr
- Down + closing
- —
- Monthly P&I
- —
- Monthly cashflow
- —
- DSCR
- —
- Eligible?
- —
Personal DTI + credit; lowest rate.
DSCR
20% down · 8.5% · 30yr
- Down + closing
- —
- Monthly P&I
- —
- Monthly cashflow
- —
- DSCR
- —
- Eligible?
- —
No personal income docs; deal must DSCR.
Hard money
10% down · 12.0% · 12mo
- Down + closing
- —
- Monthly P&I
- —
- Monthly cashflow
- —
- DSCR
- —
- Eligible?
- —
Short-term bridge; refi at stabilization.
Listing history 19 events
-
2026-06-19days on market $350,000 Active 29 DOM
-
2026-06-18days on market $350,000 Active 28 DOM
-
2026-06-17days on market $350,000 Active 27 DOM
-
2026-06-16days on market $350,000 Active 26 DOM
-
2026-06-15days on market $350,000 Active 25 DOM
-
2026-06-14days on market $350,000 Active 23 DOM
-
2026-06-13days on market $350,000 Active 22 DOM
-
2026-06-10days on market $350,000 Active 20 DOM
-
2026-06-09days on market $350,000 Active 19 DOM
-
2026-06-08days on market $350,000 Active 18 DOM
-
2026-06-07days on market $350,000 Active 17 DOM
-
2026-06-05days on market $350,000 Active 14 DOM
-
2026-06-03days on market $350,000 Active 13 DOM
-
2026-06-02days on market $350,000 Active 12 DOM
-
2026-06-01days on market $350,000 Active 11 DOM
-
2026-05-31days on market $350,000 Active 10 DOM
-
2026-05-30days on market $350,000 Active 9 DOM
-
2026-05-21$350,000 Active
-
1996-11-26soldstatus $62,000
ⓘ Source: listings_history table (triggers on properties + properties_extension) + one-shot
backfill from property_details.listing_events for pre-trigger history.
Tax reassessment forecast WV · Resets to sale price
- Current annual tax
- $2,451 · $204/mo
- Projected year-2 tax
- $2,451 · $204/mo
- Expected delta
- $0/yr ($0/mo · 0.0%)
ⓘ Screening estimate from a state-policy table — verify with the county assessor before closing.
Climate risk First Street
- Flood 1/10 Low FEMA zone X (unshaded) · 0% chance over 30 yrs
- Wildfire 1/10 Low
- Heat 4/10 Moderate 7 d/yr ≥97°F today · 19 d/yr by 30 yrs out
- Wind 1/10 Low
- Air quality 2/10 Low 0 unhealthy d/yr today · 1 by 30 yrs out
Nearby sold comps map
Loading sold comps map…
Walkable amenities ~0.75 mi
Loading nearby amenities…
Taxation est. · year 1
- Rental income
- $50,208
- − Mortgage interest
- −$19,605
- − Property taxes
- −$2,451
- − Insurance
- −$1,750
- − Repairs & maintenance
- −$4,017
- − Management
- −$4,017
- − Depreciation
- −$10,182
- Taxable income
- $8,187
- Est. tax owed @ 24.0%
- −$1,965
- After-tax cash flow
- $11,474/yr
For passive investors: Depreciation is non-cash, so a rental often shows a tax loss while cash-flowing — sheltering income. Rental losses are passive: they offset passive income freely, and up to $25,000/yr can offset ordinary (W-2) income if you actively participate and your MAGI is under $100k (phasing out to $0 by $150k); unused losses carry forward. On sale, claimed depreciation is recaptured at up to 25%, and gains may owe capital-gains tax (a 1031 exchange can defer both). Figures are a year-1 estimate at your 24.0% rate — not tax advice; consult a CPA.
Schools (NCES district)
- District
- Monongalia County Schools
- NCES district ID
- 5400930
- Math proficiency
- 45% ▼ -5.00%
- Reading proficiency
- 53% ▼ -2.00%
- Median HH income
- $43,820
- Composite
- 41.34/100
- National rank
- #3503
- State rank
- #1 of 55 in WV
Livability — Morgantown
- Score
- 84/100
- State rank
- #5
- US rank
- #674
Category grades
Schools grade is shown separately in the Schools card above.
Census & demographics
- Census place
- Morgantown, WV
- County
- Monongalia County · 97,252 people
- City population
- 97,252
- Metro
- Morgantown, WV
- Population (ZIP)
- 37,492
- Household income
- $45,536
- Rent vs Own
- Severe rent burden
- 3256.0
Population outlook (Monongalia County) Hauer SSP2
- Today (2025)
- 122,188 people
- By 2030
- 131,536 · +7.7%
- By 2040
- 149,777 · +22.6%
- By 2050
- 168,245 · +37.7%
- By 2075
- 207,979 · +70.2%
- By 2100
- 239,430 · +96.0%
Race, ethnicity, and origin ACS 2023
- Neighborhood character
- Predominantly White (82%)
- Race & ethnicity
- White 82% Asian 6% Two or more races 5% Black 4% Hispanic / Latino 3%
- Common ancestry
- Romanian 5% Slovak 3% Italian 2%
- Foreign-born
- 10% · China, Canada, Vietnam
- Languages at home
- 88% English-only · Arabic 3% Other Indo-European 2% Chinese 2%
Political lean MEDSL · Monongalia
- 2024 margin
- Toss-up / Even · D 46.5% · R 50.9% · Other 2.7%
- 2008→2024 swing
- -8.2pp toward R · 2008: 3.9pp · 2024: -4.4pp
- All cycles
- 2024: R+4.4 2020: R+1.2 2016: R+10.4 2012: R+9.7 2008: D+3.9
Not yet ingested
- Civics
- —
Market trends
- HPI YoY
- ▼ -100.05%
- Current HPI
- 213.749
- Rent YoY
- ▲ 5.46%
- Metro
- Morgantown, WV
- State GDP YoY
- —
- F500 in state
- 0
Price history
+464.5% since first listed2 events — show timeline
- 2026-05-21 Listed $350,000 NCWVREIN
- 1996-11-26 Sold (Public Records) $62,000 Public Records
Property tax history
+8.5%/yrLatest (2025): $2,451 · +64.9% YoY. Source: county tax records.
Cash-flow waterfall
monthlySold comps — $/sqft
last 12 mo · ≤1 miLoading sold comps…