2334 Sanbar Rd #58 · Graford, TX
Flood risk No data
- FEMA flood zone
- —
- Chance of flooding over 30 yrs
- —
- Est. flood insurance / yr
- —
Fire risk No data
- Est. fire insurance / yr
- —
Heat risk No data
- Hot days now (above threshold)
- —
- Hot days in 30 yrs
- —
Wind risk No data
- Chance of severe wind over 30 yrs
- —
Air-quality risk No data
- Unhealthy air days now
- —
- Unhealthy air days in 30 yrs
- —
Risk factors via First Street. Map © Google.
Why this score? — see what drove the B grade
The composite is a weighted blend of 9 inputs, each scored 0–100. Each bar is that input's sub-score; the figure is the points it added to the 100-point composite (weight × sub-score).
- Cash flow +30.0/30.0
- 1% rule +10.0/10.0
- DSCR +10.0/10.0
- ARV discount +7.5/15.0
- Condition / age +3.8/5.0
- Schools +3.4/10.0
- Livability +3.2/5.0
- Rent growth +2.5/5.0
- Appreciation +0.0/10.0
$145,000
🖨 Deal sheet 📄 Offer letter ✓ Due diligence
Listing remarks MLS
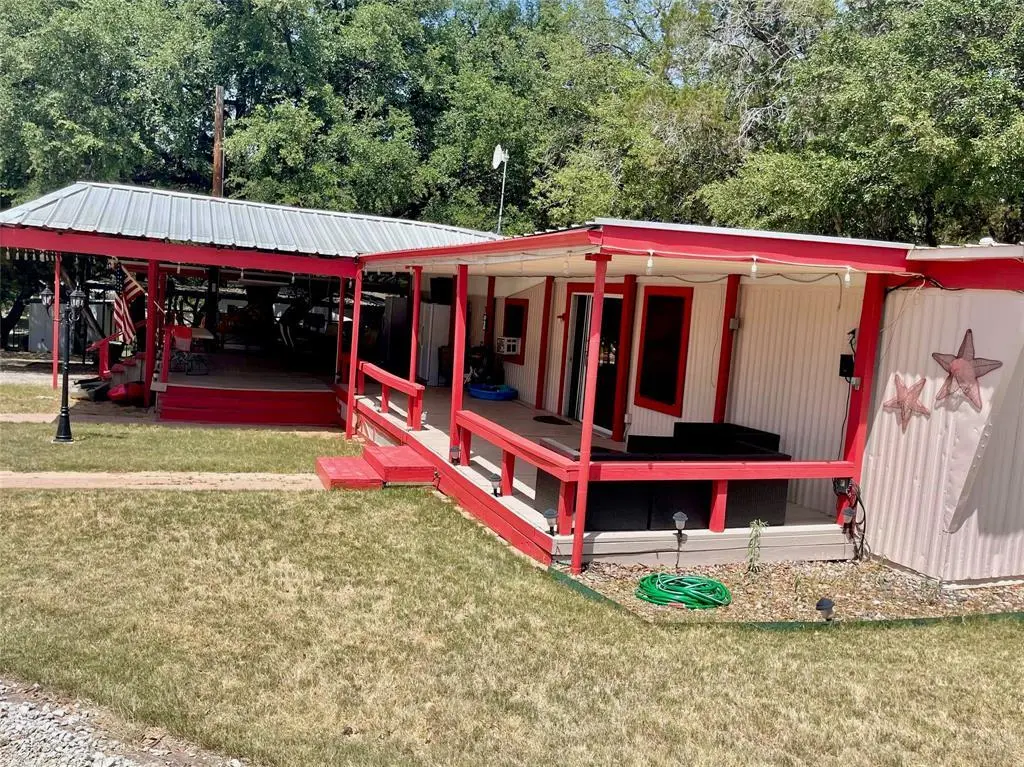
Lake fun starts with a great lake place! This PK-Get-Away has all the extras to be THE place...Large Covered Deck with a Lake View, Covered Parking with room for your boat, car, and golf cart, fenced yard for the fur babies or kiddos, bunk house, and it's Close to the Swim Cove! Inside, this home has an open concept kitchen and living area, 3 bedrooms, washer and dryer, recently upgraded bathroom, and other improvements. The Golden Cove community comes with a built-in lake family of neighbors and friends for lots of fun times such as community golf cart parades, Saturday Markets at the pavilion, porch parties, and just good old socializing! But, it also offers some true relaxation opportunities...imagine coffee on the deck as you watch the deer stroll by, or dinner at sunset on your deck, or float your cares away in the lake on a sunny, summer day! If you love to boat or enjoy water sports, Possum Kingdom Lake IS the place to be ~ with miles and miles of shoreline, crystal blue deep water, and the famed Hell's Gate it lives up to the name of The Great Lake of Texas! This is a leased land property, with a monthly lot fee of approximately $765 per month. Residents are granted access to the community boat ramp, boat dock, swim cove, and pavilion, and there are on-site storage buildings available to rent as well as rentable cabins for the overflow of guests you'll have when your friends learn about this amazing PK Getaway.
Key facts
- Open concept kitchen
- Covered parking
- Fenced yard
Tags
Neighborhood map
What this means for you Summary
Snapshot
- This is a 3-bed/1.0-bath single-family listed at $145k. Condition is rated good.
Deal economics
- At list price, monthly cash flow is $1k ($14k/yr) — positive.
- The deal already cash-flows at list — no discount required.
- Meets the 1% rule at list price ($3k rent vs $145k).
- Recommended offer: $132k (9.0% below list) — sets the bar for market timing.
- Cap rate 15.8% vs local median 1.3% in Graford — top-decile yield for the area; either an underpriced asset or a hidden risk that comps aren't pricing in. Stress-test before assuming the spread holds.
Location & tenants
- Location reads 63/100 on livability (#856 in TX) — a middle-class / working-renter tenant base. Strengths: cost of living A+, housing A+; Watch: employment C-, health & safety D+, schools D-.
- Graford ISD (rural): math 35% / reading 40% proficiency, ranked #817 of 1,141 in TX (top 72%) — families likely to look elsewhere, expect single-tenant / working-renter base with shorter leases.
- Market conditions: 465 active listings in the ZIP; 27 units permitted in Palo Pinto County in 2024 (0 in 5+ unit buildings).
Forward outlook
- Local home prices are declining (-3.0%/yr); year-one equity from $1k of loan paydown is wiped out by about $4k of value loss. Plan a longer hold.
- Palo Pinto County population projected to shrink 8% by 2050 — rents likely to lag national; underwrite the cash flow, not the appreciation.
- At projected returns (-3.0% appreciation + 3.0% rent growth), your $41k cash investment doubles in ~4 years — after that, you're playing with house money.
Negotiation context
- It's been on market 102 days — a 9% lower offer ($132k) is reasonable based on typical stale-listing flexibility.
- 4 sale attempts since 5y ago with the ask held roughly flat each time — persistent listings suggest the price (not the market) is what's stuck; bring a comps-based counter.
Questions for the listing agent
- It's been on market 102 days. Have you received any prior offers? Is the seller open to a 9% concession, seller financing, or rate buy-down credit?
- Built in 1972 — when were the roof, HVAC, electrical panel, plumbing, and water heater last replaced?
- Why hasn't it sold? Are there any deal-killer items the seller is aware of (foundation, flood, title, zoning, code violations)?
- Is there a deadline driving the sale (1031 exchange, divorce, estate, relocation)? That informs how much negotiation room exists.
- Schools are D-rated, which usually means shorter tenancies and higher turnover. Who's the typical renter profile here, and what's been the actual vacancy rate?
- Crime grade is F in this area — have there been break-ins, vandalism, or insurance claims at this property in the last 3 years? What carrier currently insures it and at what premium?
- What's the average days-on-market for RENTAL listings here right now (not sales)? A rising rental-DOM trend means longer vacancies and softer asking-rent achievability than the comps imply.
- What's the recent tenant-quality profile in this submarket — average credit score on applications, eviction rate, late-payment / NSF rate, and stable-employment percentage? A property-management company in the area should have these aggregated.
- How much new for-sale + rental construction is in the pipeline within 1–3 miles? Heavy new supply typically softens prices + rents 12–24 months out; constrained supply supports both.
Investment metrics
- 1% rule
- 1.88% ✓
- Cap rate
- 15.82%
- Cash-on-cash
- 34.03%
- DSCR
- 2.51
- GRM
- 4.4
CMA / ARV
- ARV (median comp)
- $80,217
- List price
- $145,000
- Delta
- 80.76%
- Verdict
- OVERPRICED
- Comps
- 4 within 1.0 mi
Projected returns pro-forma
-3.0% appreciation · 3.0% rent growth · sell at horizon
- IRR
- 29.4%
- Equity multiple
- 2.23×
- Total profit
- $49,866
- Equity at exit
- $21,620
- IRR
- 36.7%
- Equity multiple
- 4.40×
- Total profit
- $138,002
- Equity at exit
- $12,537
Cash invested: $40,600 (down + closing). Projections, not guarantees.
Landlord ↔ Tenant lean methodology
- Overall (STATE)
- 87 Strongly Landlord-Friendly
- State Texas
- 87 Strongly Landlord-Friendly · R+5
- County
- — inherits STATE
- City
- — inherits STATE
ZIP-level market 76449
- Home prices YoY
- -27.7%
- Active inventory
- 465
- Price-to-rent
- 4.4×
Monthly cashflow live
- Estimated rent
- $2,726 medium interval (Pro) →
- Mortgage (P&I)
- −$760
- Tax est. 1.5%
- −$181 /mo · $2,175/yr
- Insurance
- −$60
- HOA
- −$0
- Vacancy / Maint / Mgmt
- −$572
- Net cashflow
- $1,151
Break-even live
UW: 25.0% down · 7.5% · 30yr · 1.5% tax · 5.0% vac · 8.0% maint · 8.0% mgmt
Financing live
Cash to close
- Down payment
- $36,250
- Closing costs
- $4,350
- Reserves months
- —
- Total cash needed
- —
Loan-product check · same deal, 3 products live
Conventional
25% down · 7.5% · 30yr
- Down + closing
- —
- Monthly P&I
- —
- Monthly cashflow
- —
- DSCR
- —
- Eligible?
- —
Personal DTI + credit; lowest rate.
DSCR
20% down · 8.5% · 30yr
- Down + closing
- —
- Monthly P&I
- —
- Monthly cashflow
- —
- DSCR
- —
- Eligible?
- —
No personal income docs; deal must DSCR.
Hard money
10% down · 12.0% · 12mo
- Down + closing
- —
- Monthly P&I
- —
- Monthly cashflow
- —
- DSCR
- —
- Eligible?
- —
Short-term bridge; refi at stabilization.
Listing history 29 events
-
2026-06-19days on market $145,000 Active 102 DOM
-
2026-06-18days on market $145,000 Active 101 DOM
-
2026-06-17days on market $145,000 Active 100 DOM
-
2026-06-16days on market $145,000 Active 99 DOM
-
2026-06-15days on market $145,000 Active 98 DOM
-
2026-06-14days on market $145,000 Active 96 DOM
-
2026-06-12days on market $145,000 Active 95 DOM
-
2026-06-09days on market $145,000 Active 92 DOM
-
2026-06-08days on market $145,000 Active 91 DOM
-
2026-06-07days on market $145,000 Active 90 DOM
-
2026-06-05days on market $145,000 Active 88 DOM
-
2026-06-04days on market $145,000 Active 86 DOM
-
2026-06-02days on market $145,000 Active 85 DOM
-
2026-06-01days on market $145,000 Active 84 DOM
-
2026-05-31days on market $145,000 Active 83 DOM
-
2026-05-31days on market $145,000 Active 82 DOM
-
2026-03-06$145,000 Active 1443-char remark
Show marketing remark (1443 chars)
Lake fun starts with a great lake place! This PK-Get-Away has all the extras to be THE place...Large Covered Deck with a Lake View, Covered Parking with room for your boat, car, and golf cart, fenced yard for the fur babies or kiddos, bunk house, and it's Close to the Swim Cove! Inside, this home has an open concept kitchen and living area, 3 bedrooms, washer and dryer, recently upgraded bathroom, and other improvements. The Golden Cove community comes with a built-in lake family of neighbors and friends for lots of fun times such as community golf cart parades, Saturday Markets at the pavilion, porch parties, and just good old socializing! But, it also offers some true relaxation opportunities...imagine coffee on the deck as you watch the deer stroll by, or dinner at sunset on your deck, or float your cares away in the lake on a sunny, summer day! If you love to boat or enjoy water sports, Possum Kingdom Lake IS the place to be ~ with miles and miles of shoreline, crystal blue deep water, and the famed Hell's Gate it lives up to the name of The Great Lake of Texas! This is a leased land property, with a monthly lot fee of approximately $765 per month. Residents are granted access to the community boat ramp, boat dock, swim cove, and pavilion, and there are on-site storage buildings available to rent as well as rentable cabins for the overflow of guests you'll have when your friends learn about this amazing PK Getaway.
-
2026-01-31historical
-
2025-12-19price $145,000
-
2025-10-02price $165,000
-
2025-05-09$175,000 Active
-
2022-08-03soldstatus Closed
-
2022-07-22status Pending
-
2022-07-06historical Active Option Contract
-
2022-07-01$120,000 Active
-
2021-03-09soldstatus Sold
-
2021-02-26status Pending
-
2021-02-17historical Active Option Contract
-
2021-01-05$80,000 Active
ⓘ Source: listings_history table (triggers on properties + properties_extension) + one-shot
backfill from property_details.listing_events for pre-trigger history.
Nearby sold comps map
Loading sold comps map…
Walkable amenities ~0.75 mi
Loading nearby amenities…
Taxation est. · year 1
- Rental income
- $32,708
- − Mortgage interest
- −$8,122
- − Property taxes
- −$2,175
- − Insurance
- −$725
- − Repairs & maintenance
- −$2,617
- − Management
- −$2,617
- − Depreciation
- −$4,218
- Taxable income
- $12,234
- Est. tax owed @ 24.0%
- −$2,936
- After-tax cash flow
- $10,878/yr
For passive investors: Depreciation is non-cash, so a rental often shows a tax loss while cash-flowing — sheltering income. Rental losses are passive: they offset passive income freely, and up to $25,000/yr can offset ordinary (W-2) income if you actively participate and your MAGI is under $100k (phasing out to $0 by $150k); unused losses carry forward. On sale, claimed depreciation is recaptured at up to 25%, and gains may owe capital-gains tax (a 1031 exchange can defer both). Figures are a year-1 estimate at your 24.0% rate — not tax advice; consult a CPA.
Condition & rehab AI · 12 photos
This single-family home is in good condition with recent upgrades and a good location. It's ready for a fresh coat of paint and some flooring updates to maximize its value.
Value-add opportunities
- Both painting interior walls — fresh paint enhances curb appeal and interior aesthetics
- Both upgrading flooring — new flooring improves aesthetics and durability
- Both upgrading appliances — new appliances increase functionality and appeal
Renovation cost estimate screening
Value-add ROI direction
- Both painting interior walls — fresh paint enhances curb appeal and interior aesthetics ↑
- Both upgrading flooring — new flooring improves aesthetics and durability ↑
- Both upgrading appliances — new appliances increase functionality and appeal ↑
ⓘ Cost ranges are severity-bucket heuristics (US national rule-of-thumb). Get contractor quotes + a written scope before underwriting a rehab budget.
Schools (NCES district)
- District
- Graford ISD
- NCES district ID
- 4821330
- Math proficiency
- 35% ▬ 0.00%
- Reading proficiency
- 40% ▲ 10.00%
- Median HH income
- $43,275
- Composite
- 34.3/100
- National rank
- #10225
- State rank
- #817 of 1141 in TX
Livability — Graford
- Score
- 63/100
- State rank
- #856
- US rank
- #15394
Category grades
Schools grade is shown separately in the Schools card above.
Census & demographics
- Population (ZIP)
- 2,157
Population outlook (Palo Pinto County) Hauer SSP2
- Today (2025)
- 27,500 people
- By 2030
- 27,079 · -1.5%
- By 2040
- 26,135 · -5.0%
- By 2050
- 25,215 · -8.3%
- By 2075
- 23,416 · -14.9%
- By 2100
- 20,300 · -26.2%
Race, ethnicity, and origin ACS 2023
- Neighborhood character
- Predominantly White (90%)
- Race & ethnicity
- White 90% Hispanic / Latino 7% Two or more races 4%
- Hispanic origin (detail)
- Mexican 5%
- Common ancestry
- Portuguese 1% Italian 1% Serbian 1%
- Foreign-born
- 2% · Canada
- Languages at home
- 95% English-only · Spanish 4%
Political lean MEDSL · Palo Pinto
- 2024 margin
- Solid R (+67.1) · D 16.1% · R 83.2%
- 2008→2024 swing
- -18.9pp toward R · 2008: -48.2pp · 2024: -67.1pp
- All cycles
- 2024: R+67.1 2020: R+64.1 2016: R+64.1 2012: R+59.8 2008: R+48.2
Not yet ingested
- Civics
- —
Market trends
- HPI YoY
- ▼ -92.53%
- Current HPI
- 241.6435
- Rent YoY
- —
- Metro
- —
- State GDP YoY
- ▲ 3.95%
- F500 in state
- 110
Industry mix (Fortune 500 HQ in TX)
| Industry | F500 HQs | Revenue |
|---|---|---|
| Energy | 16 | $1,198B |
|
||
| Technology | 5 | $198B |
|
||
| Engineering / Construction | 4 | $72B |
|
||
| Energy Services | 3 | $60B |
|
||
| Utilities | 3 | $41B |
|
||
| Healthcare | 2 | $330B |
|
||
Price history
+81.2% since first listed13 events — show timeline
- 2026-03-06 Listed $145,000 NTREIS
- 2026-01-31 Listing Removed — NTREIS
- 2025-12-19 Price Changed $145,000 NTREIS
- 2025-10-02 Price Changed $165,000 NTREIS
- 2025-05-09 Listed $175,000 NTREIS
- 2022-08-03 Sold (MLS) — NTREIS
- 2022-07-22 Pending — NTREIS
- 2022-07-06 Contingent — NTREIS
- 2022-07-01 Listed $120,000 NTREIS
- 2021-03-09 Sold (MLS) — NTREIS
- 2021-02-26 Pending — NTREIS
- 2021-02-17 Contingent — NTREIS
- 2021-01-05 Listed $80,000 NTREIS
Cash-flow waterfall
monthlySold comps — $/sqft
last 12 mo · ≤1 miLoading sold comps…