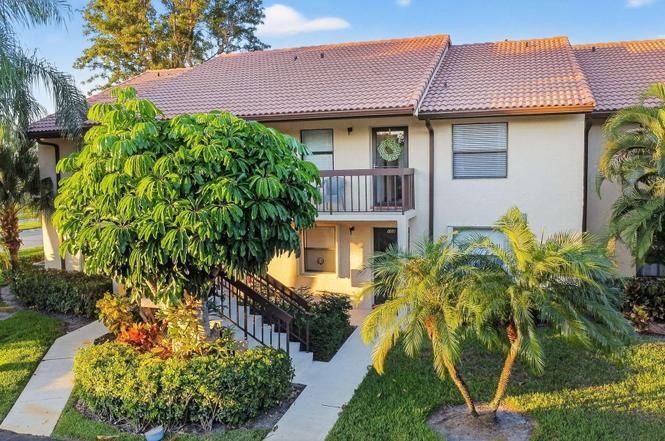
4542 Lucerne Lakes Blvd E #202 · Greenacres, FL
Flood risk 1/10 · Minimal
- FEMA flood zone
- X (unshaded)
- Chance of flooding over 30 yrs
- 0.0%
- Est. flood insurance / yr
- $507 – $1,088
Fire risk 1/10 · Minimal
- Est. fire insurance / yr
- $947 – $1,759
Heat risk 10/10 · Severe
- Hot days now (above 106°F)
- 7 days/yr
- Hot days in 30 yrs
- 27 days/yr
Wind risk 10/10 · Severe
- Chance of severe wind over 30 yrs
- 99.0%
Air-quality risk 2/10 · Minimal
- Unhealthy air days now
- 0 days/yr
- Unhealthy air days in 30 yrs
- 2 days/yr
Risk factors via First Street. Map © Google.
Why this score? — see what drove the C+ grade
The composite is a weighted blend of 9 inputs, each scored 0–100. Each bar is that input's sub-score; the figure is the points it added to the 100-point composite (weight × sub-score).
- Cash flow +25.6/30.0
- 1% rule +10.0/10.0
- DSCR +8.5/10.0
- ARV discount +7.5/15.0
- Schools +4.3/10.0
- Livability +3.5/5.0
- Condition / age +2.5/5.0
- Rent growth +2.4/5.0
- Appreciation +0.0/10.0
$140,000
🖨 Deal sheet 📄 Offer letter ✓ Due diligence
Listing remarks
Here's your opportunity to live in this light and bright 2nd floor condo (of a 2 story building) in the desirable eastern section of Lucerne's Golf Colony which offers a more private location bordering a canal, views of the Fountains golf course and a short walk to the satellite pool. Decorated nicely, freshly painted and fully furnished if desired. The largest sq ft in Golf Colony, with a vaulted clng great room, eat in kitchen and enclosed porch for expanded living. Golf Colony also has the main pool with clubhouse, spa, shuffleboard and amenities plus reasonable fees which include water, cable pkg and all exterior. Mins to shopping, restaurants, Wellington Mall/441 retail corridor &
Key facts
- Satellite pool
- Guest parking
- Second floor condo
Tags
Property features AI
Finance
- Other: Building area listed as 954 (public records)
- Financial info: Not pet-friendly; Community has 412 units
- HOA & community: Community association with monthly fee; Association amenities: clubhouse, pool, spa/hot tub, shuffleboard court, management, manager on site; Monthly association fee includes cable TV, insurance, grounds maintenance, sewer, water and recreation facility; Lucerne Lakes Golf Colony community (fee included in monthly)
Exterior
- Parking: Assigned parking (1 space); Open parking available (1 space)
- Security: Security patrol
- Utilities: Public water; Public sewer; Cable available; Sewer available; Water available
- Home design: Condominium; Multi/split levels; Faces south
- Construction: CBS construction; Spanish tile roof; 2 total stories; Built/resale condition
- Exterior features: Porch, glass-enclosed; Waterfront
Interior
- Kitchen: Disposal; Dishwasher; Electric range; Microwave; Refrigerator
- Bedrooms: 2 bedrooms on main level
- Flooring: Carpet; Ceramic tile
- Bathrooms: 2 full bathrooms on main level
- Heating & cooling: Central heating; Central air conditioning
- Interior features: Cathedral and vaulted ceilings; Entrance foyer; Walk-in closets; Split bedroom layout; Furnished
- Laundry & utility: Laundry closet inside unit
Neighborhood map
What this means for you Summary
Snapshot
- This is a 2-bed/2.0-bath condo listed at $140k.
Deal economics
- At list price, monthly cash flow is $333 ($4k/yr) — positive.
- The deal already cash-flows at list — no discount required.
- Meets the 1% rule at list price ($2k rent vs $140k).
- Recommended offer: $123k (12.0% below list) — sets the bar for market timing.
Location & tenants
- Location reads 69/100 on livability (#490 in FL) — a middle-class / working-renter tenant base. Strengths: cost of living A+, housing A+, health & safety A; Watch: employment D, amenities F, commute F.
- Palm Beach (suburban): math 46% / reading 53% proficiency, ranked #34 of 73 in FL (top 47%) — families likely to look elsewhere, expect single-tenant / working-renter base with shorter leases.
- Zoned schools: Discovery Key Elementary School (math 61% / reading 72%, grade B+, #473 of 2,144 statewide, top 23%, 1,050 students, 31% FRL); Woodlands Middle School (math 51% / reading 58%, grade B-, #183 of 571 statewide, top 34%, 1,551 students, 40% FRL) — zoned schools average 36% FRL vs 52% district-wide (16 pts lower); this property's tenant base skews higher-income than the district average.
- Market conditions: Rents soft (-0.4%/yr); 651 active listings in the ZIP; 40 comparable units currently listed for rent nearby; rentals at typical pace (median 21d on market — plan ~3-4 weeks tenant-placement turnaround); solid renter incomes; 3,974 units permitted in Palm Beach County in 2024 (1,012 in 5+ unit buildings).
Forward outlook
- Local home prices are declining (-3.0%/yr); year-one equity from $968 of loan paydown is wiped out by about $4k of value loss. Plan a longer hold.
- Palm Beach County population projected at +30% by 2050 — long-run rental-demand tailwind backs the buy-and-hold thesis.
Negotiation context
- It's been on market 185 days — a 12% lower offer ($123k) is reasonable based on typical stale-listing flexibility.
- Current owner paid $82k; list at $140k implies a 71% gain — meaningful room to come down on a strong offer.
Risks & watch-outs
- Watch-outs: HOA is 25% of rent.
- Climate carrying-cost: severe wind risk, 99% chance of damaging wind over 30y; extreme-heat days projected 7→27/yr by 2055 (HVAC capex compounding) — expect insurance premiums to compound above CPI over the hold.
Questions for the listing agent
- It's been on market 185 days. Have you received any prior offers? Is the seller open to a 12% concession, seller financing, or rate buy-down credit?
- What does the HOA fee cover, when was the last increase, and are there any pending special assessments or reserve-fund shortfalls?
- Any open or pending special assessments — roof, HVAC, plumbing, elevator, façade? What's the per-unit balance and payoff schedule, and is the seller paying it off at close or rolling it to the buyer?
- Why hasn't it sold? Are there any deal-killer items the seller is aware of (foundation, flood, title, zoning, code violations)?
- Is there a deadline driving the sale (1031 exchange, divorce, estate, relocation)? That informs how much negotiation room exists.
- Schools are D-rated, which usually means shorter tenancies and higher turnover. Who's the typical renter profile here, and what's been the actual vacancy rate?
- What's the average days-on-market for RENTAL listings here right now (not sales)? A rising rental-DOM trend means longer vacancies and softer asking-rent achievability than the comps imply.
- What's the recent tenant-quality profile in this submarket — average credit score on applications, eviction rate, late-payment / NSF rate, and stable-employment percentage? A property-management company in the area should have these aggregated.
- How much new apartment / multifamily construction is in the pipeline within 1–3 miles? Heavy new supply (>2% of stock underway) typically softens rents 12–24 months out; light construction supports rent growth.
Investment metrics
- 1% rule
- 1.56% ✓
- Cap rate
- 9.15%
- Cash-on-cash
- 10.19%
- DSCR
- 1.45
- GRM
- 5.4
CMA / ARV
No comps found within radius.
Projected returns pro-forma
-3.0% appreciation · 0.0% rent growth · sell at horizon
- IRR
- -5.4%
- Equity multiple
- 0.81×
- Total profit
- $-7,585
- Equity at exit
- $20,874
- IRR
- -1.3%
- Equity multiple
- 0.93×
- Total profit
- $-2,804
- Equity at exit
- $12,105
Cash invested: $39,200 (down + closing). Projections, not guarantees.
Landlord ↔ Tenant lean methodology
- Overall (STATE)
- 87 Strongly Landlord-Friendly
- State Florida
- 87 Strongly Landlord-Friendly · R+3
- County
- — inherits STATE
- City
- — inherits STATE
ZIP-level market 33467
- Rents YoY
- -0.4%
- Active inventory
- 651
- Price-to-rent
- 5.4×
Monthly cashflow live
- Estimated rent
- $2,179 high interval (Pro) →
- Mortgage (P&I)
- −$734
- Tax from tax record
- −$46 /mo · $551/yr
- Insurance
- −$58
- HOA
- −$550
- Vacancy / Maint / Mgmt
- −$458
- Net cashflow
- $333
Break-even live
UW: 25.0% down · 7.5% · 30yr · 1.5% tax · 5.0% vac · 8.0% maint · 8.0% mgmt
Financing live
Cash to close
- Down payment
- $35,000
- Closing costs
- $4,200
- Reserves months
- —
- Total cash needed
- —
Loan-product check · same deal, 3 products live
Conventional
25% down · 7.5% · 30yr
- Down + closing
- —
- Monthly P&I
- —
- Monthly cashflow
- —
- DSCR
- —
- Eligible?
- —
Personal DTI + credit; lowest rate.
DSCR
20% down · 8.5% · 30yr
- Down + closing
- —
- Monthly P&I
- —
- Monthly cashflow
- —
- DSCR
- —
- Eligible?
- —
No personal income docs; deal must DSCR.
Hard money
10% down · 12.0% · 12mo
- Down + closing
- —
- Monthly P&I
- —
- Monthly cashflow
- —
- DSCR
- —
- Eligible?
- —
Short-term bridge; refi at stabilization.
Rent comps 40 comps
| Address | Beds | Baths | Sqft | Rent | $/sqft | DOM | Units | Dist |
|---|---|---|---|---|---|---|---|---|
| 4598 Lucerne Lakes Blvd E #101 Lake Worth, FL | 2.0 | 2.0 | 872 | $2,250 | $2.58 | 24d | 1 | 0.09mi |
| 4598 Lucerne Lakes Blvd E #101 Lake Worth, FL | 2.0 | 2.0 | 872 | $2,250 | $2.58 | 5d | 1 | 0.09mi |
| 7101 Golf Colony Ct #102 Lake Worth, FL | 2.0 | 2.0 | 790 | $2,500 | $3.16 | 24d | 1 | 0.12mi |
| 7091 Golf Colony Ct #201 Lake Worth, FL | 2.0 | 2.0 | 735 | $1,850 | $2.52 | 14d | 1 | 0.14mi |
| 4557 Luxemburg Ct Lake Worth, FL | 2.0 | 1.5 | 1065 | $2,400 | $2.25 | 24d | 1 | 0.16mi |
| 4471 Luxemburg Ct Lake Worth, FL | 2.0 | 2.0 | 1005 | $2,150 | $2.14 | 24d | 2 | 0.16mi |
| 4471 Luxemburg Ct #101 Lake Worth, FL | 2.0 | 2.0 | 1005 | $2,300 | $2.29 | 18d | 1 | 0.16mi |
| 7149 Golf Colony Ct #104 Lake Worth, FL | 2.0 | 2.0 | 790 | $2,300 | $2.91 | 24d | 1 | 0.17mi |
| 7149 Golf Colony Ct Lake Worth, FL | 2.0 | 2.0 | 823 | $2,075 | $2.52 | 2d | 3 | 0.17mi |
| 7149 Golf Colony Ct Lake Worth, FL | 2.0 | 2.0 | 823 | $2,098 | $2.55 | 12d | 2 | 0.17mi |
| 7137 Golf Colony Ct #202 Lake Worth, FL | 2.0 | 2.0 | 735 | $1,995 | $2.71 | 15d | 1 | 0.17mi |
| 7137 Golf Colony Ct #202 Lake Worth, FL | 2.0 | 2.0 | 735 | $2,000 | $2.72 | 4d | 1 | 0.17mi |
| 4682 Lucerne Lakes Blvd E #202 Lake Worth, FL | 2.0 | 2.0 | 872 | $1,800 | $2.06 | 20d | 1 | 0.20mi |
| 4539 Luxemburg Ct Lake Worth, FL | 2.0 | 2.0 | 1027 | $2,250 | $2.19 | 5d | 1 | 0.21mi |
| 4539 Luxemburg Ct Lake Worth, FL | 2.0 | 2.0 | 1005 | $2,250 | $2.24 | 24d | 1 | 0.21mi |
| 7118 Golf Colony Ct #103 Lake Worth, FL | 2.0 | 2.0 | 790 | $1,725 | $2.18 | 24d | 1 | 0.22mi |
| 7178 Golf Colony Ct #101 Lake Worth, FL | 2.0 | 2.0 | 735 | $1,700 | $2.31 | 24d | 1 | 0.24mi |
| 4489 Luxemburg Ct #101 Lake Worth, FL | 2.0 | 2.0 | 1005 | $2,000 | $1.99 | 24d | 1 | 0.25mi |
| 7250 Golf Colony Ct #104 Lake Worth, FL | 2.0 | 2.0 | 815 | $1,985 | $2.44 | 24d | 1 | 0.25mi |
| 7257 Golf Colony Ct #203 Lake Worth, FL | 2.0 | 2.0 | 790 | $1,950 | $2.47 | 7d | 1 | 0.28mi |
| 4345 Trevi Ct #204 Lake Worth, FL | 2.0 | 2.0 | 1005 | $2,100 | $2.09 | 20d | 1 | 0.30mi |
| 7281 Golf Colony Ct #204 Lake Worth, FL | 1.0 | 1.0 | 857 | $1,450 | $1.69 | 12d | 1 | 0.32mi |
| 4363 Trevi Ct #203 Lake Worth, FL | 1.0 | 1.5 | 761 | $1,650 | $2.17 | 24d | 1 | 0.33mi |
| 4657 Fountains Dr S #206 Lake Worth, FL | 1.0 | 1.0 | 882 | $1,650 | $1.87 | 12d | 1 | 0.34mi |
| 4373 Trevi Ct Lake Worth, FL | 2.0 | 1.5 | 1080 | $2,500 | $2.31 | 17d | 1 | 0.35mi |
| 4640 Lucerne Lakes Blvd W Lake Worth, FL | 2.0 | 1.0–2.0 | 960 | $1,525 | $1.59 | 4d | 2 | 0.41mi |
| 4284 Deste Ct #304 Greenacres, FL | 1.0 | 1.0 | 716 | $2,200 | $3.07 | 17d | 1 | 0.43mi |
| 4575 Lucerne Lakes Blvd W #104 Lake Worth, FL | 1.0 | 1.0 | 900 | $1,240 | $1.38 | 12d | 1 | 0.45mi |
| 4575 Lucerne Lakes Blvd W #104 Lake Worth, FL | 1.0 | 1.0 | 900 | $1,275 | $1.42 | 7d | 1 | 0.45mi |
| 4266 Deste Ct #107 Greenacres, FL | 2.0 | 2.0 | 978 | $2,100 | $2.15 | 24d | 1 | 0.46mi |
| 4760 Lucerne Lakes Blvd W #405 Lake Worth, FL | 1.0 | 1.5 | 1000 | $1,490 | $1.49 | 24d | 1 | 0.46mi |
| 4236 Deste Ct #108 Greenacres, FL | 1.0 | 1.0 | 716 | $1,800 | $2.51 | 17d | 1 | 0.46mi |
| 4640 Lucerne Lakes Blvd W #605 Lake Worth, FL | 2.0 | 1.0 | 900 | $1,600 | $1.78 | 15d | 1 | 0.48mi |
| 4230 Deste Ct Unit 305 Greenacres, FL | 1.0 | 1.0 | 716 | $1,900 | $2.65 | 5d | 1 | 0.48mi |
| 4242 Deste Ct Unit 208 Greenacres, FL | 2.0 | 2.0 | 978 | $2,500 | $2.56 | 24d | 1 | 0.48mi |
| 4801 Esedra Ct Lake Worth, FL | 2.0 | 2.0 | 1027 | $2,075 | $2.02 | 11d | 2 | 0.51mi |
| 4801 Esedra Ct #201 Lake Worth, FL | 2.0 | 2.0 | 1005 | $2,300 | $2.29 | 24d | 1 | 0.51mi |
| 4120 Tivoli Ct #305 Lake Worth, FL | 1.0 | 1.0 | 704 | $1,750 | $2.49 | 24d | 1 | 0.52mi |
| 4254 Deste Ct #305 Greenacres, FL | 1.0 | 1.0 | 716 | $1,500 | $2.09 | 24d | 1 | 0.53mi |
| 4070 Tivoli Ct #307 Lake Worth, FL | 2.0 | 2.0 | 939 | $1,750 | $1.86 | 20d | 1 | 0.54mi |
HOA detail condo
- Monthly dues
- $550 · $6,600/yr
- Likely covers
- watercablepool
- Assessments
- None detected in remarks — confirm with the listing agent.
Listing history 17 events
-
2026-06-18days on market $140,000 Active 185 DOM
-
2026-06-17days on market $140,000 Active 184 DOM
-
2026-06-16days on market $140,000 Active 183 DOM
-
2026-06-15days on market $140,000 Active 182 DOM
-
2026-06-13days on market $140,000 Active 180 DOM
-
2026-06-10price $140,000 Active 176 DOM
-
2026-06-09days on market $149,900 Active 176 DOM
-
2026-06-07days on market $149,900 Active 174 DOM
-
2026-06-04days on market $149,900 Active 171 DOM
-
2026-06-03days on market $149,900 Active 170 DOM
-
2026-06-01days on market $149,900 Active 168 DOM
-
2026-05-31days on market $149,900 Active 167 DOM
-
2026-04-16price $149,900
-
2026-02-23price $159,000
-
2025-12-15$169,900 Active
-
2004-10-21soldstatus $82,000
-
1990-05-11soldstatus $53,500
ⓘ Source: listings_history table (triggers on properties + properties_extension) + one-shot
backfill from property_details.listing_events for pre-trigger history.
Tax reassessment forecast FL · Resets to sale price
- Current annual tax
- $551 · $46/mo
- Projected year-2 tax
- $1,162 · $97/mo
- Expected delta
- +$611/yr (+$51/mo · 110.8%)
ⓘ Screening estimate from a state-policy table — verify with the county assessor before closing.
Climate risk First Street
- Flood 1/10 Low FEMA zone X (unshaded) · 0% chance over 30 yrs
- Wildfire 1/10 Low
- Heat 10/10 Extreme 7 d/yr ≥106°F today · 27 d/yr by 30 yrs out
- Wind 10/10 Extreme 99% chance of damaging wind over 30 yrs
- Air quality 2/10 Low 0 unhealthy d/yr today · 2 by 30 yrs out
Nearby sold comps map
Loading sold comps map…
Walkable amenities ~0.75 mi
Loading nearby amenities…
Taxation est. · year 1
- Rental income
- $26,145
- − Mortgage interest
- −$7,842
- − Property taxes
- −$551
- − Insurance
- −$700
- − Repairs & maintenance
- −$2,092
- − Management
- −$2,092
- − HOA
- −$6,600
- − Depreciation
- −$4,073
- Taxable income
- $2,196
- Est. tax owed @ 24.0%
- −$527
- After-tax cash flow
- $3,466/yr
For passive investors: Depreciation is non-cash, so a rental often shows a tax loss while cash-flowing — sheltering income. Rental losses are passive: they offset passive income freely, and up to $25,000/yr can offset ordinary (W-2) income if you actively participate and your MAGI is under $100k (phasing out to $0 by $150k); unused losses carry forward. On sale, claimed depreciation is recaptured at up to 25%, and gains may owe capital-gains tax (a 1031 exchange can defer both). Figures are a year-1 estimate at your 24.0% rate — not tax advice; consult a CPA.
Schools (NCES district)
- District
- Palm Beach
- NCES district ID
- 1201500
- Math proficiency
- 46% ▼ -16.00%
- Reading proficiency
- 53% ▼ -4.00%
- Median HH income
- $53,943
- Composite
- 42.72/100
- National rank
- #3160
- State rank
- #34 of 73 in FL
Livability — Greenacres
- Score
- 69/100
- State rank
- #490
- US rank
- #9008
Category grades
Schools grade is shown separately in the Schools card above.
Census & demographics
- County
- Palm Beach County · 1,438,312 people
- City population
- 65,478
- Metro
- Miami-Fort Lauderdale-Pompano Beach, FL
- Population (ZIP)
- 58,411
- Household income
- $95,739
- Rent vs Own
- Severe rent burden
- 960.0
Population outlook (Palm Beach County) Hauer SSP2
- Today (2025)
- 1,637,487 people
- By 2030
- 1,743,255 · +6.5%
- By 2040
- 1,948,712 · +19.0%
- By 2050
- 2,132,979 · +30.3%
- By 2075
- 2,530,027 · +54.5%
- By 2100
- 2,706,979 · +65.3%
Race, ethnicity, and origin ACS 2023
- Neighborhood character
- Diverse neighborhood (Simpson 0.59)
- Race & ethnicity
- White 59% Hispanic / Latino 22% Two or more races 13% Black 10% Asian 4%
- Hispanic origin (detail)
- Mexican 2% Puerto Rican 4% Cuban 4% Dominican 2%
- Common ancestry
- Romanian 4% Scotch-Irish 3% Hispanic 3%
- Foreign-born
- 24% · Canada, Jamaica, Vietnam
- Languages at home
- 71% English-only · Spanish 17% French/Haitian/Cajun 5% Other Indo-European 3%
Political lean MEDSL · Palm Beach
- 2024 margin
- Toss-up / Even · D 50.0% · R 49.2%
- 2008→2024 swing
- -22.1pp toward R · 2008: 22.9pp · 2024: 0.8pp
- All cycles
- 2024: D+0.8 2020: D+12.8 2016: D+15.3 2012: D+17.0 2008: D+22.9
Not yet ingested
- Civics
- —
Market trends
- HPI YoY
- ▼ -288.94%
- Current HPI
- 343.7738
- Rent YoY
- ▼ -0.40%
- Metro
- Miami-Fort Lauderdale-Pompano Beach, FL
- State GDP YoY
- ▲ 3.28%
- F500 in state
- 36
Industry mix (Fortune 500 HQ in FL)
| Industry | F500 HQs | Revenue |
|---|---|---|
| Industrial Technology | 2 | $29B |
|
||
| Insurance | 2 | $17B |
|
||
| Retail | 1 | $60B |
|
||
| Technology Distribution | 1 | $58B |
|
||
| Homebuilding | 1 | $35B |
|
||
| Technology Manufacturing | 1 | $35B |
|
||
Price history
+180.2% since first listed5 events — show timeline
- 2026-04-16 Price Changed $149,900 Beaches MLS
- 2026-02-23 Price Changed $159,000 Beaches MLS
- 2025-12-15 Listed $169,900 Beaches MLS
- 2004-10-21 Sold (Public Records) $82,000 Public Records
- 1990-05-11 Sold (Public Records) $53,500 Public Records
Property tax history
+2.1%/yrLatest (2025): $551 · +5.1% YoY. Source: county tax records.
Cash-flow waterfall
monthlySold comps — $/sqft
last 12 mo · ≤1 miLoading sold comps…