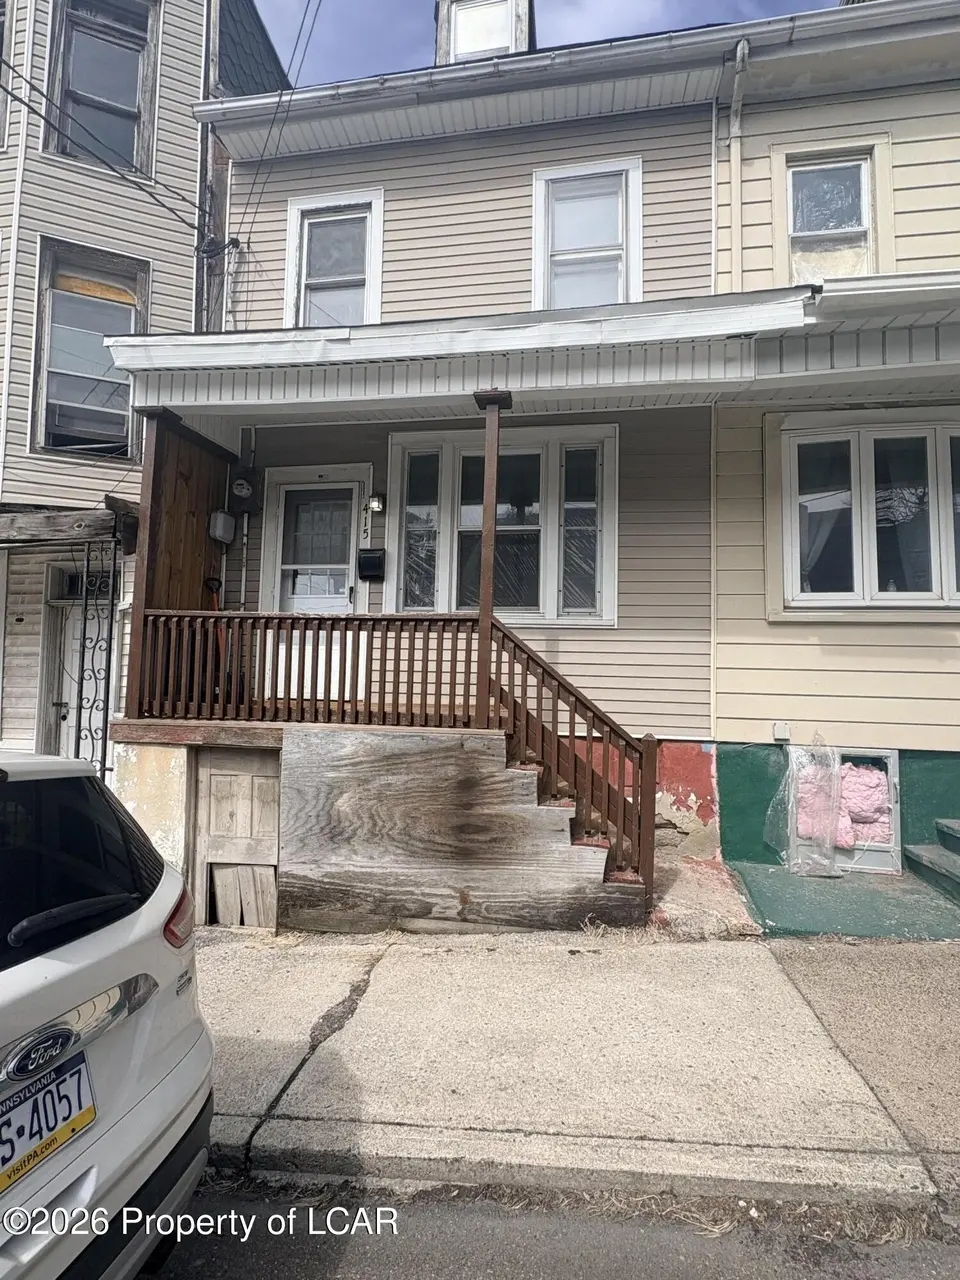
415 Cherry St · Shenandoah, PA
Flood risk 1/10 · Minimal
- FEMA flood zone
- X (unshaded)
- Chance of flooding over 30 yrs
- 0.0%
- Est. flood insurance / yr
- $473 – $860
Fire risk 3/10 · Minor
- Est. fire insurance / yr
- $511 – $949
Heat risk 3/10 · Minor
- Hot days now (above 92°F)
- 7 days/yr
- Hot days in 30 yrs
- 16 days/yr
Wind risk 4/10 · Minor
- Chance of severe wind over 30 yrs
- 8.0%
Air-quality risk 2/10 · Minimal
- Unhealthy air days now
- 1 days/yr
- Unhealthy air days in 30 yrs
- 1 days/yr
Risk factors via First Street. Map © Google.
Why this score? — see what drove the B+ grade
The composite is a weighted blend of 9 inputs, each scored 0–100. Each bar is that input's sub-score; the figure is the points it added to the 100-point composite (weight × sub-score).
- Cash flow +30.0/30.0
- 1% rule +10.0/10.0
- DSCR +10.0/10.0
- ARV discount +7.5/15.0
- Appreciation +6.9/10.0
- Livability +3.6/5.0
- Rent growth +2.5/5.0
- Condition / age +2.5/5.0
- Schools +2.4/10.0
$84,900
🖨 Deal sheet 📄 Offer letter ✓ Due diligence
Listing remarks MLS
Shenandoah: Well-maintained home featuring a spacious living and dining room combo, 3 bedrooms, and 1 full bathroom. Recently freshly painted, offering a clean and updated feel throughout. Enjoy a private backyard, perfect for relaxing or entertaining. Move-in ready and a great opportunity!
Key facts
- Private backyard
- Listed 55 days
Tags
Neighborhood map
What this means for you Summary
Snapshot
- This is a 3-bed/1.0-bath single-family listed at $85k.
Deal economics
- At list price, monthly cash flow is $569 ($7k/yr) — positive.
- The deal already cash-flows at list — no discount required.
- Meets the 1% rule at list price ($1k rent vs $85k).
- Recommended offer: $82k (3.0% below list) — sets the bar for market timing.
Location & tenants
- Location reads 71/100 on livability (#720 in PA) — a middle-class / working-renter tenant base. Strengths: amenities A+, cost of living A+, health & safety A+; Watch: schools D-, commute F, employment F.
- Shenandoah Valley SD (town): math 20% / reading 38% proficiency, ranked #454 of 539 in PA (top 84%) — low school quality limits family demand, transient renter base, plan for 1-2y turnover; 66% free/reduced lunch — lower-income household profile, screen leases tightly.
- Market conditions: 63 active listings in the ZIP; 1 comparable units currently listed for rent nearby; 169 units permitted in Schuylkill County in 2024 (0 in 5+ unit buildings).
Forward outlook
- In year one you build about $4k of equity ($587 loan paydown + $3k appreciation (3.8% local appreciation)).
- Schuylkill County population projected at -16% by 2050 — secular population decline; favor cash flow + early exit over multi-decade hold.
- At projected returns (3.8% appreciation + 3.0% rent growth), your $24k cash investment doubles in ~3 years — after that, you're playing with house money.
- By year 9, paydown + projected appreciation supports a ~$33k cash-out refi (75% LTV) — recoverable capital for the next deal without selling this one.
Negotiation context
- It's been on market 55 days — a 3% lower offer ($82k) is reasonable based on typical stale-listing flexibility.
- Current owner paid $12k; list at $85k implies a 608% gain — meaningful room to come down on a strong offer.
Risks & watch-outs
- Watch-outs: built in 1888 — expect roof / HVAC / electrical / plumbing capex.
Questions for the listing agent
- It's been on market 55 days. Have you received any prior offers? Is the seller open to a 3% concession, seller financing, or rate buy-down credit?
- Built in 1888 — when were the roof, HVAC, electrical panel, plumbing, and water heater last replaced?
- Is there a deadline driving the sale (1031 exchange, divorce, estate, relocation)? That informs how much negotiation room exists.
- Schools are D-rated, which usually means shorter tenancies and higher turnover. Who's the typical renter profile here, and what's been the actual vacancy rate?
- What's the average days-on-market for RENTAL listings here right now (not sales)? A rising rental-DOM trend means longer vacancies and softer asking-rent achievability than the comps imply.
- What's the recent tenant-quality profile in this submarket — average credit score on applications, eviction rate, late-payment / NSF rate, and stable-employment percentage? A property-management company in the area should have these aggregated.
- How much new for-sale + rental construction is in the pipeline within 1–3 miles? Heavy new supply typically softens prices + rents 12–24 months out; constrained supply supports both.
Investment metrics
- 1% rule
- 1.65% ✓
- Cap rate
- 14.34%
- Cash-on-cash
- 28.74%
- DSCR
- 2.28
- GRM
- 5.1
CMA / ARV
- ARV (median comp)
- $50,886
- List price
- $84,900
- Delta
- 66.84%
- Verdict
- OVERPRICED
- Comps
- 20 within 1.0 mi
Show comp detail 7 sales within ~0.75 mi
| Address | Dist | Beds/Ba | Sqft | Sold | Price | $/sf | Match |
|---|---|---|---|---|---|---|---|
| 332 W Columbus St | 0.06mi | 4/1.0 (+1) | 1,525 (+5%) | 23mo | $60,000 | $39 | 65 |
| 110 Penn St | 0.34mi | 4/1.0 (+1) | 1,337 (-8%) | 17mo | $60,000 | $45 | 51 |
| 252 Florida Ave | 0.70mi | 3/1.5 | 1,436 (-1%) | 15mo | $169,900 | $118 | 51 |
| 224 Ohio Ave | 0.61mi | 4/2.0 (+1) | 1,386 (-5%) | 5mo | $140,000 | $101 | 50 |
| 142 Schuylkill Ave | 0.58mi | 3/1.0 | 1,607 (+10%) | 8mo | $68,250 | $42 | 49 |
| 258 Indiana Ave | 0.65mi | 3/1.0 | 1,407 (-3%) | 23mo | $175,000 | $124 | 45 |
| 382 Ohio Ave | 0.68mi | 4/2.0 (+1) | 1,650 (+13%) | 10mo | $210,000 | $127 | 29 |
Match score weights: distance 35% · size 25% · config 20% · recency 20%. Top-matched comps best support the ARV.
Projected returns pro-forma
3.84% appreciation · 3.0% rent growth · sell at horizon
- IRR
- 36.1%
- Equity multiple
- 3.12×
- Total profit
- $50,339
- Equity at exit
- $42,274
- IRR
- 35.4%
- Equity multiple
- 6.21×
- Total profit
- $123,777
- Equity at exit
- $68,535
Cash invested: $23,772 (down + closing). Projections, not guarantees.
Landlord ↔ Tenant lean methodology
- Overall (STATE)
- 62 Landlord-Friendly
- State Pennsylvania
- 62 Landlord-Friendly · EVEN
- County
- — inherits STATE
- City
- — inherits STATE
ZIP-level market 17976
- Home prices YoY
- 1.3%
- Active inventory
- 63
- Price-to-rent
- 5.1×
Monthly cashflow live
- Estimated rent
- $1,400 medium interval (Pro) →
- Mortgage (P&I)
- −$445
- Tax from tax record
- −$56 /mo · $672/yr
- Insurance
- −$35
- HOA
- −$0
- Vacancy / Maint / Mgmt
- −$294
- Net cashflow
- $569
Break-even live
UW: 25.0% down · 7.5% · 30yr · 1.5% tax · 5.0% vac · 8.0% maint · 8.0% mgmt
Financing live
Cash to close
- Down payment
- $21,225
- Closing costs
- $2,547
- Reserves months
- —
- Total cash needed
- —
Loan-product check · same deal, 3 products live
Conventional
25% down · 7.5% · 30yr
- Down + closing
- —
- Monthly P&I
- —
- Monthly cashflow
- —
- DSCR
- —
- Eligible?
- —
Personal DTI + credit; lowest rate.
DSCR
20% down · 8.5% · 30yr
- Down + closing
- —
- Monthly P&I
- —
- Monthly cashflow
- —
- DSCR
- —
- Eligible?
- —
No personal income docs; deal must DSCR.
Hard money
10% down · 12.0% · 12mo
- Down + closing
- —
- Monthly P&I
- —
- Monthly cashflow
- —
- DSCR
- —
- Eligible?
- —
Short-term bridge; refi at stabilization.
Rent comps 1 comps
| Address | Beds | Baths | Sqft | Rent | $/sqft | DOM | Units | Dist |
|---|---|---|---|---|---|---|---|---|
| 230 W Arlington St Shenandoah, PA | 3.0 | 1.0 | 1143 | $1,400 | $1.22 | 43d | 1 | 0.25mi |
Listing history 3 events
-
2026-04-24price $84,900 291-char remark
Show marketing remark (291 chars)
Shenandoah: Well-maintained home featuring a spacious living and dining room combo, 3 bedrooms, and 1 full bathroom. Recently freshly painted, offering a clean and updated feel throughout. Enjoy a private backyard, perfect for relaxing or entertaining. Move-in ready and a great opportunity!
-
2026-04-02$94,900 Active 291-char remark
Show marketing remark (291 chars)
Shenandoah: Well-maintained home featuring a spacious living and dining room combo, 3 bedrooms, and 1 full bathroom. Recently freshly painted, offering a clean and updated feel throughout. Enjoy a private backyard, perfect for relaxing or entertaining. Move-in ready and a great opportunity!
-
1992-06-03soldstatus $12,000
ⓘ Source: listings_history table (triggers on properties + properties_extension) + one-shot
backfill from property_details.listing_events for pre-trigger history.
Tax reassessment forecast PA · Partial reset (capped growth)
- Current annual tax
- $672 · $56/mo
- Projected year-2 tax
- $1,006 · $84/mo
- Expected delta
- +$335/yr (+$28/mo · 49.9%)
ⓘ Screening estimate from a state-policy table — verify with the county assessor before closing.
Climate risk First Street
- Flood 1/10 Low FEMA zone X (unshaded) · 0% chance over 30 yrs
- Wildfire 3/10 Moderate
- Heat 3/10 Moderate 7 d/yr ≥92°F today · 16 d/yr by 30 yrs out
- Wind 4/10 Moderate 8% chance of damaging wind over 30 yrs
- Air quality 2/10 Low 1 unhealthy d/yr today · 1 by 30 yrs out
Nearby sold comps map
Loading sold comps map…
Walkable amenities ~0.75 mi
Loading nearby amenities…
Taxation est. · year 1
- Rental income
- $16,800
- − Mortgage interest
- −$4,756
- − Property taxes
- −$672
- − Insurance
- −$424
- − Repairs & maintenance
- −$1,344
- − Management
- −$1,344
- − Depreciation
- −$2,470
- Taxable income
- $5,790
- Est. tax owed @ 24.0%
- −$1,390
- After-tax cash flow
- $5,444/yr
For passive investors: Depreciation is non-cash, so a rental often shows a tax loss while cash-flowing — sheltering income. Rental losses are passive: they offset passive income freely, and up to $25,000/yr can offset ordinary (W-2) income if you actively participate and your MAGI is under $100k (phasing out to $0 by $150k); unused losses carry forward. On sale, claimed depreciation is recaptured at up to 25%, and gains may owe capital-gains tax (a 1031 exchange can defer both). Figures are a year-1 estimate at your 24.0% rate — not tax advice; consult a CPA.
Schools (NCES district)
- District
- Shenandoah Valley SD
- NCES district ID
- 4221490
- Math proficiency
- 20% ▼ -8.00%
- Reading proficiency
- 38% ▼ -6.00%
- Median HH income
- $31,968
- Composite
- 23.58/100
- National rank
- #7851
- State rank
- #454 of 539 in PA
Livability — Shenandoah
- Score
- 71/100
- State rank
- #720
- US rank
- #7134
Category grades
Schools grade is shown separately in the Schools card above.
Census & demographics
- Census place
- Shenandoah, PA
- City population
- 5,988
- Population (ZIP)
- 5,988
Population outlook (Schuylkill County) Hauer SSP2
- Today (2025)
- 137,447 people
- By 2030
- 133,121 · -3.1%
- By 2040
- 124,172 · -9.7%
- By 2050
- 115,611 · -15.9%
- By 2075
- 100,796 · -26.7%
- By 2100
- 86,667 · -36.9%
Race, ethnicity, and origin ACS 2023
- Neighborhood character
- Majority White (63%)
- Race & ethnicity
- White 63% Hispanic / Latino 34% Two or more races 12% Black 2%
- Hispanic origin (detail)
- Mexican 10% Puerto Rican 8% Dominican 11%
- Common ancestry
- Romanian 20% Iranian 2% Scotch-Irish 2%
- Foreign-born
- 10% · Canada
- Languages at home
- 68% English-only · Spanish 30% Russian/Polish/Slavic 1%
Political lean MEDSL · Schuylkill
- 2024 margin
- Solid R (+42.1) · D 28.5% · R 70.6%
- 2008→2024 swing
- -33.4pp toward R · 2008: -8.7pp · 2024: -42.1pp
- All cycles
- 2024: R+42.1 2020: R+39.9 2016: R+43.4 2012: R+13.4 2008: R+8.7
Not yet ingested
- Civics
- —
Market trends
- HPI YoY
- ▲ 3.84%
- Current HPI
- 308.8036
- Rent YoY
- —
- Metro
- —
- State GDP YoY
- ▲ 1.68%
- F500 in state
- 34
Industry mix (Fortune 500 HQ in PA)
| Industry | F500 HQs | Revenue |
|---|---|---|
| Healthcare | 2 | $309B |
|
||
| Insurance | 2 | $27B |
|
||
| Telecommunications / Media | 1 | $124B |
|
||
| Industrial Distribution | 1 | $22B |
|
||
| Financial Services | 1 | $20B |
|
||
| Chemicals / Materials | 1 | $18B |
|
||
Price history
+607.5% since first listed3 events — show timeline
- 2026-04-24 Price Changed $84,900 LCAR
- 2026-04-02 Listed $94,900 LCAR
- 1992-06-03 Sold (Public Records) $12,000 Public Records
Property tax history
+1.1%/yrLatest (2025): $672 · +3.3% YoY. Source: county tax records.
Cash-flow waterfall
monthlySold comps — $/sqft
last 12 mo · ≤1 miLoading sold comps…