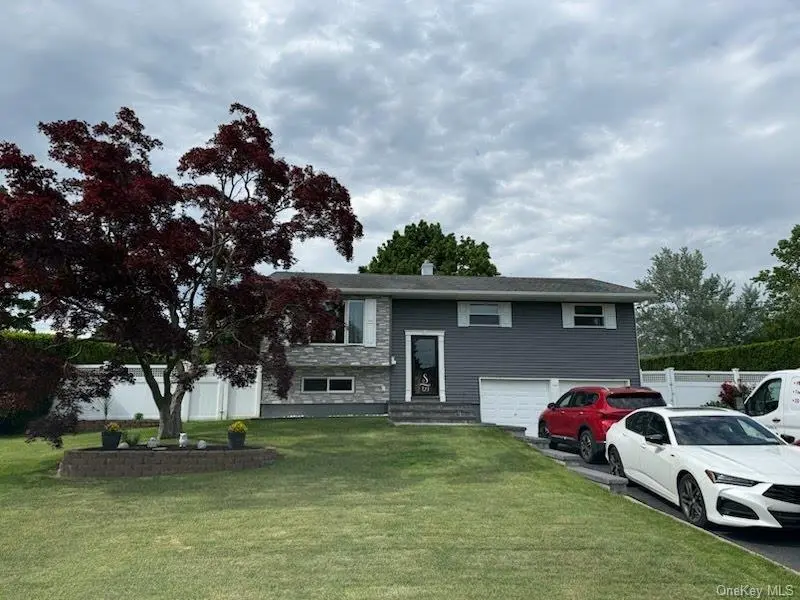
129 Sherman St · Brentwood, NY
Flood risk 1/10 · Minimal
- FEMA flood zone
- X (unshaded)
- Chance of flooding over 30 yrs
- 0.0%
- Est. flood insurance / yr
- $473 – $860
Fire risk 1/10 · Minimal
- Est. fire insurance / yr
- $691 – $1,283
Heat risk 5/10 · Moderate
- Hot days now (above 95°F)
- 7 days/yr
- Hot days in 30 yrs
- 16 days/yr
Wind risk 6/10 · Moderate
- Chance of severe wind over 30 yrs
- 75.0%
Air-quality risk 4/10 · Minor
- Unhealthy air days now
- 4 days/yr
- Unhealthy air days in 30 yrs
- 6 days/yr
Risk factors via First Street. Map © Google.
Why this score? — see what drove the D grade
The composite is a weighted blend of 9 inputs, each scored 0–100. Each bar is that input's sub-score; the figure is the points it added to the 100-point composite (weight × sub-score).
- Cash flow +15.2/30.0
- ARV discount +6.2/15.0
- DSCR +4.7/10.0
- Livability +3.8/5.0
- Schools +3.2/10.0
- 1% rule +3.1/10.0
- Rent growth +2.5/5.0
- Condition / age +2.5/5.0
- Appreciation +0.0/10.0
$690,000
🖨 Deal sheet (PDF) 📄 Offer letter ✓ Due diligence
Listing remarks
Welcome to 129 Sherman St, Brentwood, a beautifully maintained Hi-Ranch offering the perfect combination of space, comfort, and modern convenience! This impressive home features 5 spacious bedrooms and 2 full bathrooms, providing plenty of room for family, guests, or a home office setup. Step inside and discover a bright open-concept eat-in kitchen designed for both everyday living and entertaining. Gorgeous hardwood flooring adds warmth and character throughout the home. This home is enhanced with exceptional energy-efficient upgrades, including a Navien high efficiency on demand hot water heater, a Bosch 20-SEER central air conditioning system, and a Bosch 96% high-efficiency dual-fuel ga
Key facts
- Hardwood flooring
- Patio deck
- In-ground sprinklers
Tags
Property features AI
Exterior
- Parking: Attached garage; 2-car garage; Driveway; Off-street parking; On-street parking
- Utilities: Cesspool sewer; Electricity available; Natural gas available; Sewer available; Water available
- Home design: Single-family residence
- Construction: Frame construction
- Exterior features: Partial fencing; Near golf course, public transit, schools, and shops; Irrigation equipment
Interior
- Kitchen: Range; Refrigerator; Eat-in layout
- Bedrooms: Includes a first-floor bedroom
- Flooring: Hardwood floors
- Bathrooms: 2 full bathrooms
- Heating & cooling: Natural gas heating; Central air conditioning
- Interior features: First-floor bedroom; First-floor full bath; Eat-in kitchen; Washer/dryer hookup; Finished full basement; Deck and patio
- Laundry & utility: Laundry area inside (washer/dryer hookup)
Neighborhood map
What this means for you Summary
Snapshot
- This is a 5-bed/2.0-bath single-family listed at $690k.
Deal economics
- At list price, monthly cash flow is $238 ($3k/yr) — positive.
- The deal already cash-flows at list — no discount required.
- To meet the 1% rule (rent ≥ 1% of price), the offer needs to be $556k (19.5% below list).
- Recommended offer: $556k (19.5% below list) — sets the bar for 1% rule.
- Cap rate 6.7% vs local median 3.8% in Brentwood — top-decile yield for the area; either an underpriced asset or a hidden risk that comps aren't pricing in. Stress-test before assuming the spread holds.
Location & tenants
- Location reads 75/100 on livability (#242 in NY, #3,816 nationally) — a middle-class / working-renter tenant base. Strengths: commute A+, employment A+, housing A+; Watch: crime D, amenities F, cost of living F.
- Brentwood Union Free School District (suburban): math 35% / reading 35% proficiency, ranked #542 of 590 in NY (top 92%) — families likely to look elsewhere, expect single-tenant / working-renter base with shorter leases; 66% free/reduced lunch — lower-income household profile, screen leases tightly.
- Zoned schools: Twin Pines Elementary School (math 19% / reading 36%, grade F, #1,777 of 2,108 statewide, top 84%, 744 students, 86% FRL); North Middle School (math 17% / reading 38%, grade F, #576 of 729 statewide, top 79%, 1,131 students, 86% FRL); Brentwood High School (math 83% / reading 67%, grade A-, #631 of 1,100 statewide, top 58%, 4,641 students, 80% FRL) — zoned schools average 84% FRL vs 66% district-wide (18 pts higher); higher-poverty schools than district average — tighter screening recommended.
- Market conditions: 125 active listings in the ZIP; 2 comparable units currently listed for rent nearby; 1,366 units permitted in Suffolk County in 2024 (216 in 5+ unit buildings).
Forward outlook
- Local home prices are declining (-3.0%/yr); year-one equity from $5k of loan paydown is wiped out by about $21k of value loss. Plan a longer hold.
- Suffolk County population projected to shrink 5% by 2050 — rents likely to lag national; underwrite the cash flow, not the appreciation.
Negotiation context
- It's been on market 23 days — a 2% lower offer ($680k) is reasonable based on typical stale-listing flexibility.
Risks & watch-outs
- Climate carrying-cost: major wind risk, 75% chance of damaging wind over 30y; extreme-heat days projected 7→16/yr by 2055 (HVAC capex compounding) — expect insurance premiums to compound above CPI over the hold.
Questions for the listing agent
- Built in 1964 — when were the roof, HVAC, electrical panel, plumbing, and water heater last replaced?
- Is there a deadline driving the sale (1031 exchange, divorce, estate, relocation)? That informs how much negotiation room exists.
- Schools are F-rated, which usually means shorter tenancies and higher turnover. Who's the typical renter profile here, and what's been the actual vacancy rate?
- Crime grade is D in this area — have there been break-ins, vandalism, or insurance claims at this property in the last 3 years? What carrier currently insures it and at what premium?
- The area grade is low — what's the realistic commute time and amenity access for the typical tenant pool here? Any planned neighborhood developments (good or bad) we should know about?
- What's the average days-on-market for RENTAL listings here right now (not sales)? A rising rental-DOM trend means longer vacancies and softer asking-rent achievability than the comps imply.
- What's the recent tenant-quality profile in this submarket — average credit score on applications, eviction rate, late-payment / NSF rate, and stable-employment percentage? A property-management company in the area should have these aggregated.
- How much new for-sale + rental construction is in the pipeline within 1–3 miles? Heavy new supply typically softens prices + rents 12–24 months out; constrained supply supports both.
Investment metrics
- 1% rule
- 0.81% ✗
- Cap rate
- 6.71%
- Cash-on-cash
- 1.48%
- DSCR
- 1.07
- GRM
- 10.3
CMA / ARV
- ARV (on-the-fly)
- $670,800
- Comps found
- 7
Show comp detail 7 sales within ~0.75 mi
| Address | Dist | Beds/Ba | Sqft | Sold | Price | $/sf | Match |
|---|---|---|---|---|---|---|---|
| 30 Mindres Ave | 0.57mi | 6/3.0 (+1) | 2,300 (+3%) | 7mo | $525,000 | $228 | 54 |
| 31 Perry St | 0.70mi | 5/2.0 | 2,386 (+7%) | 4mo | $615,000 | $258 | 52 |
| 332 Crooked Hill Rd | 0.58mi | 5/3.0 | 2,200 (-2%) | 18mo | $660,000 | $300 | 51 |
| 40 Monroe Ave | 0.75mi | 5/3.5 | 2,192 (-2%) | 9mo | $690,000 | $315 | 48 |
| 206 Jefferson Ave | 0.60mi | 6/4.0 (+1) | 2,200 (-2%) | 12mo | $720,000 | $327 | 46 |
| 236 Sherman St | 0.70mi | 5/2.5 | 2,000 (-11%) | 10mo | $690,000 | $345 | 40 |
| 53 Rutledge St | 0.72mi | 6/2.0 (+1) | 1,972 (-12%) | 23mo | $545,000 | $276 | 23 |
Match score weights: distance 35% · size 25% · config 20% · recency 20%. Top-matched comps best support the ARV.
Projected returns pro-forma
-3.0% appreciation · 3.0% rent growth · sell at horizon
- IRR
- -14.0%
- Equity multiple
- 0.50×
- Total profit
- $-96,965
- Equity at exit
- $102,881
- IRR
- -5.3%
- Equity multiple
- 0.66×
- Total profit
- $-66,138
- Equity at exit
- $59,659
Cash invested: $193,200 (down + closing). Projections, not guarantees.
Landlord ↔ Tenant lean methodology
- Overall (STATE)
- 15 Strongly Tenant-Friendly
- State New York
- 15 Strongly Tenant-Friendly · D+10
- County
- — inherits STATE
- City
- — inherits STATE
ZIP-level market 11717
- Active inventory
- 125
- Price-to-rent
- 10.3×
Monthly cashflow live
- Estimated rent
- $5,557 medium interval (Pro) →
- Mortgage (P&I)
- −$3,618
- Tax from tax record
- −$246 /mo · $2,956/yr
- Insurance
- −$288
- HOA
- −$0
- Vacancy / Maint / Mgmt
- −$1,167
- Net cashflow
- $238
Break-even live
Sensitivity live
| Price | -10% $628 | -5% $433 | +0% $238 | +5% $42 | +10% $-153 |
|---|---|---|---|---|---|
| Rent | -10% $-201 | -5% $18 | +0% $238 | +5% $457 | +10% $677 |
| Rate | -1.0pp $585 | -0.5pp $413 | base $238 | +0.5pp $59 | +1.0pp $-123 |
UW: 25.0% down · 7.5% · 30yr · 1.5% tax · 5.0% vac · 8.0% maint · 8.0% mgmt
Financing live
Cash to close
- Down payment
- $172,500
- Closing costs
- $20,700
- Reserves months
- —
- Total cash needed
- —
Loan-product check · same deal, 3 products live
Conventional
25% down · 7.5% · 30yr
- Down + closing
- —
- Monthly P&I
- —
- Monthly cashflow
- —
- DSCR
- —
- Eligible?
- —
Personal DTI + credit; lowest rate.
DSCR
20% down · 8.5% · 30yr
- Down + closing
- —
- Monthly P&I
- —
- Monthly cashflow
- —
- DSCR
- —
- Eligible?
- —
No personal income docs; deal must DSCR.
Hard money
10% down · 12.0% · 12mo
- Down + closing
- —
- Monthly P&I
- —
- Monthly cashflow
- —
- DSCR
- —
- Eligible?
- —
Short-term bridge; refi at stabilization.
Rent comps 2 comps
| Address | Beds | Baths | Sqft | Rent | $/sqft | DOM | Units | Dist |
|---|---|---|---|---|---|---|---|---|
| 32 Grant Ave Brentwood, NY | 5.0 | 3.0 | 2274 | $5,800 | $2.55 | 24d | 1 | 0.68mi |
| 1524 Express Dr S Brentwood, NY | 4.0 | 3.0 | 1440 | $4,750 | $3.30 | 21d | 1 | 1.48mi |
Listing history 15 events
-
2026-06-21days on market $690,000 Active 23 DOM
-
2026-06-18days on market $690,000 Active 20 DOM
-
2026-06-17days on market $690,000 Active 19 DOM
-
2026-06-16days on market $690,000 Active 18 DOM
-
2026-06-15days on market $690,000 Active 17 DOM
-
2026-06-13days on market $690,000 Active 15 DOM
-
2026-06-13days on market $690,000 Active 14 DOM
-
2026-06-09days on market $690,000 Active 11 DOM
-
2026-06-08days on market $690,000 Active 10 DOM
-
2026-06-07days on market $690,000 Active 9 DOM
-
2026-06-04days on market $690,000 Active 6 DOM
-
2026-06-03days on market $690,000 Active 5 DOM
-
2026-06-02days on market $690,000 Active 4 DOM
-
2026-06-01days on market $690,000 Active 3 DOM
-
2026-05-31days on market $690,000 Active 2 DOM
ⓘ Source: listings_history table (triggers on properties + properties_extension) + one-shot
backfill from property_details.listing_events for pre-trigger history.
Tax reassessment forecast NY · Partial reset (capped growth)
- Current annual tax
- $2,956 · $246/mo
- Projected year-2 tax
- $7,309 · $609/mo
- Expected delta
- +$4,352/yr (+$363/mo · 147.2%)
ⓘ Screening estimate from a state-policy table — verify with the county assessor before closing.
Climate risk First Street
- Flood 1/10 Low FEMA zone X (unshaded) · 0% chance over 30 yrs
- Wildfire 1/10 Low
- Heat 5/10 Major 7 d/yr ≥95°F today · 16 d/yr by 30 yrs out
- Wind 6/10 Major 75% chance of damaging wind over 30 yrs
- Air quality 4/10 Moderate 4 unhealthy d/yr today · 6 by 30 yrs out
Nearby sold comps map
Loading sold comps map…
Walkable amenities ~0.75 mi
Loading nearby amenities…
Taxation est. · year 1
- Rental income
- $66,684
- − Mortgage interest
- −$38,651
- − Property taxes
- −$2,956
- − Insurance
- −$3,450
- − Repairs & maintenance
- −$5,335
- − Management
- −$5,335
- − Depreciation
- −$20,073
- Taxable loss
- −$9,116
- Est. tax savings @ 24.0%
- +$2,188
- After-tax cash flow
- $5,040/yr
For passive investors: Depreciation is non-cash, so a rental often shows a tax loss while cash-flowing — sheltering income. Rental losses are passive: they offset passive income freely, and up to $25,000/yr can offset ordinary (W-2) income if you actively participate and your MAGI is under $100k (phasing out to $0 by $150k); unused losses carry forward. On sale, claimed depreciation is recaptured at up to 25%, and gains may owe capital-gains tax (a 1031 exchange can defer both). Figures are a year-1 estimate at your 24.0% rate — not tax advice; consult a CPA.
Schools (NCES district)
- District
- Brentwood Union Free School District
- NCES district ID
- 3605280
- Math proficiency
- 35% ▼ -8.00%
- Reading proficiency
- 35% ▼ -3.00%
- Median HH income
- $71,840
- Composite
- 32.44/100
- National rank
- #5722
- State rank
- #542 of 590 in NY
Livability — Brentwood
- Score
- 75/100
- State rank
- #242
- US rank
- #3816
Category grades
Schools grade is shown separately in the Schools card above.
Census & demographics
- Census place
- Brentwood, NY
Population outlook (Suffolk County) Hauer SSP2
- Today (2025)
- 1,505,262 people
- By 2030
- 1,498,318 · -0.5%
- By 2040
- 1,471,101 · -2.3%
- By 2050
- 1,424,848 · -5.3%
- By 2075
- 1,337,157 · -11.2%
- By 2100
- 1,217,720 · -19.1%
Not yet ingested
- Political lean
- —
- Race & ethnicity
- —
- Common origin
- —
- Civics
- —
Market trends
- HPI YoY
- ▼ -380.71%
- Current HPI
- 391.2532
- Rent YoY
- —
- Metro
- —
- State GDP YoY
- ▲ 2.60%
- F500 in state
- 92
Industry mix (Fortune 500 HQ in NY)
| Industry | F500 HQs | Revenue |
|---|---|---|
| Financial Services | 10 | $950B |
|
||
| Consumer Goods | 9 | $162B |
|
||
| Insurance | 4 | $225B |
|
||
| Telecommunications | 2 | $144B |
|
||
| Pharmaceuticals | 2 | $112B |
|
||
| Media / Entertainment | 2 | $69B |
|
||
Price history
1 event — show timeline
- 2026-05-29 Listed $690,000 OneKey® MLS as Distributed by MLS Grid
Property tax history
+2.1%/yrLatest (2017): $2,956 · +0.6% YoY. Source: county tax records.
Cash-flow waterfall
monthlySold comps — $/sqft
last 12 mo · ≤1 miLoading sold comps…