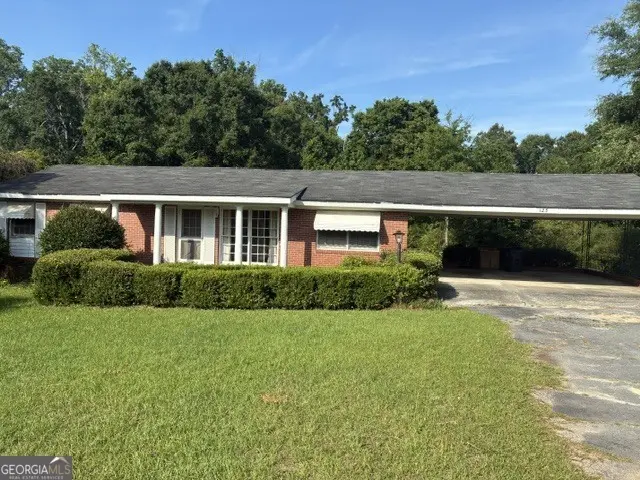
123 Colony Farm Rd · Milledgeville, GA
Flood risk 1/10 · Minimal
- FEMA flood zone
- X (unshaded)
- Chance of flooding over 30 yrs
- 0.0%
- Est. flood insurance / yr
- $507 – $1,088
Fire risk 4/10 · Minor
- Est. fire insurance / yr
- $963 – $1,789
Heat risk 7/10 · Major
- Hot days now (above 108°F)
- 7 days/yr
- Hot days in 30 yrs
- 17 days/yr
Wind risk 6/10 · Moderate
- Chance of severe wind over 30 yrs
- 65.0%
Air-quality risk 3/10 · Minor
- Unhealthy air days now
- 3 days/yr
- Unhealthy air days in 30 yrs
- 3 days/yr
Risk factors via First Street. Map © Google.
Why this score? — see what drove the C+ grade
The composite is a weighted blend of 9 inputs, each scored 0–100. Each bar is that input's sub-score; the figure is the points it added to the 100-point composite (weight × sub-score).
- Cash flow +24.6/30.0
- ARV discount +12.8/15.0
- DSCR +7.9/10.0
- 1% rule +5.8/10.0
- Rent growth +3.5/5.0
- Livability +3.4/5.0
- Condition / age +2.5/5.0
- Schools +1.4/10.0
- Appreciation +0.0/10.0
$129,500
🖨 Deal sheet 📄 Offer letter ✓ Due diligence
Listing remarks
Nice 3 bedroom 1 bath brick home in SE Baldwin County. Big 1 acre lot with double carport. Hardwood floors and nice kitchen. This is a great price for a stick-built home in Milledgeville!
Key facts
- Double carport
- Brick home
- 1 acre lot
Tags
Property features AI
Finance
- Other: Property sits on approximately 1 acre; Located at 123 Colony Farm Rd, Milledgeville, GA 31061
- HOA & community: No HOA
Exterior
- Parking: Attached carport
- Utilities: Public water; Septic tank sewer; Cable available; Phone available; Water available
- Home design: Single-family house; Built in 1964
- Construction: Brick construction; Composition roof; Crawl space foundation
- Exterior features: Level lot; Cable, phone, and water available
Interior
- Kitchen: Refrigerator included
- Bedrooms: Three bedrooms on the main level
- Flooring: Hardwood floors; Vinyl flooring
- Bathrooms: One full bathroom on the main level
- Heating & cooling: Central heating; Central air conditioning
- Interior features: One-level living; Public-record living area (1372); Crawl space basement; Resale condition
- Laundry & utility: Laundry located in the kitchen
Neighborhood map
What this means for you Summary
Snapshot
- This is a 3-bed/1.0-bath single-family listed at $130k.
Deal economics
- At list price, monthly cash flow is $267 ($3k/yr) — positive.
- The deal already cash-flows at list — no discount required.
- Meets the 1% rule at list price ($1k rent vs $130k).
- Cap rate 8.8% vs local median 2.9% in Milledgeville — top-decile yield for the area; either an underpriced asset or a hidden risk that comps aren't pricing in. Stress-test before assuming the spread holds.
Location & tenants
- Location reads 68/100 on livability (#134 in GA) — a middle-class / working-renter tenant base. Strengths: cost of living A+, health & safety A+, housing A-; Watch: amenities D+, crime F, commute F.
- Baldwin County (town): math 13% / reading 20% proficiency, ranked #152 of 174 in GA (top 87%) — low school quality limits family demand, transient renter base, plan for 1-2y turnover; 72% free/reduced lunch — lower-income household profile, screen leases tightly.
- Zoned schools: Lakeview Primary (835 students, 89% FRL); Oak Hill Ms (math 13% / reading 24%, grade F, #372 of 470 statewide, top 80%, 986 students, 89% FRL); Baldwin High School (math 10% / reading 21%, grade F, #290 of 424 statewide, top 69%, 1,311 students, 89% FRL) — zoned schools average 89% FRL vs 72% district-wide (17 pts higher); higher-poverty schools than district average — tighter screening recommended.
- Market conditions: Rents rising fast (+4.0%/yr); 375 active listings in the ZIP; 1 comparable units currently listed for rent nearby; 202 units permitted in Baldwin County in 2024 (12 in 5+ unit buildings).
- This rent runs 31% of the median local income ($54k/yr) — at the standard rent-burdened threshold; future hikes will face affordability resistance.
Forward outlook
- Local home prices are declining (-3.0%/yr); year-one equity from $895 of loan paydown is wiped out by about $4k of value loss. Plan a longer hold.
- Baldwin County population projected to shrink 8% by 2050 — rents likely to lag national; underwrite the cash flow, not the appreciation.
Negotiation context
- Only 13 days on market — expect competitive offers; lowballing is unlikely to land.
Risks & watch-outs
- Climate carrying-cost: major wind risk, 65% chance of damaging wind over 30y; extreme-heat days projected 7→17/yr by 2055 (HVAC capex compounding) — expect insurance premiums to compound above CPI over the hold.
Questions for the listing agent
- Built in 1964 — when were the roof, HVAC, electrical panel, plumbing, and water heater last replaced?
- Is there a deadline driving the sale (1031 exchange, divorce, estate, relocation)? That informs how much negotiation room exists.
- Schools are F-rated, which usually means shorter tenancies and higher turnover. Who's the typical renter profile here, and what's been the actual vacancy rate?
- Crime grade is F in this area — have there been break-ins, vandalism, or insurance claims at this property in the last 3 years? What carrier currently insures it and at what premium?
- What's the average days-on-market for RENTAL listings here right now (not sales)? A rising rental-DOM trend means longer vacancies and softer asking-rent achievability than the comps imply.
- What's the recent tenant-quality profile in this submarket — average credit score on applications, eviction rate, late-payment / NSF rate, and stable-employment percentage? A property-management company in the area should have these aggregated.
- How much new for-sale + rental construction is in the pipeline within 1–3 miles? Heavy new supply typically softens prices + rents 12–24 months out; constrained supply supports both.
Investment metrics
- 1% rule
- 1.08% ✓
- Cap rate
- 8.77%
- Cash-on-cash
- 8.85%
- DSCR
- 1.39
- GRM
- 7.7
CMA / ARV
- ARV (on-the-fly)
- $146,625
- Comps found
- 1
Show comp detail 1 sale within ~0.75 mi
| Address | Dist | Beds/Ba | Sqft | Sold | Price | $/sf | Match |
|---|---|---|---|---|---|---|---|
| 102 Colony Farm Rd SW | 0.21mi | 3/1.0 | 1,192 (-6%) | 19mo | $136,500 | $115 | 63 |
Match score weights: distance 35% · size 25% · config 20% · recency 20%. Top-matched comps best support the ARV.
Projected returns pro-forma
-3.0% appreciation · 4.05% rent growth · sell at horizon
- IRR
- -1.8%
- Equity multiple
- 0.93×
- Total profit
- $-2,481
- Equity at exit
- $19,309
- IRR
- 8.9%
- Equity multiple
- 1.72×
- Total profit
- $25,964
- Equity at exit
- $11,197
Cash invested: $36,260 (down + closing). Projections, not guarantees.
Landlord ↔ Tenant lean methodology
- Overall (STATE)
- 90 Strongly Landlord-Friendly
- State Georgia
- 90 Strongly Landlord-Friendly · R+3
- County
- — inherits STATE
- City
- — inherits STATE
ZIP-level market 31061
- Home prices YoY
- -29.9%
- Rents YoY
- 4.0%
- Active inventory
- 375
- Price-to-rent
- 7.7×
Monthly cashflow live
- Estimated rent
- $1,399 medium interval (Pro) →
- Mortgage (P&I)
- −$679
- Tax from tax record
- −$104 /mo · $1,254/yr
- Insurance
- −$54
- HOA
- −$0
- Vacancy / Maint / Mgmt
- −$294
- Net cashflow
- $267
Break-even live
UW: 25.0% down · 7.5% · 30yr · 1.5% tax · 5.0% vac · 8.0% maint · 8.0% mgmt
Financing live
Cash to close
- Down payment
- $32,375
- Closing costs
- $3,885
- Reserves months
- —
- Total cash needed
- —
Loan-product check · same deal, 3 products live
Conventional
25% down · 7.5% · 30yr
- Down + closing
- —
- Monthly P&I
- —
- Monthly cashflow
- —
- DSCR
- —
- Eligible?
- —
Personal DTI + credit; lowest rate.
DSCR
20% down · 8.5% · 30yr
- Down + closing
- —
- Monthly P&I
- —
- Monthly cashflow
- —
- DSCR
- —
- Eligible?
- —
No personal income docs; deal must DSCR.
Hard money
10% down · 12.0% · 12mo
- Down + closing
- —
- Monthly P&I
- —
- Monthly cashflow
- —
- DSCR
- —
- Eligible?
- —
Short-term bridge; refi at stabilization.
Rent comps 1 comps
| Address | Beds | Baths | Sqft | Rent | $/sqft | DOM | Units | Dist |
|---|---|---|---|---|---|---|---|---|
| 154 Old Stage Dr SW Milledgeville, GA | 3.0 | 2.0 | 1152 | $1,300 | $1.13 | 43d | 1 | 0.79mi |
Listing history 7 events
-
2026-06-05statusdays on market $129,500 Under Contract 13 DOM
-
2026-06-03days on market $129,500 New 12 DOM
-
2026-06-02days on market $129,500 New 11 DOM
-
2026-06-01days on market $129,500 New 10 DOM
-
2026-05-31days on market $129,500 New 9 DOM
-
2026-05-30days on market $129,500 New 8 DOM
-
2026-05-22$129,500 New
ⓘ Source: listings_history table (triggers on properties + properties_extension) + one-shot
backfill from property_details.listing_events for pre-trigger history.
Tax reassessment forecast GA · Resets to sale price
- Current annual tax
- $1,254 · $104/mo
- Projected year-2 tax
- $1,254 · $104/mo
- Expected delta
- $0/yr ($0/mo · 0.0%)
ⓘ Screening estimate from a state-policy table — verify with the county assessor before closing.
Climate risk First Street
- Flood 1/10 Low FEMA zone X (unshaded) · 0% chance over 30 yrs
- Wildfire 4/10 Moderate
- Heat 7/10 Severe 7 d/yr ≥108°F today · 17 d/yr by 30 yrs out
- Wind 6/10 Major 65% chance of damaging wind over 30 yrs
- Air quality 3/10 Moderate 3 unhealthy d/yr today · 3 by 30 yrs out
Nearby sold comps map
Loading sold comps map…
Walkable amenities ~0.75 mi
Loading nearby amenities…
Taxation est. · year 1
- Rental income
- $16,783
- − Mortgage interest
- −$7,254
- − Property taxes
- −$1,254
- − Insurance
- −$648
- − Repairs & maintenance
- −$1,343
- − Management
- −$1,343
- − Depreciation
- −$3,767
- Taxable income
- $1,175
- Est. tax owed @ 24.0%
- −$282
- After-tax cash flow
- $2,926/yr
For passive investors: Depreciation is non-cash, so a rental often shows a tax loss while cash-flowing — sheltering income. Rental losses are passive: they offset passive income freely, and up to $25,000/yr can offset ordinary (W-2) income if you actively participate and your MAGI is under $100k (phasing out to $0 by $150k); unused losses carry forward. On sale, claimed depreciation is recaptured at up to 25%, and gains may owe capital-gains tax (a 1031 exchange can defer both). Figures are a year-1 estimate at your 24.0% rate — not tax advice; consult a CPA.
Schools (NCES district)
- District
- Baldwin County
- NCES district ID
- 1300210
- Math proficiency
- 13% ▼ -8.00%
- Reading proficiency
- 20% ▼ -5.00%
- Median HH income
- $35,615
- Composite
- 13.61/100
- National rank
- #9508
- State rank
- #152 of 174 in GA
Livability — Milledgeville
- Score
- 68/100
- State rank
- #134
- US rank
- #9206
Category grades
Schools grade is shown separately in the Schools card above.
Census & demographics
- County
- Baldwin County · 41,764 people
- City population
- 41,764
- Metro
- Milledgeville, GA
- Population (ZIP)
- 41,764
- Household income
- $54,263
- Rent vs Own
- Severe rent burden
- 1630.0
Population outlook (Baldwin County) Hauer SSP2
- Today (2025)
- 45,602 people
- By 2030
- 45,481 · -0.3%
- By 2040
- 44,310 · -2.8%
- By 2050
- 42,129 · -7.6%
- By 2075
- 36,819 · -19.3%
- By 2100
- 29,320 · -35.7%
Race, ethnicity, and origin ACS 2023
- Neighborhood character
- Diverse neighborhood (Simpson 0.56)
- Race & ethnicity
- White 51% Black 43% Hispanic / Latino 3% Two or more races 3% Asian 2%
- Common ancestry
- Slovak 1% Serbian 1% Italian 1%
- Foreign-born
- 3% · Canada, South Korea
- Languages at home
- 96% English-only · Spanish 2% Korean 1%
Political lean MEDSL · Baldwin
- 2024 margin
- Toss-up / Even · D 48.6% · R 50.9%
- 2008→2024 swing
- -6.8pp toward R · 2008: 4.6pp · 2024: -2.2pp
- All cycles
- 2024: R+2.2 2020: D+1.3 2016: D+1.7 2012: D+5.5 2008: D+4.6
Not yet ingested
- Civics
- —
Market trends
- HPI YoY
- ▼ -103.16%
- Current HPI
- 241.3758
- Rent YoY
- ▲ 4.05%
- Metro
- Milledgeville, GA
- State GDP YoY
- ▲ 2.66%
- F500 in state
- 28
Industry mix (Fortune 500 HQ in GA)
| Industry | F500 HQs | Revenue |
|---|---|---|
| Paper / Packaging | 2 | $29B |
|
||
| Retail | 1 | $160B |
|
||
| Transportation / Logistics | 1 | $91B |
|
||
| Airlines | 1 | $62B |
|
||
| Consumer Goods | 1 | $47B |
|
||
| Utilities | 1 | $25B |
|
||
Price history
1 event — show timeline
- 2026-05-22 Listed $129,500 GAMLS
Property tax history
+3.9%/yrLatest (2025): $1,254 · -2.6% YoY. Source: county tax records.
Cash-flow waterfall
monthlySold comps — $/sqft
last 12 mo · ≤1 miLoading sold comps…