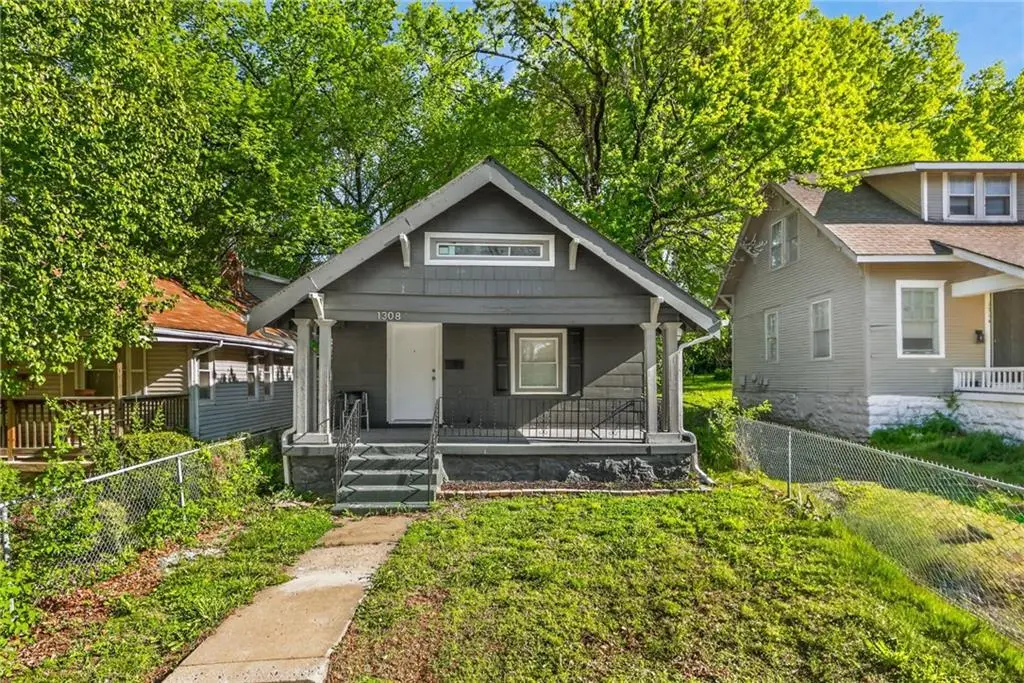
1308 E 59th St · Kansas City, MO
Flood risk 1/10 · Minimal
- FEMA flood zone
- X (unshaded)
- Chance of flooding over 30 yrs
- 0.0%
- Est. flood insurance / yr
- $473 – $860
Fire risk 1/10 · Minimal
- Est. fire insurance / yr
- $1,054 – $1,958
Heat risk 4/10 · Minor
- Hot days now (above 106°F)
- 7 days/yr
- Hot days in 30 yrs
- 17 days/yr
Wind risk 2/10 · Minimal
- Chance of severe wind over 30 yrs
- —
Air-quality risk 3/10 · Minor
- Unhealthy air days now
- 2 days/yr
- Unhealthy air days in 30 yrs
- 4 days/yr
Risk factors via First Street. Map © Google.
Why this score? — see what drove the D grade
The composite is a weighted blend of 9 inputs, each scored 0–100. Each bar is that input's sub-score; the figure is the points it added to the 100-point composite (weight × sub-score).
- ARV discount +14.2/15.0
- Cash flow +12.1/30.0
- Livability +3.9/5.0
- DSCR +3.6/10.0
- Rent growth +3.5/5.0
- 1% rule +3.0/10.0
- Condition / age +2.5/5.0
- Schools +1.5/10.0
- Appreciation +0.0/10.0
$180,000
🖨 Deal sheet (PDF) 📄 Offer letter ✓ Due diligence
Listing remarks
Back on Market! No fault to seller. Welcome to 1308 E 59th St—an opportunity to own a well-positioned home in the heart of Kansas City’s urban core. This 3-bedroom, 2-bath property offers a functional layout with the space and flexibility today’s buyers are looking for, whether for personal use or investment. Situated in the Eastern 49–63 area, the home benefits from a central location with quick access to major corridors, making it easy to reach downtown Kansas City, Brookside, and surrounding amenities. The area continues to see ongoing investment and redevelopment, adding to its long-term upside and appeal. Inside, the home provides a comfortable living space with
Key facts
- Central location
- Quick access
- Driveway access
Tags
Property features AI
Finance
- Other: Directions: Eastwood Trfwy to Dr Martin Luther King Jr Blvd, turn left onto The Paseo, turn right onto E 59th St; home is on the right
- HOA & community: No association fees
Exterior
- Parking: Off-street parking
- Utilities: Public water; Public sewer
- Home design: Single-family residence; Residential property; 1.5-story floor plan; Above-grade living area about 1,044 (public records)
- Construction: Concrete construction; Composition roof; Built over 100 years ago
- Exterior features: Lot approximately 4,372 square feet
Interior
- Bedrooms: 3 bedrooms
- Bathrooms: 2 full bathrooms
- Heating & cooling: Natural gas heating; Electric cooling
- Interior features: Concrete unfinished basement; Fireplace (1)
Neighborhood map
What this means for you Summary
Snapshot
- This is a 3-bed/1.0-bath single-family listed at $180k.
Deal economics
- At list price, monthly cash flow is $-38 ($-456/yr) — negative.
- To cash-flow at today's rent, offer at most $173k (3.7% below list).
- To meet the 1% rule (rent ≥ 1% of price), the offer needs to be $144k (20.2% below list).
- Recommended offer: $144k (20.2% below list) — sets the bar for 1% rule.
- Cap rate 6.0% vs local median 3.9% in Kansas City — top-decile yield for the area; either an underpriced asset or a hidden risk that comps aren't pricing in. Stress-test before assuming the spread holds.
Location & tenants
- Location reads 78/100 on livability (#28 in MO, #2,671 nationally) — a middle-class / working-renter tenant base. Strengths: amenities A+, commute A+, cost of living A+; Watch: crime F.
- Kansas City 33 (urban): math 12% / reading 24% proficiency, ranked #308 of 324 in MO (top 95%) — low school quality limits family demand, transient renter base, plan for 1-2y turnover; 75% free/reduced lunch — lower-income household profile, screen leases tightly.
- Zoned schools: Ac Prep Elementary (math 12% / reading 27%, grade F, #941 of 1,115 statewide, top 86%, 341 students, 99% FRL); Central Middle School (math 0% / reading 9%, grade F, #388 of 391 statewide, top 99%, 428 students, 99% FRL); Southeast High School (math 2% / reading 12%, grade F, #512 of 521 statewide, top 99%, 487 students, 99% FRL) — zoned schools average 99% FRL vs 75% district-wide (24 pts higher); higher-poverty schools than district average — tighter screening recommended.
- Market conditions: Rents rising (+4.0%/yr); tight market (median 1 DOM); 126 active listings in the ZIP; 40 comparable units currently listed for rent nearby; rentals at typical pace (median 22d on market — plan ~3-4 weeks tenant-placement turnaround); 4,002 units permitted in Jackson County in 2024 (2,271 in 5+ unit buildings).
Forward outlook
- Local home prices are declining (-3.0%/yr); year-one equity from $1k of loan paydown is wiped out by about $5k of value loss. Plan a longer hold.
- Jackson County population projected at +4% by 2050 — modest demand growth; plan on rents tracking national, not racing it.
Negotiation context
- It's been on market 59 days — a 3% lower offer ($175k) is reasonable based on typical stale-listing flexibility.
- 2 sale attempts; this cycle's ask has dropped $10k (5%) from the opening price — seller is motivated, your offer sets the floor, not the list.
Risks & watch-outs
- Watch-outs: built in 1920 — expect roof / HVAC / electrical / plumbing capex.
Questions for the listing agent
- What do current leases actually rent for vs. the listed asking? Can we see a recent rent roll and the last 12 months of T-12 income?
- It's been on market 59 days. Have you received any prior offers? Is the seller open to a 20% concession, seller financing, or rate buy-down credit?
- Built in 1920 — when were the roof, HVAC, electrical panel, plumbing, and water heater last replaced?
- Is there a deadline driving the sale (1031 exchange, divorce, estate, relocation)? That informs how much negotiation room exists.
- Crime grade is F in this area — have there been break-ins, vandalism, or insurance claims at this property in the last 3 years? What carrier currently insures it and at what premium?
- The area grade is low — what's the realistic commute time and amenity access for the typical tenant pool here? Any planned neighborhood developments (good or bad) we should know about?
- What's the average days-on-market for RENTAL listings here right now (not sales)? A rising rental-DOM trend means longer vacancies and softer asking-rent achievability than the comps imply.
- What's the recent tenant-quality profile in this submarket — average credit score on applications, eviction rate, late-payment / NSF rate, and stable-employment percentage? A property-management company in the area should have these aggregated.
- How much new for-sale + rental construction is in the pipeline within 1–3 miles? Heavy new supply typically softens prices + rents 12–24 months out; constrained supply supports both.
Investment metrics
- 1% rule
- 0.80% ✗
- Cap rate
- 6.04%
- Cash-on-cash
- -0.90%
- DSCR
- 0.96
- GRM
- 10.4
CMA / ARV
- ARV (median comp)
- $211,751
- List price
- $180,000
- Delta
- -14.99%
- Verdict
- UNDERPRICED
- Comps
- 20 within 1.0 mi
Show comp detail 12 sales within ~0.75 mi
| Address | Dist | Beds/Ba | Sqft | Sold | Price | $/sf | Match |
|---|---|---|---|---|---|---|---|
| 5831 Tracy Ave | 0.05mi | 3/1.5 | 1,136 (+9%) | 0mo | $200,000 | $176 | 81 |
| 6131 Tracy Ave | 0.33mi | 3/1.5 | 1,023 (-2%) | 2mo | $199,900 | $195 | 77 |
| 5728 Forest Ave | 0.24mi | 2/1.0 (-1) | 1,020 (-2%) | 4mo | $95,000 | $93 | 77 |
| 6205 Forest Ave | 0.38mi | 2/1.0 (-1) | 1,055 (+1%) | 6mo | $150,000 | $142 | 71 |
| 5929 Kenwood Ave | 0.47mi | 3/1.0 | 1,121 (+7%) | 5mo | $329,950 | $294 | 62 |
| 5808 Garfield Ave | 0.52mi | 2/1.0 (-1) | 960 (-8%) | 0mo | $80,250 | $84 | 57 |
| 5903 Cherry St | 0.52mi | 3/1.0 | 1,176 (+13%) | 2mo | $345,000 | $293 | 53 |
| 5607 Holmes St | 0.52mi | 2/1.0 (-1) | 1,173 (+12%) | 2mo | $325,000 | $277 | 49 |
| 646 E 61st Ter | 0.51mi | 3/1.0 | 1,198 (+15%) | 4mo | $345,000 | $288 | 48 |
| 5927 Cherry St | 0.52mi | 2/1.5 (-1) | 924 (-12%) | 2mo | $300,000 | $325 | 48 |
| 6115 Holmes St | 0.48mi | 2/1.0 (-1) | 1,192 (+14%) | 2mo | $265,000 | $222 | 47 |
| 5415 Highland Ave | 0.63mi | 2/1.0 (-1) | 928 (-11%) | 2mo | $129,900 | $140 | 46 |
Match score weights: distance 35% · size 25% · config 20% · recency 20%. Top-matched comps best support the ARV.
Projected returns pro-forma
-3.0% appreciation · 3.95% rent growth · sell at horizon
- IRR
- -16.8%
- Equity multiple
- 0.40×
- Total profit
- $-30,225
- Equity at exit
- $26,839
- IRR
- -7.1%
- Equity multiple
- 0.53×
- Total profit
- $-23,731
- Equity at exit
- $15,563
Cash invested: $50,400 (down + closing). Projections, not guarantees.
Landlord ↔ Tenant lean methodology
- Overall (STATE)
- 81 Strongly Landlord-Friendly
- State Missouri
- 81 Strongly Landlord-Friendly · R+10
- County
- — inherits STATE
- City
- — inherits STATE
ZIP-level market 64110
- Rents YoY
- 4.0%
- Median DOM (109 sales)
- 1 d
- Active inventory
- 126
- Price-to-rent
- 10.4×
Monthly cashflow live
- Estimated rent
- $1,436 high interval (Pro) →
- Mortgage (P&I)
- −$944
- Tax from tax record
- −$153 /mo · $1,839/yr
- Insurance
- −$75
- HOA
- −$0
- Vacancy / Maint / Mgmt
- −$301
- Net cashflow
- $-38
Break-even live
Sensitivity live
| Price | -10% $64 | -5% $13 | +0% $-38 | +5% $-89 | +10% $-140 |
|---|---|---|---|---|---|
| Rent | -10% $-151 | -5% $-95 | +0% $-38 | +5% $19 | +10% $75 |
| Rate | -1.0pp $53 | -0.5pp $8 | base $-38 | +0.5pp $-85 | +1.0pp $-132 |
UW: 25.0% down · 7.5% · 30yr · 1.5% tax · 5.0% vac · 8.0% maint · 8.0% mgmt
Financing live
Cash to close
- Down payment
- $45,000
- Closing costs
- $5,400
- Reserves months
- —
- Total cash needed
- —
Loan-product check · same deal, 3 products live
Conventional
25% down · 7.5% · 30yr
- Down + closing
- —
- Monthly P&I
- —
- Monthly cashflow
- —
- DSCR
- —
- Eligible?
- —
Personal DTI + credit; lowest rate.
DSCR
20% down · 8.5% · 30yr
- Down + closing
- —
- Monthly P&I
- —
- Monthly cashflow
- —
- DSCR
- —
- Eligible?
- —
No personal income docs; deal must DSCR.
Hard money
10% down · 12.0% · 12mo
- Down + closing
- —
- Monthly P&I
- —
- Monthly cashflow
- —
- DSCR
- —
- Eligible?
- —
Short-term bridge; refi at stabilization.
Rent comps 40 comps
| Address | Beds | Baths | Sqft | Rent | $/sqft | DOM | Units | Dist |
|---|---|---|---|---|---|---|---|---|
| 6014 Virginia Ave Kansas City, MO | 2.0 | 1.0 | 1072 | $1,086 | $1.01 | 0d | 1 | 0.16mi |
| 6024 Tracy Ave Kansas City, MO | 3.0 | 1.0 | 1000 | $1,250 | $1.25 | 18d | 1 | 0.21mi |
| 5618 Forest Ave Kansas City, MO | 3.0 | 1.0 | 1198 | $1,275 | $1.06 | 18d | 1 | 0.34mi |
| 1702 Bushman Dr Kansas City, MO | 1.0–2.0 | 1.0–2.0 | 895 | $1,065 | $1.19 | 45d | 1 | 0.39mi |
| 5708 Euclid Ave Kansas City, MO | 4.0 | 2.0 | 1350 | $1,600 | $1.19 | 18d | 1 | 0.49mi |
| 5730 Garfield Ave Kansas City, MO | 3.0 | 1.0 | 866 | $1,195 | $1.38 | 18d | 1 | 0.52mi |
| 5524 Woodland Ave Kansas City, MO | 3.0 | 1.0 | 1243 | $1,095 | $0.88 | 25d | 1 | 0.52mi |
| 2100 E 58th St Kansas City, MO | 2.0 | 1.0 | 1030 | $1,500 | $1.46 | 45d | 1 | 0.54mi |
| 5446 Harrison St Unit 2F Kansas City, MO | 2.0 | 1.0 | 960 | $1,099 | $1.14 | 16d | 1 | 0.56mi |
| 5529 Michigan Ave Kansas City, MO | 2.0 | 1.0 | 847 | $995 | $1.17 | 45d | 1 | 0.58mi |
| 5436 Harrison St Unit 1F Kansas City, MO | 2.0 | 1.0 | 1050 | $1,195 | $1.14 | 45d | 1 | 0.58mi |
| 2205 E 59th St Kansas City, MO | 2.0 | 1.0 | 724 | $1,025 | $1.42 | 18d | 1 | 0.59mi |
| 5426 Harrison St Unit 2F Kansas City, MO | 2.0 | 1.0 | 1234 | $1,125 | $0.91 | 18d | 1 | 0.60mi |
| 5424 Harrison St Unit 5426 Kansas City, MO | 2.0 | 1.0 | 1234 | $1,125 | $0.91 | 21d | 1 | 0.60mi |
| 5531 Euclid Ave Kansas City, MO | 3.0 | 1.0 | 1135 | $1,300 | $1.15 | 45d | 1 | 0.62mi |
| 5411 Harrison St Unit 1F Kansas City, MO | 2.0 | 1.0 | 900 | $1,199 | $1.33 | 25d | 1 | 0.62mi |
| 5409 Harrison St Unit 5411 Kansas City, MO | 2.0 | 1.0 | 900 | $1,199 | $1.33 | 25d | 1 | 0.63mi |
| 5407 Harrison St Unit 1F Kansas City, MO | 2.0 | 1.0 | 1025 | $1,195 | $1.17 | 45d | 1 | 0.63mi |
| 5405 Harrison St Kansas City, MO | 2.0 | 1.0 | 1025 | $1,295 | $1.26 | 18d | 1 | 0.63mi |
| 5405 Harrison St Unit 2F Kansas City, MO | 2.0 | 1.0 | 1025 | $1,295 | $1.26 | 18d | 1 | 0.63mi |
| 5405 Harrison St Unit 2F Kansas City, MO | 2.0 | 1.0 | 1025 | $1,295 | $1.26 | 21d | 1 | 0.63mi |
| 662 E 63rd St Kansas City, MO | 2.0 | 2.0 | 951 | $1,655 | $1.74 | 46d | 1 | 0.64mi |
| 6404 The Paseo Kansas City, MO | 1.0–2.0 | 1.0–2.0 | 942 | $1,600 | $1.70 | 4d | 6 | 0.65mi |
| 5430 Michigan Ave Kansas City, MO | 2.0 | 1.0 | 1250 | $1,495 | $1.20 | 45d | 1 | 0.65mi |
| 5424 Charlotte St Kansas City, MO | 2.0 | 1.0 | 958 | $1,395 | $1.46 | 21d | 1 | 0.66mi |
| 5424 Charlotte St Kansas City, MO | 2.0 | 1.0 | 958 | $1,395 | $1.46 | 18d | 1 | 0.66mi |
| 5332 Highland Ave Kansas City, MO | 3.0 | 1.0 | 1022 | $1,350 | $1.32 | 9d | 1 | 0.71mi |
| 5410 Euclid Ave Kansas City, MO | 3.0 | 2.0 | 1119 | $1,395 | $1.25 | 45d | 1 | 0.73mi |
| 5824 Wabash Ave Kansas City, MO | 3.0 | 1.0 | 1276 | $1,050 | $0.82 | 45d | 1 | 0.75mi |
| 5335 Holmes St Unit 2F Kansas City, MO | 2.0 | 1.0 | 960 | $1,295 | $1.35 | 25d | 1 | 0.77mi |
| 5335 Holmes St Unit 2F Kansas City, MO | 2.0 | 1.0 | 960 | $1,295 | $1.35 | 18d | 1 | 0.77mi |
| 5801 Wabash Ave Kansas City, MO | 3.0 | 1.0 | 1200 | $1,200 | $1.00 | 45d | 1 | 0.79mi |
| 2512 E 59th St Kansas City, MO | 2.0 | 1.0 | 750 | $1,150 | $1.53 | 45d | 1 | 0.80mi |
| 6512 Rockhill Rd Kansas City, MO | 2.0 | 1.0 | 900 | $1,990 | $2.21 | 0d | 1 | 0.82mi |
| 6551 Rockhill Rd Kansas City, MO | 1.0–2.0 | 1.0–2.0 | 888 | $1,978 | $2.23 | 0d | 9 | 0.83mi |
| 6518 Rockhill Rd Kansas City, MO | 2.0 | 1.0 | 900 | $2,090 | $2.32 | 45d | 1 | 0.83mi |
| 5241 Brookwood Ave Kansas City, MO | 3.0 | 2.0 | 1431 | $1,550 | $1.08 | 45d | 1 | 0.87mi |
| 1435 E 66th Ter Kansas City, MO | 3.0 | 1.0 | 988 | $1,335 | $1.35 | 0d | 1 | 0.94mi |
| 5120 The Paseo Apt 1 Kansas City, MO | 2.0 | 1.0 | 1500 | $1,550 | $1.03 | 45d | 1 | 0.95mi |
| 6653 Lydia Ave Kansas City, MO | 3.0 | 1.0 | 962 | $1,500 | $1.56 | 18d | 1 | 0.96mi |
Listing history 21 events
-
2026-06-21days on market $180,000 Active 59 DOM
-
2026-06-18days on market $180,000 Active 56 DOM
-
2026-06-17days on market $180,000 Active 55 DOM
-
2026-06-16days on market $180,000 Active 54 DOM
-
2026-06-15pricedays on market $180,000 Active 53 DOM
-
2026-06-13days on market $190,000 Active 51 DOM
-
2026-06-09days on market $190,000 Active 47 DOM
-
2026-06-08days on market $190,000 Active 46 DOM
-
2026-06-08status $190,000 Active 45 DOM
-
2026-06-07days on market $190,000 Active Under Contract 45 DOM
-
2026-06-05days on market $190,000 Active Under Contract 42 DOM
-
2026-06-03days on market $190,000 Active Under Contract 41 DOM
-
2026-06-02days on market $190,000 Active Under Contract 40 DOM
-
2026-06-01days on market $190,000 Active Under Contract 39 DOM
-
2026-05-31days on market $190,000 Active Under Contract 38 DOM
-
2026-04-23$190,000 Active 1411-char remark
-
2023-09-27soldstatus
-
2023-08-11soldstatus
-
2017-03-24soldstatus
-
1999-10-12soldstatus
-
1981-10-01soldstatus
ⓘ Source: listings_history table (triggers on properties + properties_extension) + one-shot
backfill from property_details.listing_events for pre-trigger history.
Tax reassessment forecast MO · Resets to sale price
- Current annual tax
- $1,839 · $153/mo
- Projected year-2 tax
- $1,839 · $153/mo
- Expected delta
- $0/yr ($0/mo · -0.0%)
ⓘ Screening estimate from a state-policy table — verify with the county assessor before closing.
Climate risk First Street
- Flood 1/10 Low FEMA zone X (unshaded) · 0% chance over 30 yrs
- Wildfire 1/10 Low
- Heat 4/10 Moderate 7 d/yr ≥106°F today · 17 d/yr by 30 yrs out
- Wind 2/10 Low
- Air quality 3/10 Moderate 2 unhealthy d/yr today · 4 by 30 yrs out
Nearby sold comps map
Loading sold comps map…
Walkable amenities ~0.75 mi
Loading nearby amenities…
Taxation est. · year 1
- Rental income
- $17,229
- − Mortgage interest
- −$10,083
- − Property taxes
- −$1,839
- − Insurance
- −$900
- − Repairs & maintenance
- −$1,378
- − Management
- −$1,378
- − Depreciation
- −$5,236
- Taxable loss
- −$3,586
- Est. tax savings @ 24.0%
- +$861
- After-tax cash flow
- $405/yr
For passive investors: Depreciation is non-cash, so a rental often shows a tax loss while cash-flowing — sheltering income. Rental losses are passive: they offset passive income freely, and up to $25,000/yr can offset ordinary (W-2) income if you actively participate and your MAGI is under $100k (phasing out to $0 by $150k); unused losses carry forward. On sale, claimed depreciation is recaptured at up to 25%, and gains may owe capital-gains tax (a 1031 exchange can defer both). Figures are a year-1 estimate at your 24.0% rate — not tax advice; consult a CPA.
Schools (NCES district)
- District
- Kansas City 33
- NCES district ID
- 2916400
- Math proficiency
- 12% ▼ -8.00%
- Reading proficiency
- 24% ▬ 0.00%
- Median HH income
- $35,227
- Composite
- 14.8/100
- National rank
- #9387
- State rank
- #308 of 324 in MO
Livability — Kansas City
- Score
- 78/100
- State rank
- #28
- US rank
- #2671
Category grades
Schools grade is shown separately in the Schools card above.
Census & demographics
- Census place
- Kansas City, MO
- County
- Jackson County · 687,798 people
- City population
- 439,467
- Metro
- Kansas City, MO-KS
- Population (ZIP)
- 16,878
- Household income
- $63,044
- Rent vs Own
- Severe rent burden
- 962.0
Population outlook (Jackson County) Hauer SSP2
- Today (2025)
- 719,589 people
- By 2030
- 731,456 · +1.6%
- By 2040
- 746,689 · +3.8%
- By 2050
- 749,289 · +4.1%
- By 2075
- 736,227 · +2.3%
- By 2100
- 668,210 · -7.1%
Race, ethnicity, and origin ACS 2023
- Neighborhood character
- Diverse neighborhood (Simpson 0.63)
- Race & ethnicity
- White 49% Black 34% Two or more races 10% Hispanic / Latino 9% Asian 2%
- Hispanic origin (detail)
- Mexican 6%
- Common ancestry
- Romanian 2% Lithuanian 2% Italian 2%
- Foreign-born
- 4% · Canada
- Languages at home
- 92% English-only · Spanish 6% French/Haitian/Cajun 1% Other Indo-European 1%
Political lean MEDSL · Jackson
- 2024 margin
- D (+19.3) · D 58.9% · R 39.5% · Other 1.6%
- 2008→2024 swing
- -6.1pp toward R · 2008: 25.4pp · 2024: 19.3pp
- All cycles
- 2024: D+19.3 2020: D+22.0 2016: D+16.6 2012: D+19.0 2008: D+25.4
Not yet ingested
- Civics
- —
Market trends
- HPI YoY
- ▼ -514.37%
- Current HPI
- 371.8501
- Rent YoY
- ▲ 3.95%
- Metro
- Kansas City, MO-KS
- State GDP YoY
- ▲ 1.84%
- F500 in state
- 20
Industry mix (Fortune 500 HQ in MO)
| Industry | F500 HQs | Revenue |
|---|---|---|
| Healthcare | 1 | $163B |
|
||
| Insurance | 1 | $21B |
|
||
| Industrial Technology | 1 | $17B |
|
||
| Retail | 1 | $16B |
|
||
| Industrial Distribution | 1 | $10B |
|
||
| Utilities | 1 | $9B |
|
||
Price history
-5.3% since first listed9 events — show timeline
- 2026-06-14 Price Changed $180,000 Heartland MLS as Distributed by MLS Grid
- 2026-06-07 Relisted — Heartland MLS as Distributed by MLS Grid
- 2026-05-27 Contingent — Heartland MLS as Distributed by MLS Grid
- 2026-04-23 Listed $190,000 Heartland MLS as Distributed by MLS Grid
- 2023-09-27 Sold (Public Records) — Public Records
- 2023-08-11 Sold (Public Records) — Public Records
- 2017-03-24 Sold (Public Records) — Public Records
- 1999-10-12 Sold (Public Records) — Public Records
- 1981-10-01 Sold (Public Records) — Public Records
Property tax history
+11.2%/yrLatest (2025): $1,839 · +22.2% YoY. Source: county tax records.
Cash-flow waterfall
monthlySold comps — $/sqft
last 12 mo · ≤1 miLoading sold comps…