165 County Road 2359 · Hardin, TX
Flood risk 1/10 · Minimal
- FEMA flood zone
- X (unshaded)
- Chance of flooding over 30 yrs
- 0.0%
- Est. flood insurance / yr
- $507 – $1,088
Fire risk 4/10 · Minor
- Est. fire insurance / yr
- $1,222 – $2,270
Heat risk 9/10 · Severe
- Hot days now (above 112°F)
- 7 days/yr
- Hot days in 30 yrs
- 24 days/yr
Wind risk 9/10 · Severe
- Chance of severe wind over 30 yrs
- 99.0%
Air-quality risk 2/10 · Minimal
- Unhealthy air days now
- 0 days/yr
- Unhealthy air days in 30 yrs
- 1 days/yr
Risk factors via First Street. Map © Google.
Why this score? — see what drove the D grade
The composite is a weighted blend of 9 inputs, each scored 0–100. Each bar is that input's sub-score; the figure is the points it added to the 100-point composite (weight × sub-score).
- ARV discount +14.1/15.0
- Cash flow +9.6/30.0
- Schools +3.6/10.0
- Livability +3.0/5.0
- 1% rule +2.8/10.0
- DSCR +2.7/10.0
- Rent growth +2.5/5.0
- Condition / age +2.5/5.0
- Appreciation +0.0/10.0
$209,500
🖨 Deal sheet 📄 Offer letter ✓ Due diligence
Listing remarks
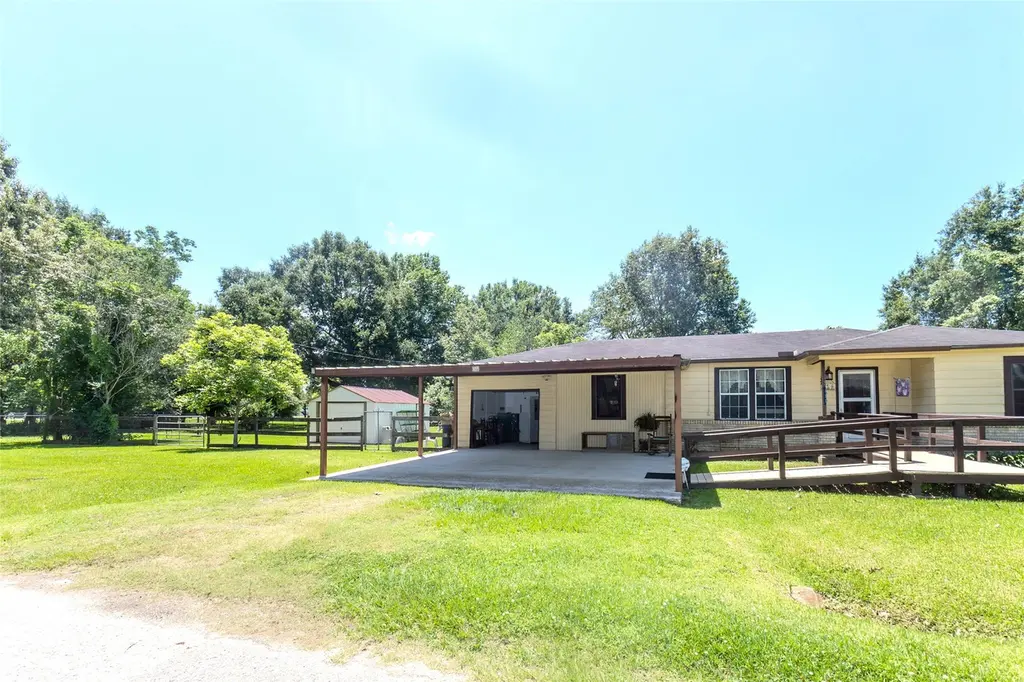
Step back into charm and character in this cute 3-bedroom vintage home sitting on 1/2 acre. This home features a whole house generator, wood floors, a cozy vintage style kitchen, and all the old-home charm you have been looking for. Enjoy your mornings or evenings on the large, covered back porch overlooking green open space!
Key facts
- Covered porch
- 0.5 acre lot
- Garage
Tags
Property features AI
Finance
- Other: Lot is approximately 0.5 acre with asphalt road access
Exterior
- Parking: Attached garage (1 car); Attached carport (2 spaces)
- Utilities: Public water; Septic tank sewer
- Home design: Residential property; Built in 1950; Single-story (entry level: 1); Facing direction not specified
- Construction: Wood siding; Composition roof; Pillar/post/pier foundation
- Exterior features: Deck; Fence (back yard); Porch; Patio; Private yard; Storage shed(s)
Interior
- Kitchen: Gas cooktop
- Bathrooms: 2 full bathrooms
- Heating & cooling: Propane heating; Central electric air conditioning
- Interior features: Laminate counters; Tub with shower; Accessible approach with ramp; 7 total rooms
- Laundry & utility: Washer hookup; Electric dryer hookup
Neighborhood map
What this means for you Summary
Snapshot
- This is a 3-bed/1.0-bath single-family listed at $210k.
Deal economics
- At list price, monthly cash flow is $-143 ($-2k/yr) — negative.
- To cash-flow at today's rent, offer at most $184k (12.0% below list).
- To meet the 1% rule (rent ≥ 1% of price), the offer needs to be $163k (22.3% below list).
- Recommended offer: $163k (22.3% below list) — sets the bar for 1% rule.
- Cap rate 5.5% vs local median 3.1% in Hardin — top-decile yield for the area; either an underpriced asset or a hidden risk that comps aren't pricing in. Stress-test before assuming the spread holds.
Location & tenants
- Location reads 59/100 on livability (#1,134 in TX) — a working-class tenant base; expect higher turnover. Strengths: cost of living A+, housing A+; Watch: crime F, amenities F, commute F.
- Hardin ISD (rural): math 39% / reading 44% proficiency, ranked #354 of 826 in TX (top 43%) — families likely to look elsewhere, expect single-tenant / working-renter base with shorter leases.
- Zoned schools: Hardin H S (math 67% / reading 57%, grade B-, #237 of 1,632 statewide, top 16%, 394 students, 57% FRL) — zoned schools at 57% FRL track the district average.
- Zoned-school proficiency averages 62% at this address vs 42% district-wide (+20 pts) — the actual schools serving this property are materially stronger than the Hardin ISD average implies; a family-tenant draw the district grade alone would hide.
- Market conditions: 222 active listings in the ZIP; 1,321 units permitted in Liberty County in 2024 (0 in 5+ unit buildings).
Forward outlook
- Local home prices are declining (-3.0%/yr); year-one equity from $1k of loan paydown is wiped out by about $6k of value loss. Plan a longer hold.
- Liberty County population projected at +24% by 2050 — long-run rental-demand tailwind backs the buy-and-hold thesis.
Negotiation context
- It's been on market 36 days — a 3% lower offer ($203k) is reasonable based on typical stale-listing flexibility.
Risks & watch-outs
- Watch-outs: built in 1950 — expect roof / HVAC / electrical / plumbing capex.
- Climate carrying-cost: severe wind risk, 99% chance of damaging wind over 30y; extreme-heat days projected 7→24/yr by 2055 (HVAC capex compounding) — expect insurance premiums to compound above CPI over the hold.
Questions for the listing agent
- What do current leases actually rent for vs. the listed asking? Can we see a recent rent roll and the last 12 months of T-12 income?
- It's been on market 36 days. Have you received any prior offers? Is the seller open to a 22% concession, seller financing, or rate buy-down credit?
- Built in 1950 — when were the roof, HVAC, electrical panel, plumbing, and water heater last replaced?
- Is there a deadline driving the sale (1031 exchange, divorce, estate, relocation)? That informs how much negotiation room exists.
- Schools are D-rated, which usually means shorter tenancies and higher turnover. Who's the typical renter profile here, and what's been the actual vacancy rate?
- Crime grade is F in this area — have there been break-ins, vandalism, or insurance claims at this property in the last 3 years? What carrier currently insures it and at what premium?
- The area grade is low — what's the realistic commute time and amenity access for the typical tenant pool here? Any planned neighborhood developments (good or bad) we should know about?
- What's the average days-on-market for RENTAL listings here right now (not sales)? A rising rental-DOM trend means longer vacancies and softer asking-rent achievability than the comps imply.
- What's the recent tenant-quality profile in this submarket — average credit score on applications, eviction rate, late-payment / NSF rate, and stable-employment percentage? A property-management company in the area should have these aggregated.
- How much new for-sale + rental construction is in the pipeline within 1–3 miles? Heavy new supply typically softens prices + rents 12–24 months out; constrained supply supports both.
Investment metrics
- 1% rule
- 0.78% ✗
- Cap rate
- 5.48%
- Cash-on-cash
- -2.92%
- DSCR
- 0.87
- GRM
- 10.7
CMA / ARV
- ARV (median comp)
- $245,225
- List price
- $209,500
- Delta
- -14.57%
- Verdict
- UNDERPRICED
- Comps
- 14 within 1.0 mi
Show comp detail 5 sales within ~0.75 mi
| Address | Dist | Beds/Ba | Sqft | Sold | Price | $/sf | Match |
|---|---|---|---|---|---|---|---|
| 398 County Road 2360 | 0.25mi | 3/2.0 | 1,476 (+8%) | 13mo | $124,000 | $84 | 60 |
| 10182 Highway 146 N | 0.72mi | 3/2.0 | 1,348 (-2%) | 2mo | $325,000 | $241 | 58 |
| 284 County Road 2003 South S | 0.29mi | 3/3.0 | 1,527 (+12%) | 3mo | $245,000 | $160 | 57 |
| 174 County Road 2363 E | 0.33mi | 3/1.5 | 1,540 (+13%) | 16mo | $250,000 | $162 | 48 |
| 568 County Road 2016 | 0.58mi | 3/2.0 | 1,444 (+6%) | 24mo | $239,900 | $166 | 40 |
Match score weights: distance 35% · size 25% · config 20% · recency 20%. Top-matched comps best support the ARV.
Projected returns pro-forma
-3.0% appreciation · 3.0% rent growth · sell at horizon
- IRR
- -21.2%
- Equity multiple
- 0.27×
- Total profit
- $-43,013
- Equity at exit
- $31,237
- IRR
- -14.6%
- Equity multiple
- 0.16×
- Total profit
- $-49,094
- Equity at exit
- $18,114
Cash invested: $58,660 (down + closing). Projections, not guarantees.
Landlord ↔ Tenant lean methodology
- Overall (STATE)
- 87 Strongly Landlord-Friendly
- State Texas
- 87 Strongly Landlord-Friendly · R+5
- County
- — inherits STATE
- City
- — inherits STATE
ZIP-level market 77575
- Home prices YoY
- -26.6%
- Active inventory
- 222
- Price-to-rent
- 10.7×
Monthly cashflow live
- Estimated rent
- $1,627 medium interval (Pro) →
- Mortgage (P&I)
- −$1,099
- Tax from tax record
- −$242 /mo · $2,907/yr
- Insurance
- −$87
- HOA
- −$0
- Vacancy / Maint / Mgmt
- −$342
- Net cashflow
- $-143
Break-even live
UW: 25.0% down · 7.5% · 30yr · 1.5% tax · 5.0% vac · 8.0% maint · 8.0% mgmt
Financing live
Cash to close
- Down payment
- $52,375
- Closing costs
- $6,285
- Reserves months
- —
- Total cash needed
- —
Loan-product check · same deal, 3 products live
Conventional
25% down · 7.5% · 30yr
- Down + closing
- —
- Monthly P&I
- —
- Monthly cashflow
- —
- DSCR
- —
- Eligible?
- —
Personal DTI + credit; lowest rate.
DSCR
20% down · 8.5% · 30yr
- Down + closing
- —
- Monthly P&I
- —
- Monthly cashflow
- —
- DSCR
- —
- Eligible?
- —
No personal income docs; deal must DSCR.
Hard money
10% down · 12.0% · 12mo
- Down + closing
- —
- Monthly P&I
- —
- Monthly cashflow
- —
- DSCR
- —
- Eligible?
- —
Short-term bridge; refi at stabilization.
Listing history 14 events
-
2026-06-18days on market $209,500 Active 36 DOM
-
2026-06-17days on market $209,500 Active 35 DOM
-
2026-06-16days on market $209,500 Active 34 DOM
-
2026-06-15days on market $209,500 Active 33 DOM
-
2026-06-13days on market $209,500 Active 31 DOM
-
2026-06-09days on market $209,500 Active 27 DOM
-
2026-06-08days on market $209,500 Active 26 DOM
-
2026-06-07days on market $209,500 Active 25 DOM
-
2026-06-04days on market $209,500 Active 22 DOM
-
2026-06-03days on market $209,500 Active 21 DOM
-
2026-06-02days on market $209,500 Active 20 DOM
-
2026-06-01days on market $209,500 Active 19 DOM
-
2026-05-31days on market $209,500 Active 18 DOM
-
2026-05-13$224,500 Active 316-char remark
ⓘ Source: listings_history table (triggers on properties + properties_extension) + one-shot
backfill from property_details.listing_events for pre-trigger history.
Tax reassessment forecast TX · Resets to sale price
- Current annual tax
- $2,907 · $242/mo
- Projected year-2 tax
- $3,834 · $319/mo
- Expected delta
- +$927/yr (+$77/mo · 31.9%)
ⓘ Screening estimate from a state-policy table — verify with the county assessor before closing.
Climate risk First Street
- Flood 1/10 Low FEMA zone X (unshaded) · 0% chance over 30 yrs
- Wildfire 4/10 Moderate
- Heat 9/10 Extreme 7 d/yr ≥112°F today · 24 d/yr by 30 yrs out
- Wind 9/10 Extreme 99% chance of damaging wind over 30 yrs
- Air quality 2/10 Low 0 unhealthy d/yr today · 1 by 30 yrs out
Nearby sold comps map
Loading sold comps map…
Walkable amenities ~0.75 mi
Loading nearby amenities…
Taxation est. · year 1
- Rental income
- $19,529
- − Mortgage interest
- −$11,735
- − Property taxes
- −$2,907
- − Insurance
- −$1,048
- − Repairs & maintenance
- −$1,562
- − Management
- −$1,562
- − Depreciation
- −$6,095
- Taxable loss
- −$5,380
- Est. tax savings @ 24.0%
- +$1,291
- After-tax cash flow
- $-419/yr
For passive investors: Depreciation is non-cash, so a rental often shows a tax loss while cash-flowing — sheltering income. Rental losses are passive: they offset passive income freely, and up to $25,000/yr can offset ordinary (W-2) income if you actively participate and your MAGI is under $100k (phasing out to $0 by $150k); unused losses carry forward. On sale, claimed depreciation is recaptured at up to 25%, and gains may owe capital-gains tax (a 1031 exchange can defer both). Figures are a year-1 estimate at your 24.0% rate — not tax advice; consult a CPA.
Schools (NCES district)
- District
- Hardin ISD
- NCES district ID
- 4822380
- Math proficiency
- 39% ▲ 1.00%
- Reading proficiency
- 44% ▲ 6.00%
- Median HH income
- $48,099
- Composite
- 35.54/100
- National rank
- #4907
- State rank
- #354 of 826 in TX
Livability — Hardin
- Score
- 59/100
- State rank
- #1134
- US rank
- #20029
Category grades
Schools grade is shown separately in the Schools card above.
Census & demographics
- Census place
- Hardin, TX
- Population (ZIP)
- 16,617
Population outlook (Liberty County) Hauer SSP2
- Today (2025)
- 87,956 people
- By 2030
- 92,161 · +4.8%
- By 2040
- 100,784 · +14.6%
- By 2050
- 109,471 · +24.5%
- By 2075
- 133,470 · +51.7%
- By 2100
- 147,372 · +67.6%
Race, ethnicity, and origin ACS 2023
- Neighborhood character
- Diverse neighborhood (Simpson 0.61)
- Race & ethnicity
- White 56% Hispanic / Latino 25% Black 12% Two or more races 11%
- Hispanic origin (detail)
- Mexican 24%
- Common ancestry
- Lithuanian 4% Serbian 2% Slovak 2%
- Foreign-born
- 12% · Canada
- Languages at home
- 80% English-only · Spanish 19% Other Asian/Pacific 1%
Political lean MEDSL · Liberty
- 2024 margin
- Solid R (+61.6) · D 19.0% · R 80.6%
- 2008→2024 swing
- -17.9pp toward R · 2008: -43.7pp · 2024: -61.6pp
- All cycles
- 2024: R+61.6 2020: R+59.7 2016: R+58.0 2012: R+53.3 2008: R+43.7
Not yet ingested
- Civics
- —
Market trends
- HPI YoY
- ▼ -74.17%
- Current HPI
- 204.9372
- Rent YoY
- —
- Metro
- —
- State GDP YoY
- ▲ 3.95%
- F500 in state
- 110
Industry mix (Fortune 500 HQ in TX)
| Industry | F500 HQs | Revenue |
|---|---|---|
| Energy | 16 | $1,198B |
|
||
| Technology | 5 | $198B |
|
||
| Engineering / Construction | 4 | $72B |
|
||
| Energy Services | 3 | $60B |
|
||
| Utilities | 3 | $41B |
|
||
| Healthcare | 2 | $330B |
|
||
Price history
-6.7% since first listed2 events — show timeline
- 2026-05-28 Price Changed $209,500 HARMLS
- 2026-05-13 Listed $224,500 HARMLS
Property tax history
+7.0%/yrLatest (2025): $2,907 · +4.0% YoY. Source: county tax records.
Cash-flow waterfall
monthlySold comps — $/sqft
last 12 mo · ≤1 miLoading sold comps…