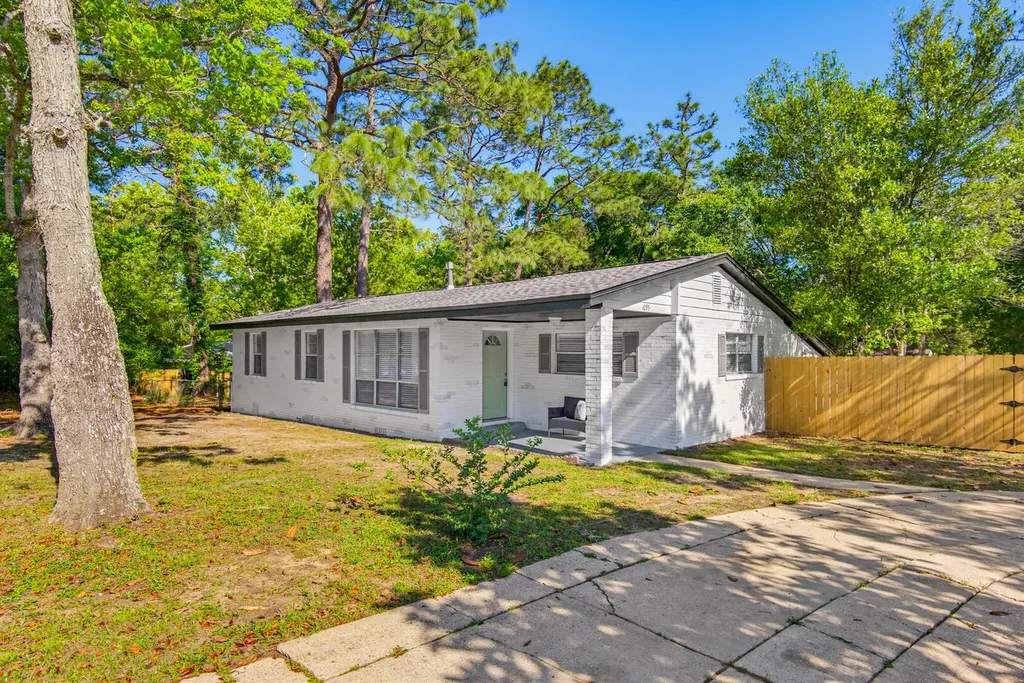
1095 Texas Pkwy · Crestview, FL
Flood risk 1/10 · Minimal
- FEMA flood zone
- X (unshaded)
- Chance of flooding over 30 yrs
- 0.0%
- Est. flood insurance / yr
- $507 – $1,088
Fire risk 3/10 · Minor
- Est. fire insurance / yr
- $947 – $1,759
Heat risk 9/10 · Severe
- Hot days now (above 107°F)
- 7 days/yr
- Hot days in 30 yrs
- 19 days/yr
Wind risk 9/10 · Severe
- Chance of severe wind over 30 yrs
- 99.0%
Air-quality risk 2/10 · Minimal
- Unhealthy air days now
- 1 days/yr
- Unhealthy air days in 30 yrs
- 1 days/yr
Risk factors via First Street. Map © Google.
Why this score? — see what drove the C- grade
The composite is a weighted blend of 9 inputs, each scored 0–100. Each bar is that input's sub-score; the figure is the points it added to the 100-point composite (weight × sub-score).
- ARV discount +15.0/15.0
- Cash flow +13.4/30.0
- Schools +5.2/10.0
- DSCR +4.0/10.0
- Livability +3.8/5.0
- 1% rule +3.6/10.0
- Rent growth +2.8/5.0
- Condition / age +2.5/5.0
- Appreciation +0.0/10.0
$239,900
🖨 Deal sheet 📄 Offer letter ✓ Due diligence
Listing remarks
Spacious and beautifully updated 5 bedroom, 2 bathroom brick home situated on a large corner lot in Crestview! This move-in ready property offers hardwood and tile flooring throughout -- no carpet -- along with granite countertops, updated finishes, and an abundance of flexible living space. The bright kitchen features stainless steel appliances, white cabinetry, and plenty of counter space, while the oversized laundry room provides exceptional storage and functionality. The primary suite includes an additional bonus room perfect for a home office, gym, nursery, oversized closet, or private retreat space. Outside, enjoy a fully fenced backyard with plenty of room to entertain, pets to roam,
Key facts
- Bonus room
- Granite countertops
- Corner lot
Tags
Property features AI
Exterior
- Utilities: Electric service; Central electric air conditioning
- Home design: Ranch-style single-story home; Built in 1962
- Construction: Single-story building; Total building area about 2052 (source: county records)
- Exterior features: Lot about 0.37 acres with dimensions approx. 142 x 111; Subdivision: MCLAUGHLIN & HARRIS
Interior
- Kitchen: Kitchen on the first floor
- Bedrooms: Five bedrooms, all on the first floor; Bedroom sizes include approx. 12 x 10, 14 x 14, 20 x 20, 12 x 14, and 12 x 10 (various rooms)
- Bathrooms: Two full bathrooms
- Heating & cooling: Central air conditioning
- Interior features: Living room on the first floor; Dining area on the first floor; Seven total rooms
Neighborhood map
What this means for you Summary
Snapshot
- This is a 4-bed/2.0-bath single-family listed at $240k.
Deal economics
- At list price, monthly cash flow is $5 ($64/yr) — positive.
- The deal already cash-flows at list — no discount required.
- To meet the 1% rule (rent ≥ 1% of price), the offer needs to be $205k (14.3% below list).
- Recommended offer: $205k (14.3% below list) — sets the bar for 1% rule.
- Cap rate 6.3% vs local median 4.4% in Crestview — top-decile yield for the area; either an underpriced asset or a hidden risk that comps aren't pricing in. Stress-test before assuming the spread holds.
Location & tenants
- Location reads 75/100 on livability (#252 in FL, #3,858 nationally) — a middle-class / working-renter tenant base. Strengths: cost of living A+, housing A+, health & safety A+; Watch: employment D, amenities F, commute F.
- Okaloosa (other): math 60% / reading 60% proficiency, ranked #12 of 73 in FL (top 16%) — acceptable for families but not a draw, mixed tenant base, ~2y average lease.
- Zoned schools: Bob Sikes Elementary School (math 53% / reading 60%, grade C+, #816 of 2,144 statewide, top 39%, 829 students, 52% FRL); Crestview High School (math 49% / reading 54%, grade D+, #167 of 667 statewide, top 25%, 2,315 students, 42% FRL).
- Market conditions: Rents rising (+1.2%/yr); 349 active listings in the ZIP; 21 comparable units currently listed for rent nearby; rentals at typical pace (median 21d on market — plan ~3-4 weeks tenant-placement turnaround); 43% of comp listings sitting > 30 days — soft ceiling on asking rent; solid renter incomes; 1,268 units permitted in Okaloosa County in 2024 (175 in 5+ unit buildings).
- This rent runs 32% of the median local income ($78k/yr) — at the standard rent-burdened threshold; future hikes will face affordability resistance.
Forward outlook
- Local home prices are declining (-3.0%/yr); year-one equity from $2k of loan paydown is wiped out by about $7k of value loss. Plan a longer hold.
- Okaloosa County population projected at +37% by 2050 — long-run rental-demand tailwind backs the buy-and-hold thesis.
Negotiation context
- It's been on market 32 days — a 3% lower offer ($233k) is reasonable based on typical stale-listing flexibility.
- 9 sale attempts since 8y ago with the ask held roughly flat each time — persistent listings suggest the price (not the market) is what's stuck; bring a comps-based counter.
- Current owner paid $62k; list at $240k implies a 284% gain — meaningful room to come down on a strong offer.
Risks & watch-outs
- Climate carrying-cost: severe wind risk, 99% chance of damaging wind over 30y; extreme-heat days projected 7→19/yr by 2055 (HVAC capex compounding) — expect insurance premiums to compound above CPI over the hold.
Questions for the listing agent
- It's been on market 32 days. Have you received any prior offers? Is the seller open to a 14% concession, seller financing, or rate buy-down credit?
- Built in 1962 — when were the roof, HVAC, electrical panel, plumbing, and water heater last replaced?
- Is there a deadline driving the sale (1031 exchange, divorce, estate, relocation)? That informs how much negotiation room exists.
- Schools are B-rated — typically a magnet for longer-tenancy family renters. What's the average tenant stay here, and is there a school-zone premium baked into asking?
- What's the average days-on-market for RENTAL listings here right now (not sales)? A rising rental-DOM trend means longer vacancies and softer asking-rent achievability than the comps imply.
- What's the recent tenant-quality profile in this submarket — average credit score on applications, eviction rate, late-payment / NSF rate, and stable-employment percentage? A property-management company in the area should have these aggregated.
- How much new for-sale + rental construction is in the pipeline within 1–3 miles? Heavy new supply typically softens prices + rents 12–24 months out; constrained supply supports both.
Investment metrics
- 1% rule
- 0.86% ✗
- Cap rate
- 6.32%
- Cash-on-cash
- 0.10%
- DSCR
- 1.00
- GRM
- 9.7
CMA / ARV
- ARV (on-the-fly)
- $302,148
- Comps found
- 12
Show comp detail 12 sales within ~0.75 mi
| Address | Dist | Beds/Ba | Sqft | Sold | Price | $/sf | Match |
|---|---|---|---|---|---|---|---|
| 970 Texas Pkwy | 0.05mi | 4/2.0 | 1,858 (-5%) | 2mo | $306,000 | $165 | 87 |
| 158 Dixie St | 0.65mi | 4/2.0 | 1,969 (+0%) | 5mo | $325,000 | $165 | 65 |
| 1912 N Pearl Street St | 0.43mi | 4/3.0 | 1,848 (-6%) | 4mo | $285,000 | $154 | 63 |
| 132 Lonnie Jack Dr | 0.31mi | 4/2.0 | 1,789 (-9%) | 12mo | $245,000 | $137 | 61 |
| 1791 N Pearl St | 0.38mi | 4/2.0 | 1,768 (-10%) | 10mo | $280,000 | $158 | 57 |
| 297 Anderson St | 0.59mi | 4/3.0 | 1,908 (-3%) | 10mo | $175,000 | $92 | 56 |
| 306 E 1St Ave | 0.69mi | 4/2.0 | 2,009 (+2%) | 11mo | $235,000 | $117 | 55 |
| 498 Eisenhower Dr | 0.75mi | 5/3.0 (+1) | 1,962 (0%) | 3mo | $240,000 | $122 | 54 |
| 495 Eisenhower Dr | 0.74mi | 4/2.5 | 1,881 (-4%) | 6mo | $270,000 | $144 | 51 |
| 194 Wainwright Dr | 0.74mi | 3/2.5 (-1) | 1,886 (-4%) | 6mo | $299,900 | $159 | 47 |
| 104 Lear Ct | 0.74mi | 3/2.5 (-1) | 1,818 (-7%) | 2mo | $274,900 | $151 | 45 |
| 308 Brannon Ct | 0.56mi | 3/2.5 (-1) | 1,672 (-15%) | 3mo | $287,000 | $172 | 39 |
Match score weights: distance 35% · size 25% · config 20% · recency 20%. Top-matched comps best support the ARV.
Projected returns pro-forma
-3.0% appreciation · 1.17% rent growth · sell at horizon
- IRR
- -18.2%
- Equity multiple
- 0.37×
- Total profit
- $-42,244
- Equity at exit
- $35,770
- IRR
- -14.4%
- Equity multiple
- 0.24×
- Total profit
- $-51,020
- Equity at exit
- $20,742
Cash invested: $67,172 (down + closing). Projections, not guarantees.
Landlord ↔ Tenant lean methodology
- Overall (STATE)
- 87 Strongly Landlord-Friendly
- State Florida
- 87 Strongly Landlord-Friendly · R+3
- County
- — inherits STATE
- City
- — inherits STATE
ZIP-level market 32536
- Home prices YoY
- -16.2%
- Rents YoY
- 1.2%
- Active inventory
- 349
- Price-to-rent
- 9.7×
Monthly cashflow live
- Estimated rent
- $2,055 high interval (Pro) →
- Mortgage (P&I)
- −$1,258
- Tax from tax record
- −$260 /mo · $3,121/yr
- Insurance
- −$100
- HOA
- −$0
- Vacancy / Maint / Mgmt
- −$432
- Net cashflow
- $5
Break-even live
UW: 25.0% down · 7.5% · 30yr · 1.5% tax · 5.0% vac · 8.0% maint · 8.0% mgmt
Financing live
Cash to close
- Down payment
- $59,975
- Closing costs
- $7,197
- Reserves months
- —
- Total cash needed
- —
Loan-product check · same deal, 3 products live
Conventional
25% down · 7.5% · 30yr
- Down + closing
- —
- Monthly P&I
- —
- Monthly cashflow
- —
- DSCR
- —
- Eligible?
- —
Personal DTI + credit; lowest rate.
DSCR
20% down · 8.5% · 30yr
- Down + closing
- —
- Monthly P&I
- —
- Monthly cashflow
- —
- DSCR
- —
- Eligible?
- —
No personal income docs; deal must DSCR.
Hard money
10% down · 12.0% · 12mo
- Down + closing
- —
- Monthly P&I
- —
- Monthly cashflow
- —
- DSCR
- —
- Eligible?
- —
Short-term bridge; refi at stabilization.
Rent comps 21 comps
| Address | Beds | Baths | Sqft | Rent | $/sqft | DOM | Units | Dist |
|---|---|---|---|---|---|---|---|---|
| 326 Dixie St Crestview, FL | 3.0 | 1.0 | 1386 | $1,400 | $1.01 | 44d | 1 | 0.48mi |
| 408 Arbor Lake Dr Crestview, FL | 3.0 | 2.5 | 1755 | $1,900 | $1.08 | 13d | 1 | 0.54mi |
| 149 Shady Ln Crestview, FL | 3.0 | 2.0 | 1680 | $2,000 | $1.19 | 44d | 1 | 0.60mi |
| 311 Dahlquist Dr Crestview, FL | 4.0 | 2.5 | 1770 | $2,050 | $1.16 | 21d | 1 | 0.70mi |
| 489 Eisenhower Dr Crestview, FL | 4.0 | 2.5 | 1919 | $2,095 | $1.09 | 44d | 1 | 0.71mi |
| 202 Wainwright Dr Crestview, FL | 4.0 | 2.5 | 2002 | $1,890 | $0.94 | 21d | 1 | 0.76mi |
| 448 Eisenhower Dr Crestview, FL | 5.0 | 3.0 | 2019 | $2,550 | $1.26 | 44d | 1 | 0.76mi |
| 821 N Brett St Crestview, FL | 3.0 | 2.0 | 2131 | $1,800 | $0.84 | 44d | 1 | 0.77mi |
| 131 Adkinson Dr Crestview, FL | 4.0 | 1.0 | 1332 | $1,750 | $1.31 | 13d | 1 | 0.78mi |
| 507 Eisenhower Dr Crestview, FL | 3.0 | 2.0 | 1809 | $2,200 | $1.22 | 44d | 1 | 0.78mi |
| 812 Carlton St Crestview, FL | 3.0 | 2.5 | 1393 | $1,495 | $1.07 | 21d | 1 | 0.91mi |
| 304 Strawbridge Dr Crestview, FL | 4.0 | 2.0 | 1650 | $1,850 | $1.12 | 13d | 1 | 0.91mi |
| 197 W 1st Ave Crestview, FL | 3.0 | 2.0 | 1547 | $2,395 | $1.55 | 21d | 1 | 0.93mi |
| 502 Hyde Park Dr Crestview, FL | 3.0 | 2.0 | 1302 | $1,795 | $1.38 | 13d | 1 | 0.99mi |
| 815 Valley Rd Crestview, FL | 3.0 | 2.5 | 1373 | $1,550 | $1.13 | 44d | 1 | 1.13mi |
| 2942 Sholtz Ave Crestview, FL | 3.0 | 2.0 | 1266 | $1,600 | $1.26 | 44d | 1 | 1.22mi |
| 800 Spring Creek Blvd Crestview, FL | 1.0–3.0 | 1.0–2.0 | 1009 | $1,900 | $1.88 | 13d | 28 | 1.27mi |
| 132 Cabana Way Crestview, FL | 3.0 | 2.0 | 1408 | $1,750 | $1.24 | 13d | 1 | 1.40mi |
| 751 Amos St Unit B Crestview, FL | 3.0 | 2.5 | 2163 | $1,695 | $0.78 | 13d | 1 | 1.47mi |
| 6260 Old Bethel Rd Crestview, FL | 1.0–3.0 | 1.0–2.0 | 1253 | $2,295 | $1.83 | 13d | 66 | 1.48mi |
| 178 Cabana Way Crestview, FL | 4.0 | 2.0 | 1284 | $1,800 | $1.40 | 44d | 1 | 1.49mi |
Listing history 39 events
-
2026-06-18days on market $239,900 Active 32 DOM
-
2026-06-17days on market $239,900 Active 31 DOM
-
2026-06-16days on market $239,900 Active 30 DOM
-
2026-06-15days on market $239,900 Active 29 DOM
-
2026-06-14days on market $239,900 Active 27 DOM
-
2026-06-13days on market $239,900 Active 26 DOM
-
2026-06-10days on market $239,900 Active 24 DOM
-
2026-06-09days on market $239,900 Active 23 DOM
-
2026-06-08days on market $239,900 Active 22 DOM
-
2026-06-07days on market $239,900 Active 21 DOM
-
2026-06-05days on market $239,900 Active 18 DOM
-
2026-06-02days on market $239,900 Active 16 DOM
-
2026-06-01days on market $239,900 Active 15 DOM
-
2026-05-31days on market $239,900 Active 14 DOM
-
2026-05-30days on market $239,900 Active 13 DOM
-
2026-05-17$239,900 Active
-
2023-11-04historical $1,695
-
2023-09-24price $1,695
-
2023-08-29price $1,750
-
2023-08-13price $2,095
-
2023-07-21price $2,195
-
2021-06-22historical
-
2021-05-29status Pending
-
2021-05-29historical
-
2021-05-25$179,900 Active
-
2021-05-25$179,900
-
2021-03-08historical
-
2021-02-22status Active
-
2021-02-01status Pending
-
2021-02-01historical
-
2020-12-21status Active
-
2020-12-16status Pending
-
2020-11-20$179,900 Active
-
2020-11-20$179,900
-
2018-05-31historical
-
2018-01-15$98,200
-
2018-01-15$98,200
-
1996-06-13soldstatus $62,500
-
1984-10-01soldstatus $15,000
ⓘ Source: listings_history table (triggers on properties + properties_extension) + one-shot
backfill from property_details.listing_events for pre-trigger history.
Tax reassessment forecast FL · Resets to sale price
- Current annual tax
- $3,121 · $260/mo
- Projected year-2 tax
- $3,121 · $260/mo
- Expected delta
- $0/yr ($0/mo · 0.0%)
ⓘ Screening estimate from a state-policy table — verify with the county assessor before closing.
Climate risk First Street
- Flood 1/10 Low FEMA zone X (unshaded) · 0% chance over 30 yrs
- Wildfire 3/10 Moderate
- Heat 9/10 Extreme 7 d/yr ≥107°F today · 19 d/yr by 30 yrs out
- Wind 9/10 Extreme 99% chance of damaging wind over 30 yrs
- Air quality 2/10 Low 1 unhealthy d/yr today · 1 by 30 yrs out
Nearby sold comps map
Loading sold comps map…
Walkable amenities ~0.75 mi
Loading nearby amenities…
Taxation est. · year 1
- Rental income
- $24,659
- − Mortgage interest
- −$13,438
- − Property taxes
- −$3,121
- − Insurance
- −$1,200
- − Repairs & maintenance
- −$1,973
- − Management
- −$1,973
- − Depreciation
- −$6,979
- Taxable loss
- −$4,023
- Est. tax savings @ 24.0%
- +$966
- After-tax cash flow
- $1,030/yr
For passive investors: Depreciation is non-cash, so a rental often shows a tax loss while cash-flowing — sheltering income. Rental losses are passive: they offset passive income freely, and up to $25,000/yr can offset ordinary (W-2) income if you actively participate and your MAGI is under $100k (phasing out to $0 by $150k); unused losses carry forward. On sale, claimed depreciation is recaptured at up to 25%, and gains may owe capital-gains tax (a 1031 exchange can defer both). Figures are a year-1 estimate at your 24.0% rate — not tax advice; consult a CPA.
Schools (NCES district)
- District
- Okaloosa
- NCES district ID
- 1201380
- Math proficiency
- 60% ▼ -12.00%
- Reading proficiency
- 60% ▼ -4.00%
- Median HH income
- $55,601
- Composite
- 51.62/100
- National rank
- #1705
- State rank
- #12 of 73 in FL
Livability — Crestview
- Score
- 75/100
- State rank
- #252
- US rank
- #3858
Category grades
Schools grade is shown separately in the Schools card above.
Census & demographics
- Census place
- Crestview, FL
- County
- Okaloosa County · 194,352 people
- City population
- 58,889
- Metro
- Crestview-Fort Walton Beach-Destin, FL
- Population (ZIP)
- 25,599
- Household income
- $78,119
- Rent vs Own
- Severe rent burden
- 634.0
Population outlook (Okaloosa County) Hauer SSP2
- Today (2025)
- 235,133 people
- By 2030
- 253,483 · +7.8%
- By 2040
- 289,537 · +23.1%
- By 2050
- 322,954 · +37.3%
- By 2075
- 399,624 · +70.0%
- By 2100
- 425,311 · +80.9%
Race, ethnicity, and origin ACS 2023
- Neighborhood character
- Diverse neighborhood (Simpson 0.56)
- Race & ethnicity
- White 64% Black 16% Hispanic / Latino 12% Two or more races 9% Asian 3%
- Hispanic origin (detail)
- Mexican 4% Puerto Rican 2% Dominican 1%
- Common ancestry
- Lithuanian 2% Slovak 2% Italian 2%
- Foreign-born
- 6% · Canada, South Korea
- Languages at home
- 91% English-only · Spanish 7% Tagalog/Filipino 1%
Political lean MEDSL · Okaloosa
- 2024 margin
- Solid R (+42.4) · D 28.2% · R 70.7% · Other 1.1%
- 2008→2024 swing
- +2.5pp toward D · 2008: -44.9pp · 2024: -42.4pp
- All cycles
- 2024: R+42.4 2020: R+39.1 2016: R+47.8 2012: R+49.4 2008: R+44.9
Not yet ingested
- Civics
- —
Market trends
- HPI YoY
- ▼ -51.48%
- Current HPI
- 265.9926
- Rent YoY
- ▲ 1.17%
- Metro
- Crestview-Fort Walton Beach-Destin, FL
- State GDP YoY
- ▲ 3.28%
- F500 in state
- 36
Industry mix (Fortune 500 HQ in FL)
| Industry | F500 HQs | Revenue |
|---|---|---|
| Industrial Technology | 2 | $29B |
|
||
| Insurance | 2 | $17B |
|
||
| Retail | 1 | $60B |
|
||
| Technology Distribution | 1 | $58B |
|
||
| Homebuilding | 1 | $35B |
|
||
| Technology Manufacturing | 1 | $35B |
|
||
Price history
+1499.3% since first listed24 events — show timeline
- 2026-05-17 Listed $239,900 ECAR
- 2023-11-04 Rental Removed $1,695 APPFOLIO
- 2023-09-24 Price Changed $1,695 APPFOLIO
- 2023-08-29 Price Changed $1,750 APPFOLIO
- 2023-08-13 Price Changed $2,095 APPFOLIO
- 2023-07-21 Price Changed $2,195 APPFOLIO
- 2021-06-22 Delisted — ECAR
- 2021-05-29 Pending — ECAR
- 2021-05-29 Listing Removed — NAMLS
- 2021-05-25 Listed $179,900 ECAR
- 2021-05-25 Listed $179,900 NAMLS
- 2021-03-08 Delisted — ECAR
- 2021-02-22 Relisted — ECAR
- 2021-02-01 Pending — ECAR
- 2021-02-01 Listing Removed — NAMLS
- 2020-12-21 Relisted — ECAR
- 2020-12-16 Pending — ECAR
- 2020-11-20 Listed $179,900 ECAR
- 2020-11-20 Listed $179,900 NAMLS
- 2018-05-31 Listing Removed — NAMLS
- 2018-01-15 Listed $98,200 NAMLS
- 2018-01-15 Listed $98,200 ECAR
- 1996-06-13 Sold (Public Records) $62,500 Public Records
- 1984-10-01 Sold (Public Records) $15,000 Public Records
Property tax history
+14.0%/yrLatest (2025): $3,121 · +3.7% YoY. Source: county tax records.
Cash-flow waterfall
monthlySold comps — $/sqft
last 12 mo · ≤1 miLoading sold comps…