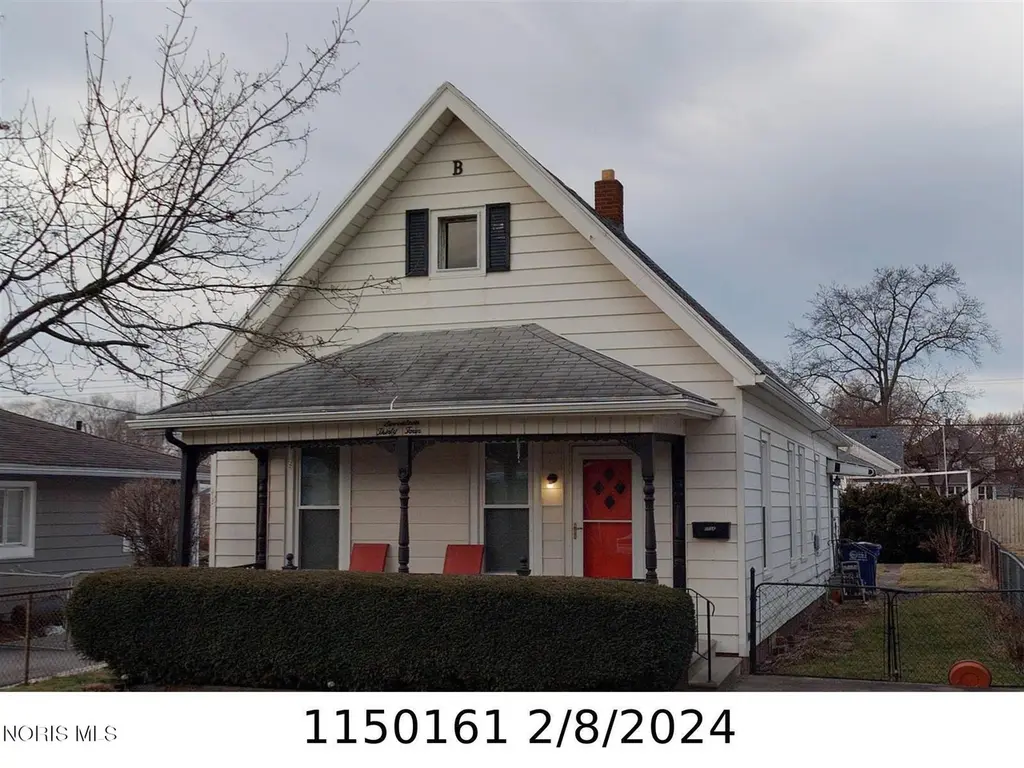
1734 Pool St · Toledo, OH
Flood risk 1/10 · Minimal
- FEMA flood zone
- X (unshaded)
- Chance of flooding over 30 yrs
- 0.0%
- Est. flood insurance / yr
- $507 – $1,088
Fire risk 1/10 · Minimal
- Est. fire insurance / yr
- $713 – $1,323
Heat risk 3/10 · Minor
- Hot days now (above 100°F)
- 7 days/yr
- Hot days in 30 yrs
- 16 days/yr
Wind risk 2/10 · Minimal
- Chance of severe wind over 30 yrs
- —
Air-quality risk 2/10 · Minimal
- Unhealthy air days now
- 1 days/yr
- Unhealthy air days in 30 yrs
- 2 days/yr
Risk factors via First Street. Map © Google.
Why this score? — see what drove the B grade
The composite is a weighted blend of 9 inputs, each scored 0–100. Each bar is that input's sub-score; the figure is the points it added to the 100-point composite (weight × sub-score).
- Cash flow +27.5/30.0
- ARV discount +15.0/15.0
- DSCR +9.6/10.0
- 1% rule +7.6/10.0
- Rent growth +3.8/5.0
- Livability +3.3/5.0
- Condition / age +2.5/5.0
- Schools +1.6/10.0
- Appreciation +0.0/10.0
$75,000
🖨 Deal sheet 📄 Offer letter ✓ Due diligence
Listing remarks MLS
Perfect starter home or investment. Large living room could be used as living room/dining room combo. Kitchen can fit small table as well. Back family room could easily be used as a large bedroom. Possession at close.
Key facts
- Gutters
- Roof
- Family room
Tags
Property features AI
Exterior
- Parking: 4 parking spaces; Driveway; Off-street parking; On-street parking
- Utilities: Electricity connected; Natural gas connected; Public sewer; Public water; Sewer connected; Water connected
- Home design: Single-family house; One story
- Construction: Aluminum siding; Block and combination foundation; Shingle roof; Built as a residential single family residence
- Exterior features: Front porch; Covered porch; Chain link fencing; City street frontage
Interior
- Kitchen: Gas oven; Refrigerator
- Bedrooms: Bedroom 2 on the main level
- Flooring: Carpet; Laminate
- Bathrooms: 1 bathroom
- Heating & cooling: Forced air heating; Natural gas heating
- Interior features: Ceiling fans throughout; 5 total rooms; Basement with interior entry (unfinished)
- Laundry & utility: Laundry area (other)
Neighborhood map
What this means for you Summary
Snapshot
- This is a 2-bed/1.0-bath single-family listed at $75k.
Deal economics
- At list price, monthly cash flow is $221 ($3k/yr) — positive.
- The deal already cash-flows at list — no discount required.
- Meets the 1% rule at list price ($947 rent vs $75k).
- Cap rate 9.8% vs local median 7.6% in Toledo — meaningfully above typical; check what's discounted (condition, days-on-market, listing class) to confirm the premium yield is real.
Location & tenants
- Location reads 66/100 on livability (#645 in OH) — a middle-class / working-renter tenant base. Strengths: cost of living A+, housing A+, health & safety A+; Watch: amenities C-, crime F, commute F.
- Toledo City (urban): math 15% / reading 24% proficiency, ranked #634 of 656 in OH (top 97%) — low school quality limits family demand, transient renter base, plan for 1-2y turnover; 72% free/reduced lunch — lower-income household profile, screen leases tightly.
- Zoned schools: Oakdale Elementary School (math 13% / reading 21%, grade F, #1,337 of 1,584 statewide, top 86%, 385 students, 0% FRL); Waite High School (math 12% / reading 24%, grade F, #687 of 781 statewide, top 88%, 997 students, 0% FRL) — zoned schools average 0% FRL vs 72% district-wide (72 pts lower); this property's tenant base skews higher-income than the district average.
- Market conditions: Rents rising fast (+5.4%/yr); 117 active listings in the ZIP; 19 comparable units currently listed for rent nearby; rentals lingering (median 44d on market — plan ~5-8 weeks vacancy on turnover, expect pricing pressure); 53% of comp listings sitting > 30 days — soft ceiling on asking rent; lower-income renter base — watch delinquency; 415 units permitted in Lucas County in 2024 (122 in 5+ unit buildings).
Forward outlook
- Local home prices are declining (-3.0%/yr); year-one equity from $519 of loan paydown is wiped out by about $2k of value loss. Plan a longer hold.
- Lucas County population projected at -16% by 2050 — secular population decline; favor cash flow + early exit over multi-decade hold.
- At projected returns (-3.0% appreciation + 5.4% rent growth), your $21k cash investment doubles in ~8 years — after that, you're playing with house money.
Negotiation context
- Only 7 days on market — expect competitive offers; lowballing is unlikely to land.
- 2 sale attempts since 9y ago with the ask held roughly flat each time — persistent listings suggest the price (not the market) is what's stuck; bring a comps-based counter.
- Current owner paid $22k; list at $75k implies a 241% gain — meaningful room to come down on a strong offer.
Risks & watch-outs
- Watch-outs: built in 1907 — expect roof / HVAC / electrical / plumbing capex.
Questions for the listing agent
- Built in 1907 — when were the roof, HVAC, electrical panel, plumbing, and water heater last replaced?
- Is there a deadline driving the sale (1031 exchange, divorce, estate, relocation)? That informs how much negotiation room exists.
- Schools are D-rated, which usually means shorter tenancies and higher turnover. Who's the typical renter profile here, and what's been the actual vacancy rate?
- Crime grade is F in this area — have there been break-ins, vandalism, or insurance claims at this property in the last 3 years? What carrier currently insures it and at what premium?
- What's the average days-on-market for RENTAL listings here right now (not sales)? A rising rental-DOM trend means longer vacancies and softer asking-rent achievability than the comps imply.
- What's the recent tenant-quality profile in this submarket — average credit score on applications, eviction rate, late-payment / NSF rate, and stable-employment percentage? A property-management company in the area should have these aggregated.
- How much new for-sale + rental construction is in the pipeline within 1–3 miles? Heavy new supply typically softens prices + rents 12–24 months out; constrained supply supports both.
Investment metrics
- 1% rule
- 1.26% ✓
- Cap rate
- 9.83%
- Cash-on-cash
- 12.65%
- DSCR
- 1.56
- GRM
- 6.6
CMA / ARV
- ARV (on-the-fly)
- $117,216
- Comps found
- 12
Show comp detail 12 sales within ~0.75 mi
| Address | Dist | Beds/Ba | Sqft | Sold | Price | $/sf | Match |
|---|---|---|---|---|---|---|---|
| 1521 Remington St | 0.30mi | 3/1.0 (+1) | 1,030 (-2%) | 9mo | $130,000 | $126 | 69 |
| 142 E Plumer St | 0.14mi | 3/1.0 (+1) | 981 (-7%) | 11mo | $30,000 | $31 | 68 |
| 1525 Akron St | 0.28mi | 3/1.0 (+1) | 999 (-5%) | 8mo | $93,500 | $94 | 67 |
| 709 Sylvester Ave | 0.29mi | 3/1.0 (+1) | 1,112 (+5%) | 8mo | $103,000 | $93 | 66 |
| 1455 Oak St | 0.34mi | 3/1.0 (+1) | 1,116 (+6%) | 5mo | $63,500 | $57 | 65 |
| 541 Oakdale Ave | 0.28mi | 2/1.5 | 936 (-11%) | 3mo | $126,000 | $135 | 64 |
| 1813 Milroy St | 0.39mi | 2/1.0 | 960 (-9%) | 4mo | $60,480 | $63 | 63 |
| 1406 Utah St | 0.47mi | 2/1.0 | 1,144 (+8%) | 8mo | $30,000 | $26 | 58 |
| 1537 Akron St | 0.26mi | 3/2.0 (+1) | 1,188 (+12%) | 3mo | $131,500 | $111 | 56 |
| 125 Chesapeake Ln | 0.62mi | 3/1.0 (+1) | 936 (-11%) | 2mo | $157,000 | $168 | 45 |
| 1903 Sharon Dr | 0.61mi | 3/1.0 (+1) | 1,176 (+11%) | 10mo | $200,000 | $170 | 39 |
| 323 Brentwood Dr | 0.67mi | 3/1.0 (+1) | 1,206 (+14%) | 10mo | $198,500 | $165 | 31 |
Match score weights: distance 35% · size 25% · config 20% · recency 20%. Top-matched comps best support the ARV.
Projected returns pro-forma
-3.0% appreciation · 5.37% rent growth · sell at horizon
- IRR
- 5.1%
- Equity multiple
- 1.20×
- Total profit
- $4,274
- Equity at exit
- $11,183
- IRR
- 16.6%
- Equity multiple
- 2.52×
- Total profit
- $31,910
- Equity at exit
- $6,485
Cash invested: $21,000 (down + closing). Projections, not guarantees.
Landlord ↔ Tenant lean methodology
- Overall (STATE)
- 73 Landlord-Friendly
- State Ohio
- 73 Landlord-Friendly · R+6
- County
- — inherits STATE
- City
- — inherits STATE
ZIP-level market 43605
- Home prices YoY
- -25.6%
- Rents YoY
- 5.4%
- Active inventory
- 117
- Price-to-rent
- 6.6×
Monthly cashflow live
- Estimated rent
- $947 high interval (Pro) →
- Mortgage (P&I)
- −$393
- Tax from tax record
- −$102 /mo · $1,227/yr
- Insurance
- −$31
- HOA
- −$0
- Vacancy / Maint / Mgmt
- −$199
- Net cashflow
- $221
Break-even live
UW: 25.0% down · 7.5% · 30yr · 1.5% tax · 5.0% vac · 8.0% maint · 8.0% mgmt
Financing live
Cash to close
- Down payment
- $18,750
- Closing costs
- $2,250
- Reserves months
- —
- Total cash needed
- —
Loan-product check · same deal, 3 products live
Conventional
25% down · 7.5% · 30yr
- Down + closing
- —
- Monthly P&I
- —
- Monthly cashflow
- —
- DSCR
- —
- Eligible?
- —
Personal DTI + credit; lowest rate.
DSCR
20% down · 8.5% · 30yr
- Down + closing
- —
- Monthly P&I
- —
- Monthly cashflow
- —
- DSCR
- —
- Eligible?
- —
No personal income docs; deal must DSCR.
Hard money
10% down · 12.0% · 12mo
- Down + closing
- —
- Monthly P&I
- —
- Monthly cashflow
- —
- DSCR
- —
- Eligible?
- —
Short-term bridge; refi at stabilization.
Rent comps 19 comps
| Address | Beds | Baths | Sqft | Rent | $/sqft | DOM | Units | Dist |
|---|---|---|---|---|---|---|---|---|
| 1537 Remington St Toledo, OH | 3.0 | 1.0 | 1064 | $1,095 | $1.03 | 43d | 1 | 0.27mi |
| 1411 Oakmont St Toledo, OH | 1.0 | 1.0 | 750 | $800 | $1.07 | 14d | 1 | 0.45mi |
| 2480 Tracy Rd Northwood, OH | 1.0–2.0 | 1.0 | 717 | $1,015 | $1.41 | 14d | 1 | 0.69mi |
| 1537 Carlyle St Toledo, OH | 2.0 | 1.0 | 800 | $800 | $1.00 | 23d | 1 | 0.80mi |
| 1205 Liberty St Unit NA Toledo, OH | 3.0 | 1.0 | 864 | $1,195 | $1.38 | 43d | 1 | 0.88mi |
| 950 Oak St Unit 1 Toledo, OH | 2.0 | 1.0 | 725 | $700 | $0.97 | 43d | 1 | 0.93mi |
| 946 Butler St Toledo, OH | 2.0 | 1.0 | 944 | $650 | $0.69 | 43d | 1 | 0.96mi |
| 912 Willow Ave Toledo, OH | 1.0 | 1.0 | 900 | $850 | $0.94 | 43d | 1 | 1.04mi |
| 908 Forsythe St Unit Downstairs Toledo, OH | 3.0 | 1.0 | 1164 | $950 | $0.82 | 43d | 1 | 1.09mi |
| 908 Forsythe St Unit Upstairs Toledo, OH | 2.0 | 1.0 | 1164 | $900 | $0.77 | 14d | 1 | 1.09mi |
| 834 Oak St Toledo, OH | 3.0 | 1.0 | 1064 | $900 | $0.85 | 43d | 1 | 1.12mi |
| 1106 White St Toledo, OH | 3.0 | 1.0 | 1200 | $1,015 | $0.85 | 14d | 1 | 1.20mi |
| 948 White St Toledo, OH | 3.0 | 1.0 | 1024 | $1,135 | $1.11 | 14d | 1 | 1.29mi |
| 724 Plymouth St Toledo, OH | 1.0 | 1.0 | 850 | $750 | $0.88 | 14d | 1 | 1.40mi |
| 724 Plymouth St Toledo, OH | 2.0 | 1.0 | 819 | $750 | $0.92 | 43d | 1 | 1.40mi |
| 1505 Navarre Ave Toledo, OH | 3.0 | 1.0 | 1331 | $1,145 | $0.86 | 43d | 1 | 1.43mi |
| 244 Knower St Toledo, OH | 3.0 | 1.0 | 1120 | $995 | $0.89 | 14d | 1 | 1.45mi |
| 537 Potter St Toledo, OH | 2.0 | 1.0 | 1200 | $625 | $0.52 | 23d | 1 | 1.48mi |
| 537 Potter St Toledo, OH | 1.0 | 1.0 | 1000 | $600 | $0.60 | 43d | 1 | 1.48mi |
Listing history 6 events
-
2026-06-18days on market $75,000 Active 7 DOM
-
2026-06-17days on market $75,000 Active 6 DOM
-
2026-06-16days on market $75,000 Active 5 DOM
-
2026-06-15days on market $75,000 Active 4 DOM
-
2026-06-14remarks 150-char remark
-
2026-06-14$75,000 Active 2 DOM
ⓘ Source: listings_history table (triggers on properties + properties_extension) + one-shot
backfill from property_details.listing_events for pre-trigger history.
Tax reassessment forecast OH · Partial reset (capped growth)
- Current annual tax
- $1,227 · $102/mo
- Projected year-2 tax
- $1,227 · $102/mo
- Expected delta
- $0/yr ($0/mo · 0.0%)
ⓘ Screening estimate from a state-policy table — verify with the county assessor before closing.
Climate risk First Street
- Flood 1/10 Low FEMA zone X (unshaded) · 0% chance over 30 yrs
- Wildfire 1/10 Low
- Heat 3/10 Moderate 7 d/yr ≥100°F today · 16 d/yr by 30 yrs out
- Wind 2/10 Low
- Air quality 2/10 Low 1 unhealthy d/yr today · 2 by 30 yrs out
Nearby sold comps map
Loading sold comps map…
Walkable amenities ~0.75 mi
Loading nearby amenities…
Taxation est. · year 1
- Rental income
- $11,364
- − Mortgage interest
- −$4,201
- − Property taxes
- −$1,227
- − Insurance
- −$375
- − Repairs & maintenance
- −$909
- − Management
- −$909
- − Depreciation
- −$2,182
- Taxable income
- $1,561
- Est. tax owed @ 24.0%
- −$375
- After-tax cash flow
- $2,281/yr
For passive investors: Depreciation is non-cash, so a rental often shows a tax loss while cash-flowing — sheltering income. Rental losses are passive: they offset passive income freely, and up to $25,000/yr can offset ordinary (W-2) income if you actively participate and your MAGI is under $100k (phasing out to $0 by $150k); unused losses carry forward. On sale, claimed depreciation is recaptured at up to 25%, and gains may owe capital-gains tax (a 1031 exchange can defer both). Figures are a year-1 estimate at your 24.0% rate — not tax advice; consult a CPA.
Schools (NCES district)
- District
- Toledo City
- NCES district ID
- 3904490
- Math proficiency
- 15% ▼ -16.00%
- Reading proficiency
- 24% ▼ -13.00%
- Median HH income
- $32,137
- Composite
- 15.76/100
- National rank
- #9276
- State rank
- #634 of 656 in OH
Livability — Toledo
- Score
- 66/100
- State rank
- #645
- US rank
- #11442
Category grades
Schools grade is shown separately in the Schools card above.
Census & demographics
- Census place
- Toledo, OH
- County
- Lucas County · 380,724 people
- City population
- 280,811
- Metro
- Toledo, OH
- Population (ZIP)
- 24,441
- Household income
- $39,118
- Rent vs Own
- Severe rent burden
- 1257.0
Population outlook (Lucas County) Hauer SSP2
- Today (2025)
- 420,751 people
- By 2030
- 410,187 · -2.5%
- By 2040
- 384,019 · -8.7%
- By 2050
- 355,125 · -15.6%
- By 2075
- 291,683 · -30.7%
- By 2100
- 233,670 · -44.5%
Race, ethnicity, and origin ACS 2023
- Neighborhood character
- Diverse neighborhood (Simpson 0.61)
- Race & ethnicity
- White 57% Hispanic / Latino 21% Black 14% Two or more races 14%
- Hispanic origin (detail)
- Mexican 17% Puerto Rican 2%
- Common ancestry
- Romanian 3% Lithuanian 2% Portuguese 1%
- Foreign-born
- 3% · Canada
- Languages at home
- 91% English-only · Spanish 7% Arabic 1%
Political lean MEDSL · Lucas
- 2024 margin
- D (+12.6) · D 55.8% · R 43.2%
- 2008→2024 swing
- -18.9pp toward R · 2008: 31.4pp · 2024: 12.6pp
- All cycles
- 2024: D+12.6 2020: D+16.8 2016: D+17.4 2012: D+30.4 2008: D+31.4
Not yet ingested
- Civics
- —
Market trends
- HPI YoY
- ▼ -47.85%
- Current HPI
- 138.6894
- Rent YoY
- ▲ 5.37%
- Metro
- Toledo, OH
- State GDP YoY
- ▲ 1.98%
- F500 in state
- 48
Industry mix (Fortune 500 HQ in OH)
| Industry | F500 HQs | Revenue |
|---|---|---|
| Insurance | 3 | $145B |
|
||
| Industrial Machinery | 3 | $49B |
|
||
| Financial Services | 3 | $24B |
|
||
| Consumer Goods | 2 | $93B |
|
||
| Aerospace / Defense | 2 | $47B |
|
||
| Utilities | 2 | $33B |
|
||
Price history
+240.9% since first listed3 events — show timeline
- 2026-06-10 Listed $75,000 NORIS
- 2017-05-31 Sold (MLS) $22,000 NORIS
- 2017-05-20 Listed $22,000 NORIS
Property tax history
+14.0%/yrLatest (2025): $1,227 · +1.0% YoY. Source: county tax records.
Cash-flow waterfall
monthlySold comps — $/sqft
last 12 mo · ≤1 miLoading sold comps…